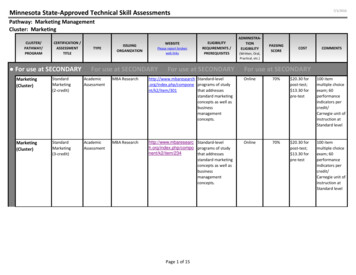
Transcription
International Journal of Business and Social ScienceVol. 4 No. 11; September 2013Likert Data: What to Use, Parametric or Non-Parametric?Jacqueline MurrayDepartment of Business and Management StudiesUniversity of Guyana Berbice CampusTain, Corentyne, GuyanaAbstractThe objective of the study was to determine whether the type of statistical tests conducted on Likert scale dataaffect the conclusions. Pearson, Spearman rho and Kendall tau b analyses conducted on actual scale datarevealed that there was a positive relationship between all the permuted pairs of the variables at the p .05 level.However the relationship between the variables indicated a weak relationship for all of the tests except for therelationship between the constructs academic self-regulation and learning styles for which the Pearson andSpearman rho lead to the conclusion ofa moderate relationship. The coefficient of determination calculated toascertain the amount of variability between the permuted pairs of the variables revealed similar variability forallof the variables except for the variables academic self-regulation and learning styles where yet again theconclusions for the Pearson and Spearman rho were similar and that forKendall tau b different.Keywords: Likert scale data, Pearson, Spearman, Kendall tau b, correlation, parametric, non-parametric1. IntroductionEducation practitioners, business organisations, and those new to the field of research, students for example, areoften faced with the decision as to what analysis to conduct on the Likert scale data collected from surveys. Thereis often a level of indecision, especially on the part of those new to research, whether to use parametric or nonparametric tests especially in the light of the discordant views outlined in the literature regarding the use of theseanalyses for Likert scale data.Vigderhous (1977) opine that the assumptions regarding the measurement level ofthe data and the corresponding analysis to be used affect the conclusions.Norman (2010) suggests that Likert data can be analysed using parametric tests without “fear of coming to thewrong conclusion “as contended byJamieson (2004). The question is therefore asked: Do the type of analysesconducted on Likert scale data affect the conclusions drawn from the results? To provide an answer to thisquestion the following hypotheses are posed.1.2 HypothesesHo: The type of analyses conducted on Likert scale data does not affect the conclusions drawn from the results.Ha: The type of analyses conducted on Likert scale data affects the conclusions drawn from the results.1.3 ObjectiveThe objective of the study is to determine whether the type of analyses conducted on Likert scale data affect theconclusion drawn from the results obtained.1.4 Associated significance of studyIt is hoped that the determination of the effect of conducting parametric or non-parametric tests on Likert scaledata will enable researchers, especially those new to the field of research, students for example, to select aparticular test with some degree of confidence.258
Center for Promoting Ideas, USAwww.ijbssnet.comIt is also envisioned that the since the study uses actual scale data in the investigation that the findings willprovide empirical evidence as to the type of tests to conduct on Likert scale data thus contributing to the body ofknowledge existing in the field.1.5 LimitationsThe researcher tested the hypotheses posed by the study through conducting Pearson, Spearman and Kendalltau b Correlation analyses on the summed scores of the Likert scale data which measured specific constructs andnot on the individual items which comprised the constructs hence any interpretation on the applicability of usingparametric or non-parametric tests on Likert scale data is in relation to correlation analyses conducted onsummated scales.2. Literature ReviewSince the development of the Likert scale, named after the inventor, Rensis Likert, many researchers havedeveloped instruments to measure particular attributes or traits of individuals or groups. The instruments usuallyrequire respondents to give their level of agreement or disagreement, which can range from 1 to 5, to thestatements/questions/items relating to the attribute/trait being measured. Prior to statistically analysing the data,the ratings are sometimes summed to derive an overall score for the attribute/trait measured or used as reported.The controversy begins with the type of analysis to use – parametric or non-parametric?Carifio and Perla,Resolving the 50-year debate around using and misusing Likert scales (2008) believe the issue of whether aparametric test or non-parametric one is suited to the analysis of Likert scale data stems from the views of authorsregarding the measurement level of the data itself: ordinal or interval. Gardner and Martin(2007) and Jamieson(2004) contend that Likert data is of an ordinal or rank order nature and hence only non-parametric tests will yieldvalid results. However, Norman (2010)using real scale data found that parametric tests such as Pearsoncorrelation and regression analysis can be used with Likert data without fear of “coming to the wrong conclusion”as Jamieson (2004) puts it. However, Vigderhous(1977) found that the interchangeable use of parmetric and nonparmetric tests on ordinal data results in different conclusions. Creswell(2008)suggeststhat for Likert data to betreated as interval data there is need to develop multiple categories within a scale, establish equality of variancebetween each value on the scale and normality of the data.Carifio and Perla(2007) believe that the lack of understanding of the difference between Likert scales and Likertresponse formats is the root of the confusion. Added to this is the practice of researchers to analyse the responsesto Likert scale questions item by item rather than asa collection of items measuring a particular attribute. Carifioand Perla, Resolving the 50-year debate around using and misusing Likert scales (2008)argue that those who holdthe “ordinalist” view of Likert scales do not consider the abundance of empirical research that have supported theinterval view and opined that it is perfectly all right to use the summed scales to conduct parametric tests. Pell(2005) agrees that parametric tests can be conducted on the summed scores of Likert scale data provided that theassumptions are clearly stated and the data is of the appropriate size and shape.Clearly, the divisive views regarding the measurement level of Likert data and the type of statistical analysis toconduct in addition to the practice of researchers to analyse the data item by item or as a summed scale mayproduce doubt in researchers, particularly those new to the field of research, such as students, as to the appropriatestatistical test to conduct hence the thrust of the present study.3. MethodologyThe objective of the study is to determine whether the type of statistical tests conducted on Likert scale dataaffects the conclusion drawn from the results obtained.3.1 SampleThe data used in the analysis comprised scale data from a prior study for 111 students at a university campuswhich measured the variables (constructs), mathematics self-efficacy, academic self-regulation, availability ofacademic resources and learning styles which had required students to select from a range of responses usingthree different Likert 5 point scales ranging from 5 strongly agree to 1 strongly disagree; 5 every time to 1 never and 5 very true of me to 1 not at all. The summed scores of the responses relating to the individualconstructs used in the analyses are displayed in Table 1.259
International Journal of Business and Social ScienceVol. 4 No. 11; September 20131.6 Research designThe researcher made use of Pearson, Spearman and Kendall tau b correlations to test the hypotheses posed by thestudy.The Pearson coefficient measures the strength of the linear relationship between two variables, Spearmanrho establishes whether two variables are independent (Rumsey, 2009) and Kendall tau b like Pearson measuresthe strength of the relationship between two variables (Crichton, 2001). The strength of relationships between twovariables range from 1 to -1. The positive sign indicates that increases in one variable leads to increases in theother and a negative sign indicates that as one variable reduces the other increases.To interpret the strength of the correlation researchers use the rule of thumbs that correlations close to or beyond 0.70 or - 0.70 indicate a strong relationship; correlations closer to 0.5 and -0.5 show a moderaterelationship(Rumsey, 2009); and by inference correlations less than 0.5 and -0.5 a weak relationship. However,the statistics derived from these tests do not tell about the amount of variability between two variables only thestrength. To ascertain the amount of variability between two variables the coefficient of determination (r 2) iscomputed. The rule of thumb applied here is: where one variable (x) explains a lot of the variability in anothervariable (y) r2falls between .80 to .90 or .70; where one variable (x) helps to explain somewhat the variability in(y) r2fallsbetween .30 to .70 and where one variable ( x ) does not help to explain much of the variability in(y)r2falls between 0 to .30(Rumsey, 2009, p. 76).1.7 ProcedurePearson, Spearman and Kendall tau b correlations were used to ascertain the relationship among the summedscores for the variables academic resources, mathematics self-efficacy, academic-self-regulation and learningstyles. The results were then interpreted to test the hypotheses:Ho: The type of analyses conducted on Likert scale data do not affect the conclusions drawn from the results.Ha: The type of analyses conducted on Likert data affects the conclusions drawn from the results.Significant path coefficients were set at the .05 level.The variables derived from the analyses were subsequently squared to derive a value for the coefficient ofdetermination commonly used only with the Pearson correlation. An interpretation was again made to test thehypothesis that the type of analyses conducted on Likert scale data do not affect the conclusions drawn from theresults. The Statistical Package for the Social Sciences version 21 aided the analyses.2. Results and DiscussionDoes the type of analysis conducted on Likert scale data affect the conclusions that are made from theresults?The results in Table 2, indicate that in each of the analyses, Pearson, Spearman, Kendal tau b all of the variableswere positively correlated to each other at the 𝑃 .05 level. The conclusion a researcher would come to, if theaim of their study was to investigate whether a relationship existed between pairs of the variables, is that apositive significant relationship exists between every permuted pair of the variables academic resources,mathematics self-efficacy, academic self-regulation and learning styles.Hence the null hypothesis is accepted that the type of analyses conducted on Likert scale data do not affect theconclusions drawn from the results. Further, since the correlation coefficients were .50 the inference is madethat a weak relationship exist between each permuted pair of the variables for all the tests conducted except thosebetween the variables academic self–regulation and learning styles which were moderate for the Pearson andSpearman correlation, .604, and .550 respectively. The null hypothesis is yet again accepted that the type ofstatistical analyses conducted on Likert scale data do not affect the conclusion drawn from the results since thePearson correlation (parametric statistic) and Spearman (non-parametric statistic) yielded similar interpretations.The findings are consistent with those of Norman (2010) that parametric tests can be conducted on Likert scaledata without coming to the wrong conclusion but inconsistent with the claims of Jamieson (2004) and (Gardner &Martin, 2007).260
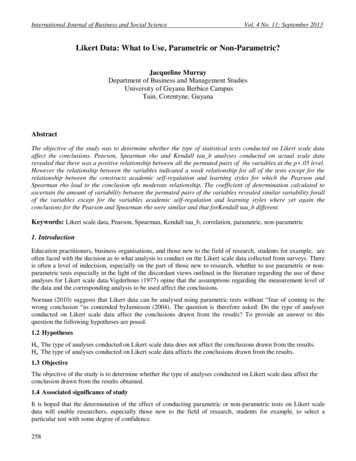
Center for Promoting Ideas, USAwww.ijbssnet.comThe statistic .403 for Kendall tau b revealed that a weak but significant relationship exist between academicresources and learning styles. The finding differs from that of the Pearson and Spearman‟s tests as discussedabove and one may argue that in this instance that the null hypothesis should be rejected in favour of the alternatehypothesis that the type of analyses conducted on Likert scale data affect the conclusion drawn from the result.On the face of it this conclusion may be accurate and appears consistent with the claims of Jamieson‟s (2004) andothers that when parametric tests are conducted on Likert scale data researchers run the risk of coming to thewrong conclusion. However, when interpreting the results one need to consider that Kendall tau b takes considersties in its calculations and hence this may have accounted for the dissimilarity of the findings from that of thePearson and Spearman tests. Notwithstanding this both the Pearson (parametric) and Spearman (non-parametric)tests enabled similar conclusions to be drawn from the results.Table 2: Comparative analysis, Pearson Correlation, Spearman rho, Kendall tau b rrelationAcademicResourcesSpearman1Kendall tau b1Pearson.277**CorrelationMathematics SelfEfficacySpearman.266**Kendall tau b.181**correlationPearson.264**CorrelationAcademic SelfRegulationSpearman.292**Kendall tau b.212**correlationPearson.360**CorrelationLearning StylesSpearman.372**Kendall tau b.270**correlation**. Correlation is significant at the 0.01 level **.403**11Further examination of the coefficients of determination in Table 3 calculated on the correlations coefficients inTable 2 reveal that in all of the cases the variables do not help much in explaining the amount of variability w
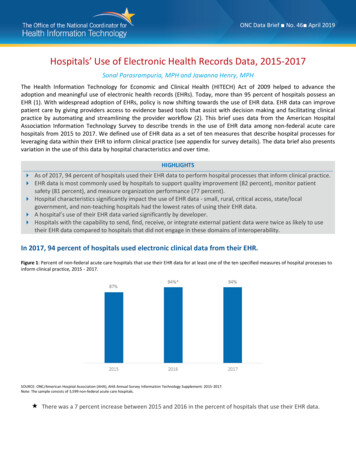
An interpretation was again made to test the hypothesis that the type of analyses conducted on Likert scale data do not affect the conclusions drawn from the results. The Statistical Package for the Social Sciences version 21 aided the analyses. 2. Results and Discussion Does the type of analysis conducted on Likert scale data affect the conclusions that are made from the results? The results .