Transcription
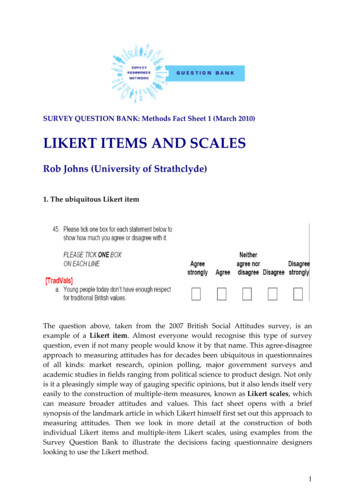
SURVEY QUESTION BANK: Methods Fact Sheet 1 (March 2010)LIKERT ITEMS AND SCALESRob Johns (University of Strathclyde)1. The ubiquitous Likert itemThe question above, taken from the 2007 British Social Attitudes survey, is anexample of a Likert item. Almost everyone would recognise this type of surveyquestion, even if not many people would know it by that name. This agree‐disagreeapproach to measuring attitudes has for decades been ubiquitous in questionnairesof all kinds: market research, opinion polling, major government surveys andacademic studies in fields ranging from political science to product design. Not onlyis it a pleasingly simple way of gauging specific opinions, but it also lends itself veryeasily to the construction of multiple‐item measures, known as Likert scales, whichcan measure broader attitudes and values. This fact sheet opens with a briefsynopsis of the landmark article in which Likert himself first set out this approach tomeasuring attitudes. Then we look in more detail at the construction of bothindividual Likert items and multiple‐item Likert scales, using examples from theSurvey Question Bank to illustrate the decisions facing questionnaire designerslooking to use the Likert method.1
Rob Johns (University of Strathclyde)SQB Methods Fact Sheet 1 (March 2010)Likert Items and Scales2. The basis for Likert measurementRensis Likert was an American psychologist. (Unlike most of those who have used itsince, he pronounced his name with a short ‘i’ sound, as in ‘Lick‐ert’.) What becameknown as the Likert method of attitude measurement was formulated in his doctoralthesis, and an abridged version appeared in a 1932 article in the Archives ofPsychology. At the time, many psychologists believed that their work should beconfined to the study of observable behaviour, and rejected the notion thatunobservable (or ‘latent’) phenomena like attitudes could be measured. Like hiscontemporary, Louis Thurstone, Likert disagreed. They argued that attitudes varyalong a dimension from negative to positive, just as heights vary along a dimensionfrom short to tall, or wealth varies from poor to rich. For Likert, the key to successfulattitude measurement was to convey this underlying dimension to surveyrespondents, so that they could then choose the response option that best reflectstheir position on that dimension. This straightforward notion is illustrated below.NegativeDisagreestrongly greestrongly (5)As far as Likert was concerned, attitudes towards any object or on any issue variedalong the same underlying negative‐to‐positive dimension. This had threesignificant implications. First, his method was universally applicable. In Likert’sown research, he measured opinions on subjects as diverse as birth control, theChinese, evolution, war, and the existence of God. Second, provided that theresponse options covered the negative‐to‐positive dimension, their precise wordingcould vary. Hence Likert’s 1932 article included items worded as in the exampleabove but also some with response scales running from ‘strongly disapprove’ to‘strongly approve’. Third, because responses were comparable across differentquestions – in each case simply reporting how positively or negatively thatrespondent was disposed to the attitude object in question – they could be assignedthe same numerical codes, as illustrated in the diagram above. Furthermore, withmultiple items on the same broad object (such as those listed just above), these codescould be summed or averaged to give an indication of each respondent’s overallpositive or negative orientation towards that object. This is the basis for Likertscales.These advantages of the Likert format – above all, its simplicity and versatility –explain why this approach is ubiquitous in survey research. Yet there are a variety ofRob Johns (University of Strathclyde)SQB Methods Fact Sheet 1 (March 2010)2Likert Items and Scales
Rob Johns (University of Strathclyde)SQB Methods Fact Sheet 1 (March 2010)Likert Items and Scalesreasons why Likert measurement is not quite as simple as it looks. In the rest of thisfact sheet, we examine the reasons why.3. Designing Likert statementsAny Likert item has two parts: the ‘stem’ statement (e.g. “Young people today don’thave enough respect for traditional British values”) and the ‘response scale’ (that is,the answering options offered to respondents). When it comes to stem statements,most of the relevant guidelines would apply to the design of any survey question.They should be simple (and preferably quite short), clear and as unambiguous aspossible. Three rules call for particular attention, however.First, double‐barrelled questions – that is, those that contain two attitude objectsand are therefore potentially asking about two different attitudes – should beavoided. Although this is a well‐known rule, it is often and easily broken, as acouple of examples from the British Social Attitudes survey ��‐‐‐‐‐‐Respondents might reasonably think that cannabis leads to crime (indeed theymight think that it follows logically from cannabis use being criminalised) withoutbelieving that it leads to violence. Equally, they might believe that unpopularschools should be closed but that teachers, rather than losing their jobs, shouldinstead be transferred to the more popular schools. Double‐barrelled questionscreate problems for respondents, who are forced to choose which part of thestatement to address, and for researchers, who have no means of knowing whichpart the respondents chose.Rob Johns (University of Strathclyde)SQB Methods Fact Sheet 1 (March 2010)3Likert Items and Scales
Rob Johns (University of Strathclyde)SQB Methods Fact Sheet 1 (March 2010)Likert Items and ScalesThe second rule is to avoid quantitative statements. This is also best illustrated bysome examples from the British Social Attitudes �‐‐‐‐‐It is the quantitative terms in those questions, ‘always’ and ‘better’, that cause theproblems by introducing ambiguity into ‘disagree’ responses. Take someone whochooses ‘Disagree strongly’ with the first statement. Do they strongly disagree onlywith the policy of prosecuting all dealers, or should we infer that they think cannabisdealers should never be prosecuted? Meanwhile, someone disagreeing with thesecond statement may think that the quality of education is no better in faithschools, or they may think it is actually worse. The key point is that Likert items areintended to capture the extent of agreement or disagreement with an idea, and notto measure some sort of quantity or ‘hidden variable’. If the latter is the purpose ofan item, then it should be recast with response options designed to make thathidden variable explicit. In the second example above, the variable is the ‘relativequality of education in faith schools’, and the response scale should therefore runfrom ‘much better’ to ‘much worse’ (via ‘no different’).Rob Johns (University of Strathclyde)SQB Methods Fact Sheet 1 (March 2010)4Likert Items and Scales
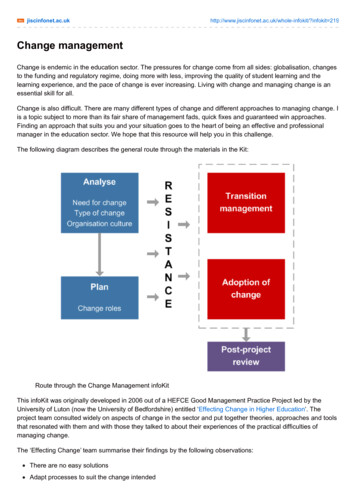
Rob Johns (University of Strathclyde)SQB Methods Fact Sheet 1 (March 2010)Likert Items and ScalesThe third rule concerns leading questions. Normally, questionnaire designers areurged to be even‐handed in their approach, asking questions from a neutralstandpoint and avoiding leading respondents towards a particular answer oropinion. An easily overlooked aspect of Likert items is that, by their very nature,they break this rule. The stem statements are clear and potentially persuasiveassertions. For example, the above statement about faith schools could be argued tolead respondents towards a positive evaluation of the education that those schoolsprovide. This matters because there is ample evidence that respondents are indeedled in this way. Acquiescence bias – a tendency to agree with statements, to someextent irrespective of their content – has long been known to be a serious problemwith the Likert format. Its impact is vividly illustrated by a question wordingexperiment reported by Schuman and Presser (1981, ch. 8).Version A: “Individuals are more to blame than socialconditions for crime and lawlessness in this country”Version B: “Social conditions are more to blame thanindividuals for crime and lawlessness in this country”Agree(%)Disagree(%)60405743Survey respondents were randomly allocated to one of two versions of the stemstatement. These versions were, as the table shows, direct reversals of one another.Hence, since 60% agreed with version A, we would expect only 40% to have agreedwith version B. In fact, though, comfortably over half of respondents agreed on bothversions. This suggests not only that Likert statements can indeed persuaderespondents of the argument that they present, but also that the scale of suchacquiescence bias is considerable. Schuman and Presser therefore advisequestionnaire designers to avoid the Likert format where possible. In this case, theobvious alternative is a question asking respondents “Which do you think is more toblame for crime: individuals or social conditions?”4. Designing the Likert response scaleThe example set out at the beginning of this fact sheet uses what is probably themost common formulation of the Likert response scale. As noted earlier, the manhimself also used an approve‐disapprove format, and it has become quite commonfor people to use the term Likert to refer to almost any rating scale designed tomeasure attitudes. Here, though, we will limit our attention to agree‐disagreequestions. That nonetheless leaves a number of decisions facing question designers.Rob Johns (University of Strathclyde)SQB Methods Fact Sheet 1 (March 2010)5Likert Items and Scales
Rob Johns (University of Strathclyde)SQB Methods Fact Sheet 1 (March 2010)Likert Items and ScalesThe first concerns the number of scale points. While Likert opted for five, there isno theoretical reason to rule out different lengths of response scale. (After all, asnoted above, the options are supposed to reflect an underlying continuum ratherthan a finite number of possible attitudes.) And, in survey practice, various lengths –from two points up to eleven or even more – have been used. The reason why fivehas become the norm is probably because it strikes a compromise between theconflicting goals of offering enough choice (since only two or three options meansmeasuring only direction rather than also strength of opinion) and making thingsmanageable for respondents (since few people will have a clear idea of thedifference between, say, the eighth and ninth point on an eleven‐point agree‐disagree scale). Research confirms that data from Likert items (and those withsimilar rating scales) becomes significantly less accurate when the number of scalepoints drops below five or above seven. However, these studies provide no groundsfor preferring five rather than seven‐point scales.One simple way of illustrating the problems with long scales is that labelling theresponse options becomes extremely difficult. Typically, for seven‐point scales,options labelled ‘slightly agree/disagree’ are introduced either side of the neutralpoint. Much beyond that, though, the shades of agreement become as hard forsurvey designers to express as they are for respondents to distinguish. One wayround this, common with longer scales though not unheard of even with the five‐point version, is to confine verbal labels to the extreme points on the response scale.The points between ‘Strongly agree’ and ‘Strongly disagree’ are simply givennumerical labels. The problem with this simple strategy is that the evidence fromstudies of survey response is unequivocal: full labelling enables respondents todeliver much higher quality data. (They also prefer it.)So far, we have referred almost exclusively to response scales with an odd numberof points. That is because the standard practice, again following Likert’s originalexample, is to include a neutral midpoint. While Likert labelled this point as‘Undecided’, the more common version is now ‘Neither agree nor disagree’. Thepurpose of this option is evidently to avoid forcing respondents into expressingagreement or disagreement when they may lack such a clear opinion. Not onlymight this annoy respondents, but it also risks data quality. It has long beenrecognised that people often lack clear views on even the hottest political topics; atthe same time, they are usually reluctant to use a genuine non‐response option like‘Don’t know’. In that context, the midpoint is a useful means of deterring whatmight otherwise be a more or less random choice between agreement anddisagreement. This helps to explain why the labels typically given to Likertmidpoints are compatible both with ambivalence (i.e. definite but mixed feelings)and indifference (i.e. no particular feelings about the statement).Rob Johns (University of Strathclyde)SQB Methods Fact Sheet 1 (March 2010)6Likert Items and Scales
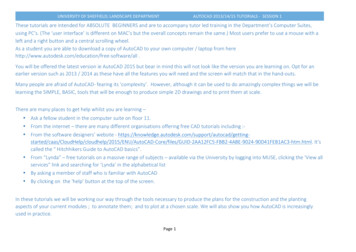
Rob Johns (University of Strathclyde)SQB Methods Fact Sheet 1 (March 2010)Likert Items and ScalesThat said, there may sometimes be a case for forcing respondents to come down onone side or the other. The reason is that some people use the midpoint to avoidreporting what they see as less socially acceptable answers. Another surveyexperiment, taken from Johns (2005) illustrates the point.“It is the governmentʹsresponsibility to provide ajob for everyone who wantsone”Version A: midpointofferedVersion B: midpointomittedAgree(%)Disagree(%)57434852In this case, the two versions of the question varied according to whether a midpointwas included. When that option was offered, one quarter of respondents chose it. Ofthe rest, a majority (57%) reported agreeing with the statement. In contrast, amongrespondents were denied a midpoint, disagreement was (narrowly) the majorityposition (52%). The most plausible explanati
most common formulation of the Likert response scale. As noted earlier, the man himself also used an approve‐disapprove format, and it has become quite common for people to use the term Likert to refer to almost any rating scale designed to measure attitudes. Here, though, we