Transcription
“The Evolution of Student Debt in the U.S.: An Overview”Sandy BaumThe Urban InstituteGeorge Washington University Graduate School of Education and Human DevelopmentOctober 2013The conversation about student debt in the United States has descended into an alarmistfocus on the aggregate amount of education debt (over 1 trillion by some estimates); onstories about individual students who borrowed excessively and are struggling to repay ina weak labor market; on a comparison between credit card debt (which has fallen quite abit in recent years) and education debt (which has not); and on fears of a “student loanbubble” that might follow the path of the housing bubble. Secretary of Education ArneDuncan said recently that the student loan “crisis” has grown so large that it poses “athreat to the American dream.” 1It’s time to take a step back to examine the role of debt in financing postsecondaryeducation, the path over time in postsecondary participation and the accompanyingstudent borrowing, and the basic arguments underlying debt financing of postsecondaryeducation and the government’s role in the system. The sections that follow examinesome of the perspectives on student loan data that can alter the picture that emerges. Isoutstanding debt or annual borrowing more meaningful? Should non-borrowers beincluded in average debt figures? Does the path of total borrowing tell the same story asthe path of borrowing per student? Should we focus on all postsecondary students or onlyon undergraduates? The goal is not to choose the optimal data on which to rely, but toelucidate the different information emerging from different choices about what tomeasure.Outstanding DebtPerhaps the most commonly cited student debt figures are those from the Federal ReserveBank of New York. Table 1 reports outstanding household debt of various types from thesecond quarter of 2003 to the second quarter of 2013. Education debt grew from 243billion in 2003 to 586 billion in 2008 and to 994 billion in 2013. 2 There is no doubtthat this represents rapid growth worthy of attention. But several other facts from thesedata are also relevant. 1Student debt increased from 3% to 9% of outstanding household debt over thedecade. This is a significant change. But mortgage debt is 70% of the total andhome equity revolving credit is another 5%. Widespread default on student loansNathan Porter (2013), “College Ranking Plan in the Works as Student Loan Crisis Poses a ‘Threat to theAmerica Dream’,” Washington Times, September 20.2 The 1 trillion estimate for student debt comes from the Consumer Financial Protection r-look-at-the-trillion/
could be a real problem for many people, but even if the government did not holdthe vast majority of this debt, the economic impact would obviously be on adifferent scale from the collapse of the housing market.Table 1: Outstanding Household Debt, 2003:Q2 to 3Mortgage 5.080 5.967 6.696 7.760 8.706 9.273 9.063 8.703 8.516 8.147 7.841H Eq Rev 0.260 0.367 0.528 0.590 0.619 0.679 0.713 0.683 0.625 0.589 0.540Auto 0.622 0.743 0.774 0.796 0.807 0.810 0.743 0.702 0.713 0.750 0.814Credit Card 0.693 0.697 0.717 0.739 0.796 0.850 0.824 0.744 0.694 0.672 0.668Student 0.243 0.263 0.374 0.439 0.514 0.586 0.675 0.762 0.851 0.914 0.994Other 0.486 0.423 0.402 0.423 0.408 0.401 0.389 0.349 0.330 0.312 0.296Total 7.384 8.460 9.492 10.747 11.850 12.599 12.407 11.943 11.730 11.384 Mortgage69%71%71%72%73%74%73%73%73%72%70%H Eq %Credit 00%100%100%100%100%100%100%100%Source: Federal Reserve Bank of New York, Quarterly Report on Household Debt and Credit Credit card debt increased by 23% between 2003 and 2008, but fell by 21% overthe following five years, ending the decade 25 billion (4%) below its 2003 level.Table 2: Changes in Outstanding Household Debt, 2003 to 2012MortgageHone Equity RevolvingAuto LoanCredit CardStudent %0%23%-21%141%70%-18%-26%71%-11%Source: Federal Reserve Bank of New York, Quarterly Reporton Household Debt and Credit
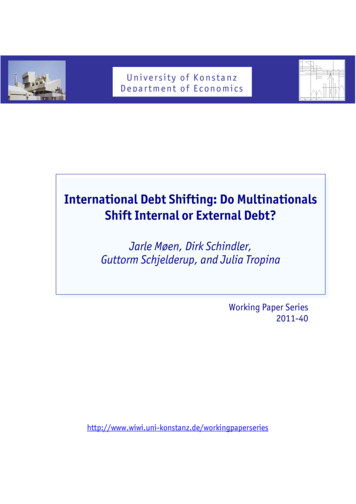
Outstanding student loan debt increased by 70% between 2008 and 2013—onlyhalf the rate of growth over the first half of the decade.Perhaps more fundamental is the question of whether the new focus on outstandingstudent loan debt is the best way to understand the risks facing credit markets, theeconomy, or past, current and future students.Outstanding debt per borrower has not grown nearly as much as total outstanding debt.Enrollment in postsecondary education has increased rapidly in recent years and thenumber of borrowers retiring their debt each year is significantly smaller than the numberincurring debt for the first time.Figure 1 shows the growth in total outstanding student debt relative to the growth in thenumber of borrowers with debt and in average balances. While total debt almost doubledover these six years, average balances increased by 28% (in 2012 dollars).Figure 1: Total Outstanding Education Debt, Total Number of Borrowers, and AverageBalances Relative to 2005,2005:Q4 to 2011:Q4, in 2012 21.001.921.28Average BalanceTotal 411:Q4Source: Federal Reserve Bank of New York, Quarterly Report on Household Debt and CreditOutstanding balances include debt that was incurred many years ago. They includeborrowing by both students and parents, by undergraduate and graduate students. Theyalso include the growth in balances resulting from the accrual of unpaid interest,penalties, and other charges.
Solutions for relieving the strains of student debt should certainly include borrowers withold debts who are struggling and many policy proposals ignore these people. Butunderstanding the trajectory of student borrowing and developing strategies for the futurerequire more information about recent student borrowing patterns. Striking a balancebetween concern about over-dependence on debt for financing postsecondary educationand welcoming increases in borrowing as a sign of increased participation by studentswith limited resources requires more information about how much students on differenteducational paths, from different socioeconomic backgrounds, and of different ages areborrowing.Annual BorrowingTable 3: Total Federal and Nonfederal Loans to Undergraduates, Graduate Students,and Parents of Undergraduate Students, 1970-71 to 2012-13, Selected YearsTotal Borrowing in Millions of 2012 DollarsNon-FederalFederal 010-112011-122012-13 7,622 7,490 0 7,622 7,490 19,276 21,071 24,403 39,364 45,664 67,984 69,083 75,638 90,144 106,648 112,037 109,814 101,469 0 0 0 2,000 6,750 20,860 23,750 25,530 12,390 9,040 8,110 8,130 8,810 19,276 21,071 24,403 41,364 52,414 88,844 92,833 101,168 102,534 115,688 120,147 117,944 110,279PostsecondaryEnrollment 8Total Borrowingper FTE Student 1,066 883 2,186 2,356 2,485 4,066 4,587 6,626 6,820 7,247 7,019 7,339 7,407 7,306 6,928Source: The College Board, Trends in Student Aid 2013The year-by-year data on federal students loans are more accurate than either estimates ofoutstanding debt or the data on the total debt levels of students who graduate withdifferent credentials or who leave school without credentials. Those data are based eitheron samples of students from surveys conducted every four years or on surveys withdisappointing response rates completed every year by colleges and universities.
Total borrowing has increased dramatically since 1970-71, when students borrowed 7.6billion through education loan programs. Thirty years later, in 2000-01, total borrowingthrough these programs had reached 52.4 billion and it more than doubled, to 120.1billion over the next decade. As of 2012-13, however, annual borrowing had fallen fromits 2010-11 peak.Some of the borrowing changes are due to policy changes. For example, the increasefrom 24 billion in 1990-91 to 41 billion in 1995-96 was to a significant extent theresult of the introduction of the unsubsidized Stafford Loan program, which expanded thefederal program from one designed only for students with documented financial need toone including all students.Enrollment growth is another issue. While total borrowing between 2000-01 and 2012-13increased by 110%, from 52.4 billion to 110.3 billion, borrowing per FTE studentincreased by 51%, from 4,587 to 6,928.The decline in both total borrowing and borrowing per student over the last two yearsmay or may not signal a longer-term trend. But these data should serve as a caution tothose who have a tendency to predict that when a trend is unfavorable it is likely tocontinue to be more and more unfavorable. Predictions of doom based on temporarycircumstances generate attention-grabbing headlines. But as the economy rises from thedepths of the Great Recession, fewer students will enroll in college because of the lack ofreasonable alternatives in the labor market and state tax revenues, incomes, and savingswill recover at least to some extent, easing both the upward pressure on tuition prices andthe financing strains on families and students.Debt per Student versus Debt per BorrowerMost discussions of average debt levels focus on debt per borrower, setting aside thesignificant number of college students who do not borrow at all, or at least do not rely oneducation loans. In 2007-08, 34% of bachelor’s degree recipients, 52% of associatedegree recipients, and 37% of those who earned postsecondary certificates did not haveeducation debt. Including these students may obscure some of the potential problemsfacing borrowers, but it paints a clearer picture of how students finance their education.For example, in 2007-08, median debt for bachelor’s degree recipients who borrowedwas 20,000 and 10% borrowed more than 44,500. The median for all bachelor’s degreerecipients was 11,000 and the 90th percentile was 39,300.3Undergraduate and Graduate Students3Sandy Baum and Patricia Steele (2010), Who Borrows Most? Bachelor’s Degree Recipients with HighLevels of Student Debt, The College Board.
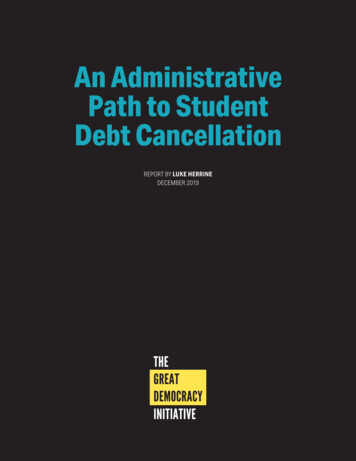
About 87% of all postsecondary students are undergraduate students, while the other 13%are graduate students who have already completed bachelor’s degrees. While graduatestudents may sometimes make unwise choices about education financing, the policyquestions surrounding graduate debt are quite different from those surroundingundergraduate debt.Figure 2: Federal Loans per FTE Undergraduate and per FTE Graduate Studentin 2012 Dollars, 1992-93 to 2012-13Federal Loans per UG student 10,940 6,968 3,406 1,959 18,082 16,239 5,276 13 20,000 18,000 16,000 14,000 12,000 10,000 8,000 6,000 4,000 2,000 0Federal loans per Graduate stduentSource: The College Board, Trends in Student Aid 2013, Figure 3BTable 4: Average Federal Loans per FTE Students, Undergraduate and GraduateStudents, 1992-93 to 2012-13Federal Loansper FTEpostsecondarystudentFederal Loansper UG studentFederal loansper GraduateStudent1992-93 2,574 1,959 6,9681997-98 4,007 3,216 9,4652002-03 4,364 3,406 10,9402007-08 5,418 3,978 14,9372012-13 6,374 4,897 16,239Source: The College Board, Trends in Student Aid 2013
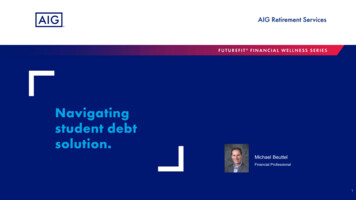
In 2012-13, federal loans per postsecondary student were 6,374. But focusing only onundergraduate students yields an average of 4,897, while graduates students borrowedover three times as much.Graduate student debt may be an increasing problem as the gap in earnings betweenindividuals whose highest degree is a bachelor’s degree and those with advanced degreesgrows, leading more students to continue their studies.4 But policy responses shouldlikely be quite different to this issue than to the undergraduate debt issue. Subsidies forundergraduate students are critical from the perspectives of both equity and efficiency.Some postsecondary education is a virtual necessity for earnings that support a securelifestyle. There is broad consensus that accidents of birth should not prevent people fromhaving the opportunity to access this education. Failing to provide access also leads to aless productive labor force and to greater reliance on publicly funded income supportprograms.The role of public subsidies for graduate education is less clear-cut. Certainly there aresocial benefits to increased educational attainment at this level, but anyone undertakinggraduate study is already a four-year college graduate and public subsidies come largelyfrom taxpayers with lower incomes at the time students are enrolling, and even more soafter they have completed their advanced degrees. Arguments for investing in educationonly if the financial returns are likely to be high enough to justify the expenditure arestronger in the case of graduate education than in the case of undergraduate education.There are certainly exceptions and sound arguments for some level of subsidy. But theidea that graduate student debt, which is held by individuals who have the highestearnings potential of any segment of the population, is a problem to be addressed bypublic policy, are much weaker than similar arguments about undergraduate debt.Nonfederal LoansNonfederal loans, from banks and other private lenders and to a lesser extent from statesand from colleges and universities, may be a particular concern because they do not comewith the repayment protections attached to federal loans.Nonfederal borrowing almost doubled, from about 10.5 billion in 2002-03 to 25.5billion in 2007-08. As was the case in other credit markets, lending standards were lessthan rigorous. Many of the loans made during this period have not yet been repaid andconcerns over this outstanding debt are probably well placed. But the market collapsed in2008-09, and total nonfederal borrowing has been in the 8 to 9 billion range since2009-10.4Between 2001 and 2011, the gap in median earnings between full-time working males ages 25 to34 whose highest degree was a bachelor’s degree and those with only a high school diploma fell from57% to 56%. For those with a master’s degree or higher, the gap grew from 94% to 112% (U.S.Census Bureau).
2012-132011-122010-118.1 8.1 .010.52000-011998-992.0 2.7 3.3 4.16.3 6Billions of 2012 DollarsFigure 3: Total Nonfederal Education Loans, 1995-96 to 2012-13, in 2012 DollarsSource: The College Board, Trends in Student Aid 2013, Table 1In 2007-08, 14% of undergraduates and 11% of graduate students relied on the privateloan market. By 2011-12, those percentages had declined to 6% and 4%, respectively.Both supply and demand forces contributed to this change. The tightening of creditmarkets is evidenced in the decline from 39% to 12% in the percentage of undergraduatesand from 29% to 5% in the percentage of graduate students in for-profit postsecondaryinstitutions taking private loans. But at the same time, federal loan limits forundergraduates have increased and federal GradPLUS loans have become available tograduate students.Table 5: Percentages of Undergraduate and Graduate Students Taking Private Loans,2007-08 and 2011-12 by SectorUndergraduate StudentsPrivate for profitPrivate nonprofit 4-yearPublic 4-yearPublic 2-yearTotalGraduate StudentsPrivate for profitPrivate nonprofit 4-yearPublic %29%12%6%11%5%5%3%4%Source: NCES, National Postsecondary Student Aid Study; Calculations by the author
Evaluating Education BorrowingPeople tend to compare individuals with student loan obligations to those with similarearnings who do not have the same debt. It’s not a surprise that the consumption optionsof former students who borrowed are more limited than those whose parents paid theirway. But what if those students hadn’t borrowed? Chances are they would not have hadthe same education, job, or earnings. The more important comparison is between thestudents’ opportunities with a college education and some debt and their opportunities ifthey did not attend college at all.The fact that students borrow to fund postsecondary education is not in and of itself aproblem. The arguments for debt financing for investments with high expected rates ofreturn are straightforward. Between 2008 and 2011, the gap between the median earningsof high school graduates ages 25 to 34 and those in the same age range with abachelor’s degree or higher declined from 74% to 69% for men and from 79% to 70% forwomen, but the long-term trend is upward. The earnings premium for men rose from 25%in 1971 to 56% in in 1991 and to 69% in 2011. For women it rose from 43% in 1971 to56% in 1991 and to 70% in 2011.5 Moreover, the earnings gap is larger for workers atolder ages.6Average debt levels are not alarming. The popular press notwithstanding, the typicalbachelor’s degree recipient entering the labor market with as much as 30,000 in debtwill not have undue difficult repaying that debt out of the earnings premium from his hereducation.The Federal RoleThe logic of education debt and the manageability of average debt levels for typicalcollege graduates do not diminish the very real problems facing a minority of studentseither because they made unwise decisions about their investments in education orbecause their labor market outcomes have been less favorable than anticipated. As longas there is a public interest in promoting educational opportunities and attainment and aslong as the federal government is, as it should be, the primary source of student loans,public policy must address these issues constructively.Some of the concerns about levels of student debt are voiced in the form ofrecommendations to scale back federal student loan programs. One argument is that theavailability of easy credit gives colleges and universities more leeway to raise theirprices. This position also reflects the idea that the federal government is inappropriatelyencouraging students to over-borrow.Sandy Baum, Jennifer Ma, & Kathleen Payea (2013), Education Pays: The Benefits of Higher Educationfor Individuals and Society, The College Board, Figure 1.6.6Sandy Baum, Charles Kurose & Jennifer Ma (2013), How College Shapes Lives: Understanding theIssues, The College Board, Section 6.5
The private market is likely to offer reasonable terms to students with financially secureco-signers enrolled in bachelor’s degree programs at selective colleges. It is less likely toprovide favorable terms to the students from low-income, first-generation familiesborrowing to finance enrollment in community colleges or to low-income adults seekingcredentials that will make them, for the first time, eligible for jobs paying a living wage.Federal education policy is (or should be) designed to provide opportunities to thosestudents who would otherwise fall through the cracks.The challenges presented by the prevalence of private student loans between 2002-03 and2007-08 provide a reminder about why the federal government is involved in this market.The private market relies on credit histories and collateral in determining its lendingterms. Students tend to have limited credit histories, low incomes, and minimal assets.Many students, including many with weak future prospects, took private loans with highinterest rates. When sufficient federal loans were not available to meet their needs, orwhen they didn’t understand their options, they looked elsewhere.In the current belt-tightening environment, suggestions about risk rating of federalstudent loans have become surprisingly common. The National Association of StudentFinancial Aid Administrators (NASFAA) floated the idea in a recent report. 7 Otherobservers have promoted programs that would modify loan terms based either on theinstitutions in which students enroll or on the characteristics of the students themselves.Some of the suggestions are designed to protect the federal budget. 8 But others aredesigned to protect students against over-borrowing.The idea that offering high-risk students loans with higher interest rates is the best publicpolicy for helping them make wise decisions about their educational paths and how tofinance those paths is unrealistic. The national priority on assuring that students withlimited means can participate in postsecondary education requires that we makereasonable financing options available to them. Suggestions about incorporating riskrating into the federal loan system generally rely on the assumption that students willrespond to market signals and either forego college or choose alternative programs andinstitutions when presented with unfavorable loan terms. Both history and the insights ofbehavioral economics make this seem unlikely. 9 And while there are surely students whowould be better off not pursuing further education than following some of the paths theytake, dismantling the system that allows students with limited financial means anduncertain academic futures the chance to improve their prospects is not a prescription fora healthy economy or an equitable society.7National Association of Student Financial Aid Administrators (MAA) (2013),Reimagining Financial Aidto Improve Student Access and Outcomes, Washington, DC: NASFAA.8Michael Simkovic (2011), “Risk-Based Student Loans,” Washington and Lee Law Review, Vol 70, No.1,p. 527.9 For a discussion of the implications of the insights from behavioral economics for the design of thestudent aid system, see Sandy Baum and Saul Schwartz (2013), “Student Aid, Student Behavior, andEducational Attainment,” Understanding Student Behaviors: A Prerequisite to Supporting CollegeEnrollment and Success. George Washington University Graduate School of Education and HumanDevelopment
Who is Borrowing Too Much?Central questions are who the students with the highest debt levels are and who thestudents with the least manageable debt burdens are. These questions are not the same,since students who are in school for a longer time and earn higher degrees are most likelyto accumulate the most debt—and to have the earnings to repay that debt. Those whoenroll for short periods of time and never earn credentials borrow relatively smallamounts, but also have weak labor market outcomes.The most recent available data on aggregate debt by demographic and educationalcharacteristics are for 2007-08. That year, 25% of bachelor’s degree recipients with debthad borrowed 30,500 or more. The percentage with no education debt at all was 36%.But 53% of bachelor’s degree recipients from for-profit institutions graduated with 30,500 or more in debt, compared to 25% of those from the private nonprofit sector and12% from public institutions. Student loan default patterns also direct attention to the forprofit sector, with 43% of FY2011 defaulters coming from these institutions.10 The forprofit sector is, and should be, a particular focus of concerns over student borrowing.Comparisons of the debt levels of bachelor’s degree recipients with differentdemographic characteristics give some indication of where the problems lie. Independentstudents borrow more than dependent students. Federal loan limits are higher forindependent students, who can now borrow up to 57,500 in Direct Loans forundergraduate study, compared to 31,000 for dependent students whose parents qualifyfor PLUS Loans. Independent students are also more likely to have responsibilities forsupporting families and less likely to have parental support on which to fall back.Among 2007-08 bachelor’s degree recipients, 17% of dependent students and 24% ofindependent students accumulated 30,500 or more in education debt, with singleindependent students and those with dependents more likely to fall into this category thanthose who were married without dependents.Among dependent students, the patterns by family income level are not so clear. Studentsfrom higher-income families were more likely not to borrow at all. But among dependentstudent from all families with incomes below 100,000, 12% to 14% of graduates hadborrowed as much as 30,500.10 U.S Department of Education (www2.ed.gov/offices/OSFAP/defaultmanagement/ cdrschooltype2yr.pdf).
Table 6: Aggregate Debt Levels of Bachelor’s Degree Recipients by Dependency Statusand Dependent Student Family Income, 2007-08All Bachelor's Degree RecipientsDependentLess than 30,000 30,000 to 59,999 60,000 to 99,999 100,000 or moreIndependentNo dependents unmarriedNo dependents, marriedWith dependentsNo Debt34%39%27%25%36%52%27%24%35%28% 20,50050%50%61%61%52%39%49%52%47%47% 30,50017%12%13%14%12%9%24%25%18%25%Note: Loan debt includes total undergraduate student loans (excluding PLUS Loans, credit cards orhome equity loans.Source: Baum & Patricia Steele (2010), Who Borrows Most? Bachelor’s Degree Recipients withHigh Levels of Student Debt, The College Board. Based on NPSAS 2008When graduates are broken down by sector, it becomes clearer that it is not the studentsfrom the lowest-income families, but those from lower-middle income families, with2006 incomes between 30,000 and 60,000, who were most likely to have high debtlevels.Table 7: Table 6: Aggregate Debt Levels of Bachelor’s Degree Recipients byDependency Status and Dependent Student Family Income, and Sector, 2007-08Public Four-YearDependent 30,000 30,000- 59,999 60,000- 99,999 100,000 or moreIndependentPrivate Nonprofit Four-YearDependent 30,000 30,000- 59,999 60,000- 99,999 100,000 or moreIndependentFor-ProfitDependent 30,000 30,000- 59,999 60,000- 99,999 100,000 or moreIndependentNo Debt38% 20,50051% 3%Source: Baum & Steele (2010), Who Borrows Most? Bachelor’s Degree Recipients with HighLevels of Student Debt, The College Board. Based on NPSAS 2008.
Table 8: Aggregate Debt Levels of Bachelor’s Degree Recipients by Dependency Statusand Dependent Student Family Income, and Race/Ethnicity, 2007-08No Debt 20,500 30,500WhiteDependent Students by Parent Income36%48%16%Less than 30,00026%60%14% 30,000 to 59,99924%60%16% 60,000 to 99,99936%51%13% 100,000 or More52%39%9%Independent Students29%48%23%BlackDependent Students by Parent Income19%54%27%Less than 30,00016%66%19% 30,000 to 59,99917%62%21% 60,000 to 99,99924%60%16% 100,000 or More42%47%11%Independent Students16%49%34%HispanicDependent Students by Parent Income33%53%14%Less than 30,00033%59%8% 30,000 to 59,99928%64%7% 60,000 to 99,99934%56%10% 100,000 or More47%43%10%Independent Students30%51%19%AsianDependent Students by Parent Income40%51%9%Less than 30,00037%60%3% 30,000 to 59,99937%57%6% 60,000 to 99,99941%54%5% 100,000 or More61%33%5%Independent Students32%52%16%Source: Baum & Steele (2010), Who Borrows Most? Bachelor’s Degree Recipientswith High Levels of Student Debt, The College Board. Based on NPSAS 2008.It is also notable that within income groups, there are differences in debt levels by racial/ethnic groups. Small sample sizes make it difficult to include breakdowns by sector,race, and income, but black students are disproportionately likely to enroll in the forprofit sector, while Hispanic students are over-represented in community colleges. 11Among 2007-08 black bachelor’s degree recipients, 27% had at least 30,5000 in debt.11Hispanic students constitute 18% of the students at community colleges, but only 13% of all students atdegree-granting institutions. In 2010, almost half of all Hispanic students across the country were enrolledat community colleges. Black students enroll in disproportionate numbers at for-profit institutions. Theshare of black students in total enrollment at for-profit institutions (29%) was nearly twice as high as theshare of black students in total postsecondary enrollment (14%) in 2010 (Sandy Baum and Charlie Kurose(2013), “Community Colleges in Context: Exploring Financing of Two- and Four-Year Institutions,”Bridging the Higher Education Divide, The Century Foundation.
This compares to 16% of white graduates, 14% of Hispanic graduates, and 9% of Asiangraduates. Percentages with high debt were higher for independent students, but highestfor black students in this category as well.Both differences in enrollment patterns and the reality that black families tend to havelower asset levels than other families with similar incomes make it unsurprising than evenwithin income categories, black bachelor’s degree recipients have higher debt levels thanmembers of other racial/ethnic groups.12 With the exception of Hispanics, high debtlevels are most common among lower-middle income students.High debt levels don’t tell the whole story of at-risk borrowers because for students whodon’t earn bachelor’s degrees, leaving school either with associate degrees or certificatesor with no postsecondary credentials, earnings tend to be lower and lower levels of debtcan lead to unmanageable payment requirements. The 85% of 2007-08 bachelor’s degreerecipients who borrowed 30,000 or less are not likely to be at risk, except under unusualcircumstances, and as Table 9 indicates, only 1% of certificate holders and 2% of thosewho left school without a credential accumulated this much debt. But we know that thosewho do not complete
Outstanding student loan debt increased by 70% between 2008 and 2013—only half the rate of growth over the first half of the decade. Perhaps more fundamental is the question of whether the new focus on outstanding student loan debt is the best way to understand the risks facing credit markets, the economy, or past, current and future students.