Transcription
20302027CoffeeBarometer20252024202320222021
Content1Introduction 22Consumption and profitability 52.1 The lockdown 62.2 Consumption patterns 62.3 Roasters and revenues 83Production and marginalisation 113.1The pandemic 123.2Production and trade 123.3Income and value distribution 163.4Social marginalisation 183.5Climate change 194Private Sector self-regulation 214.1Corporate accountability 224.2Voluntary Sustainability Standards 234.3Transparency and accountability 264.4Regulating tropical commodities 285Multi-stakeholder decade of deliverance 325.1Multi-stakeholder collaboration 335.2Private sector participation 356Conclusion 40Endnotes 44Sources 46List of abbreviations 47Bibliography 48Colophon 52
ltureLiving incomeIn fond memory of ourfriend and colleagueJoost Pierrot (1950-2020)Sustainableconsumption‘Let me check the figures’Shared valueTrade transparencySjoerd Panhuysen and Joost Pierrot
21IntroductionAlthough the constraints and potentialsolutions are known, a widely agreedstrategy for achieving sustainable linksbetween coffee production and coffeeconsumption remains elusive.
1IntroductionThe year 2020 has long captivated the coffee sector’s imagination as the culmination of the sustainability transformation process set in motion after the 2002 coffeecrisis. Over the past decades, development of sustainability solutions has been pickingup pace and is rapidly expanding in numbers, scope and global presence. In general, itseems the constraints and potential solutions are known, but a widely agreed strategy for achieving sustainable links between coffee production and coffee consumptionremains elusive. This is due to the sector’s inclination to focus on continuous growthof production to meet global demand. This means that even if some specific gains areachieved at farm level, they are never sufficient to sustainably transform other links inthe value chain, like trade and consumption. This 6th edition of the Coffee Barometerreflects on how the coffee sector could create truly systemic changes that are sustainable and impactful, instead of limiting itself to only managing a confusing set of issues,problems and contradictions.While the Covid-19 pandemic has delivered the biggest and broadest value chain shockin recent history, it is only the latest in a series of disruptions that has exposed thefragility of the global coffee sector. Only a decade ago, the aftershocks of the globaleconomic crisis and the devastating spread of the plant disease roya in Latin Americacreated havoc in coffee communities. Extreme droughts in Brazil’s main coffee areas made headlines in 2016/17. In August 2018, the commodity futures price droppedbelow US 1.00 per pound for the first time in twelve years (SCA, 2020). Alongside lowcoffee prices, production costs for producers have also increased sharply since 2010,further squeezing incomes (Sachs et al., 2019) Consequently, the livelihoods of coffeeproducing households, the majority of which are led by smallholders in low- and middle-income countries, are increasingly at risk (ICO, 2019b).The last decade was the warmest in recorded history, and globally governments andindustry leaders are increasingly under pressure to seriously commit themselves to theParis Agreement as well as the UN Sustainable Development Goals (SDGs). Persistenceof the consequences of climate change is a certainty and remains the defining issue inthe coffee sector. Still, players and stakeholders in the coffee sector are increasinglyaware that we are way off track to meeting even the most basic economic, social andenvironmental goals.3
Against this background, the Coffee Barometer 2020 looks specifically at the role of themain private sector players. The coffee supply chain is closely tied to the top ten multinational roasters that represent over 35 percent of global trade in green coffee andengages millions of smallholders and workers. In the top 10 coffee producing countries,we provide insight in the problems smallholder coffee farmers encounter in respondingto the global market structures. Contributing to the resilience of smallholder coffee4farmers is imperative to create a sustainable coffee sector. To understand the currentstate of voluntary sustainability initiatives from roasters and traders, we take a closerlook at their main successes and failures.More and more multi-stakeholder platforms are actively involved in shaping the dynamics of the sustainability debate and actions. While it is time to assess the achievements of both the Sustainable Coffee Challenge (SCC) and the Global Coffee Platform(GCP), new initiatives are also emerging. It is encouraging to see that these new initiatives challenge the sector’s conventional thinking. They foster establishing a ‘prosperous income’ in coffee producing countries, or they develop alternatives for the C-Pricemechanism, the coffee commodity market which every day determines the global priceof coffee (ICO, 2020b; SCA, 2020). The most radical idea is to create a “Global CoffeeFund” in the range of USD 10 billion per year (Sachs et al., 2019).The Coffee Barometer is not an academic exercise but rather a result from the sense ofurgency to shed light on the dynamics of the change process in the coffee sector andthe main sustainability trends in recent years. More in-depth sustainability discussionsmight help us towards countering the negative trends and focus on actions with muchpositive impact at all levels in the coffee sector.Industry must take the first step,however; they cannot expect others tostep in to save an industry that is notinterested in saving itself.(Sachs, 2019)
2Consumption and profitabilityThe asymmetries in power andinformation among participants in theglobal coffee market result in somestakeholders benefitting more thanothers; especially the coffee roastersappear as the big winners.5
2Consumption and profitability2.1The lockdownAs an immediate effect of the Covid-19 pandemic, net imports of coffee in the EuropeanUnion (EU), United States (US) and Japan declined in 2020 compared to 2019. While theout-of-home market is confronted with huge revenue losses, players in the at-homemarket encounter significant value growth. Closure of horeca and many people working6from home, boosted coffee sales in traditional retail and e-commerce. With consumersstocking up on coffee, sales of coffee pods and retail packaged coffee soared worldwide. This resulted in mixed results for roasters, with those supplying retailers or sellingdirectly online performing much better than others who traditionally are more reliant onthe hospitality industry (Butler, 2020). With the global economy sliding into recession,the big concern is that the increased at-home consumption will not be sufficient tocompensate for lost sales of the higher value out-of-home coffee products.2.2Consumption patternsEurope is the world’s largest coffee consumption market region, followed by respectively Asia and Oceania, Latin America and North America. The International Coffee Organisation (ICO) reported in November 2020, that global consumption for the coffee year2019/20 amounted to 167.6 million 60-kg bags of green coffee (ICO, 2020d). Respectively, Europe imported 55 million bags and North America 31 million bags in 2019/20(ICO, 2020d). In these mature markets, it is not the volume, but the demand for higherquality coffee that will drive the future value of coffee retail sales. Other markets arerapidly developing, which is good for the future of coffee: a diversified consumptionbase benefits market resilience (see Box 1).Coffee consumption and the prices that consumers are willing to pay, relate to the consumption occasion at home or out-of-home. Although figures vary by country, cultureand source, it can be assumed that between 65-80% of the world’s coffee consumption takes place at home (Samper et al., 2017). The at-home consumption includes lowvalue roasted brands, high quality packaged coffees, instant coffees and single servepresentations (pods or capsules), as well as Ready to Drinks (RTDs). These coffee offerings are sold at very competitive prices at supermarkets, coffee shops and online, andhave a key influence in the global coffee value chain.Away-from-home consumption may take place through coffee shops at higher pricepoints. The coffee shop segment is a high-visibility channel, although it only accountsfor a limited portion of overall volume. In this segment quality, differentiation and consumer experience play a very significant role. The away-from-home locations accounting for the most substantial volumes are described as the foodservice channel, whichincludes Office Coffee Service (OCS), Hotels, Restaurants and Cafeterias (Horeca),Quick Service Restaurants (QSR) and other outlets selling or providing coffee in largevolumes such as airlines or hospitals (Samper et al., 2017).
BOX 1.The four major types of coffee markets (Barry, 2019):1. Premiumisation-led markets: crucial in countries where population growth isslow and coffee markets are mature, like in Western Europe, North America andJapan. Volume growth is slow in these mature markets and there is an emphasis onconsumers switching from standard ground and instant coffee to pods and RTDs. Inthis market, demand for quality is high. Nearly half of all value growth globally between 2018 and 2023 will take place in these countries as consumers trade up tomore expensive formats (eg. France, United States). The possibility of an economicdownturn poses a threat to the growth potential. A good example is the ongoinguncertainty regarding the Brexit and United Kingdom’s future relationship with theEuropean Union, which frustrates the planning and investment in the UK’s coffeeshop market.2. Income-led markets: these are countries where consumers are drinking morecoffee as their incomes rise, and where coffee shops play an important role as asymbol of entry into the global middle class. Asia and Eastern Europe have becomethe focus of future growth for coffee shops: China alone will see more outlets addedby 2023 than every non-Asian region combined, both value and volume sales aredoing well here. This future coffee shop growth will be reliant on an expanding baseof consumers with increasing disposable income. On the other hand, one should consider that such markets are vulnerable to sudden macroeconomic shifts (eg. China,Russia).3. Population-led markets: In these countries growth comes from a rising numberof coffee drinkers. This benefits conventional formats as these markets offer limited opportunity to switch to coffee consumption. Consumers may want to trade upbut are often restricted by their incomes from doing so, which means that basic andaffordable formats like standard ground or instant are the key to the overall market(eg. Ethiopia, Mexico).4. Soft driver-led markets: This market type is the least geographically consolidated compared to the previous three. Identified as countries where the coffee cultureis changing, thereby pushing the demand for coffee higher than would otherwise beexpected, soft-driver-led markets are scattered around the globe. Coffee is reachingmore consumers in these countries than before, because of coffee shop expansion,new product launches and promotional campaigns (eg. Turkey, United Arab Emirates).(After: Barry, 2019).7
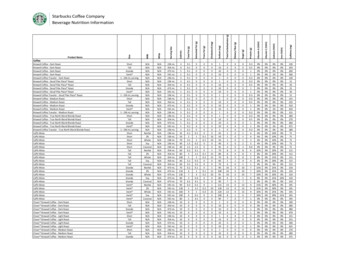
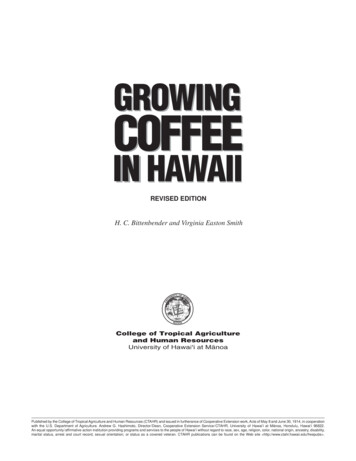
2.3Roasters and revenuesA few very large roasters dominate the coffee market, all of which bar one have theirheadquarters in Europe or the United States. Mergers and acquisitions in the industry– as addressed in the 2018 Coffee Barometer – continue to drive consolidation in themarket and increase market shares and value of these companies. This consolidationis also reflected by the fact that 86% of the total European Unions’ imports is roasted8in only six countries: Germany and Italy have the largest roasting industry, followed bySpain, the Netherlands, France and Sweden. In general, these roasters have investedheavily in diversifying their portfolio of brands and cover the whole spectrum of traditional roast and ground products, as well as a wide range of single-serve options, nextto espresso beans or low profile instant coffee (Panhuysen and Pierrot, 2018). They areactive at a global scale, and with their large portfolio of brands they are present in allmajor coffee markets (see Box 2). Together, the companies in figure 1 are responsiblefor roasting 35% of the world’s coffee, which generated an estimated US 55 billion intotal revenue in 2019. Some of these roasters have higher value shares compared totheir volume shares, which illustrates their dominant presence in higher value coffeesegments, like single-serve capsules or the out-of-home market. Roasters with theopposite share equation usually have a product and brand portfolio competing at competitive prices levels, found in the roast and ground coffees segment.Box 2:Roasters’ market developmentsNestlé Nestlé’s coffee-focused strategy appears to be stimulating growth in itsbeverages category. The brands of Nespresso, Nescafé, Starbucks and Coffee-matecreamers count as key contributors to its sales increases and result in a global revenue of CHF 19 billion (Nestlé, 2019; 2020). In the first quarter of 2019, Nestlé successfully launched a new range of 24 premium coffee products under the Starbucksbrand, with mainly branded products in supermarkets and for its single-serve brewercapsules. E-commerce is also playing a more significant role for coffee shops andretail packaged coffee companies. While Nestlé’s out-of-home businesses, includingits Nespresso boutique stores, have suffered a decline in 2020, its e-commerce salesgrew by almost 50% in the second quarter of 2020, reaching 1/8 of total group sales(WCP, 2020b). With many consumers viewing coffee pods as an economical way toreplace takeout coffee, Nespresso and JDE Peet’s are investing in coffee pods andcapsule production facilities in Switzerland and France to match the demand (WCP2020c; 2020d).JDE Peet’s End 2019, German-owned JAB Holdings announced to combine JacobsDouwe Egberts JDE and Peet’s Coffee to explore an Initial Public Offering (IPO) (JDE,2019). Being the only big European IPO launched during the pandemic it raised stronginvestors’ interest. The newly named company JDE Peet’s raised Euro 2.25 billion
at its launch on the Euronext stock exchange in Amsterdam. Based on the revenuefigures of 2019, JDE Peet’s is expected to have a combined revenue of approximatelyEuro 7.8 billion a year. JDE Peet’s brand portfolio will offer consumers a broad rangeof choices that include traditional roast and ground coffees, soluble coffee, on-demand systems such as Senseo and Tassimo, and products compatible with otherpopular coffee systems. JAB Holding’s other crown jewel is Keurig Dr Pepper (KDP),with KDP-manufactured single serve coffee pods currently representing 81% of UScoffee pod sales. The company entered into a licensing agreement with McDonald’sto manufacture and distribute McCafé-branded coffee pods. In February 2020 itsigned a long-term partnership with Nestlé USA to manufacture and distribute Starbucks-branded K-Cup pods (FBN, 2020).Lavazza In mid-2019, Lavazza entered into a partnership with Pepsico to launch apremium RTD coffee in the UK in mid-2019. As a result of its acquisition of two prominent self-serve and vending coffee businesses (Australian coffee pod firm Blue Podand Mars Drinks’ coffee vending machine business) Lavazza is seeking to consolidateits reach across international retail markets as part of a growth strategy. The company announced strong annual results with a rise in revenues to 2.2 billion in 2019.Recently, Lavazza announced a partnership with Yum China, with the intention toinitiate a Lavazza’s retail coffee shop model in China (WCP, 2020b).Starbucks Starbucks is the leader in retail coffee, selling its products through morethan 32,000 stores in 83 markets around the world. In 2019, their beverages productcategory generated U 16.5 billion. Currently, the company is reporting significantquarterly revenue losses after years of strong growth. The US and China are crucial markets for the Seattle-based firm, containing 61% of its global store portfolio(Forbes, 2020). While Starbucks dominates the US market, it increasingly facestough competition in international markets, including from Dunkin’, McCafé and CostaCoffee, a subsidiary of The Coca-Cola Company and China-based Luckin Coffee.1 Dueto the effects of the pandemic, the rise of international chains such as Starbucks andCosta’s, might set to go into reverse in China, South-East Asia and Eastern Europe.Recently, Starbucks announced it will be closing up to 400 stores in the US and up to200 stores in Canada as part of its restructuring plans (WCR, 2020a)JDE Peet’s Offer Price has beenset at 31.50, implying a marketcapitalisation of 15.6 billion.(Euronext, 2020)9
Figure 1:Top 10 roasters’ volumes and revenues, 2019907 16 10730 8.7360 2310 282 1267 2.5195 0.7190 3180 2.2153 1.3x 1000mt x 1 US billionUS conversion rate 31.12.2019 19.5
3Production and marginalisationThe coffee sector’s extractive model ofproduction -relying on rural poverty,devalorised work and the depletion ofnatural resources- denies that a price hasto be paid for labour and land use at origin.11
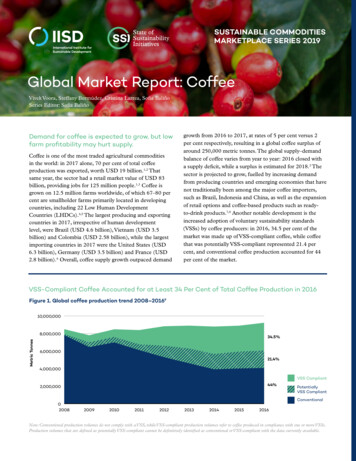
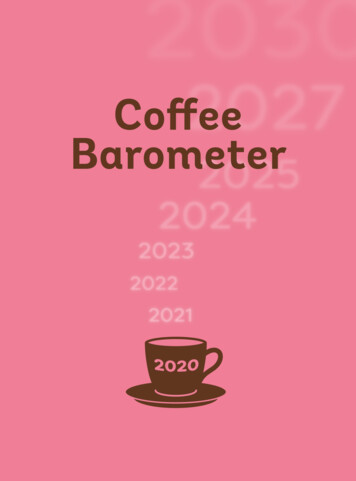
3Production and marginalisation3.1The pandemicWhile the effect of the Covid-19 pandemic on coffee production is yet to be determined,it is fair to say it has increased volatility in the coffee market. Supply has been affectedby disruptions of logistics systems and international trade, as well as by labour shortages due to local lockdowns and other safety measures (ICO, 2020a). Coffee farming12families have lost income primarily due to disruptions of their non-farm businessesand employment, coupled with difficulty in selling food crops. In countries like Braziland Colombia, workers in the coffee sector have been defined as essential workers whomust continue to work during the Covid-19 pandemic (Verité, 2020). In other countries,the pandemic has reversed the tide of migration to rural communities as millions ofpeople (urban and migrant workers) have decided to return to their areas of origin. In theabsence of tracking, testing, and implementing quarantine regulations, this also meansthat it is likely to be a major contributor to the spread of the coronavirus, as has alreadybeen observed in India. In addition, field visits by extension services have been cancelledin many countries, thus reducing the farmers’ access to technical assistance in a timeof great need (Guido, 2020).3.2Production and tradeCoffee is produced on approximately 12.5 million coffee farms (Enveritas, 2018). Thestructure and size of the farms varies by production country. Almost 95% of these aresmaller than 5 hectares, and 84% of all coffee farms are smaller than 2 hectares.2 It isestimated that smallholder farms produce up to 73% of all coffee, the remaining 27% isproduced by large coffee estates. Estates bigger than 50 hectares are only a commonfeature in Central and South America (Enveritas, 2018). Figure 3 emphasizes the significant differences in the scale and context in which coffee is produced around the worldand is a strong reminder about the need for pre-competitive collaboration to addressthe economic viability of coffee farming.Amongst all coffee producing countries, Brazil is the largest origin for both Arabica andRobusta varieties. The leading Robusta producer is Vietnam. In 2019 these two countries accounted for almost half of the global coffee production. World coffee productionin 2019/20 is projected at almost 169 million bags with a decline in Arabica output to96 million bags, while Robusta production is expected to rise to 73 million bags (ICO,2020e). Despite the pandemic, there are no serious coffee supply shortages reported inthe 2020 statistics. On the contrary: the projection shows a global surplus of 1 millionbags by the end of the year (ICO, 2020e).3 There is a widening gap between highly efficient producing countries like Brazil and Vietnam, which produce on average 1.5-2 metric tons of coffee per hectare, and nearly every other region in the world (WCR, 2020).Just three countries are responsible for another quarter of the global coffee output:Colombia, Indonesia and Honduras. This tendency – concentration of production – willmake future access to volume, quality and diversity of coffee increasingly vulnerable,
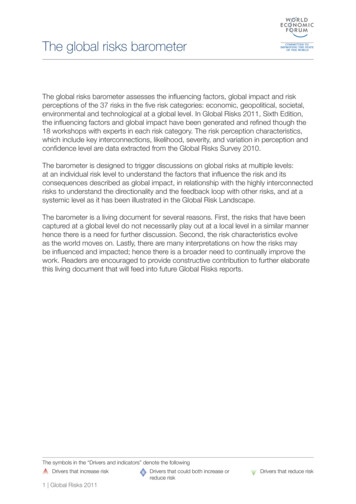
given the risk of climatic and geopolitical events.4 Figure 3 gives an overview of the top10 origin countries, and include key Arabica producers like Ethiopia and Peru, as well asimportant Robusta producers India and Uganda.Most coffees from individual small farmers are blended and homogenised beforeshipping, to comply with the quality definitions and standards set by clients in Europe or the US. A large proportion covers the demand for commercial coffee, which isaverage-quality coffee either for roasted or ground products and instant coffee. Largecoffee plantations and cooperatives are active as coffee exporters, but internationalexport-import firms dominate the trade. These international trade houses buy coffeedirectly from farmers, cooperatives or local traders.Only five companies handle a total of 62.5 million bags, an equivalent of half of the totalgreen coffee export production in 2019. In the last decade, Switzerland has emerged asa leading hub in the global trade of coffee, probably because of a combination of favourable tax and trade regulations (Public Eye, 2019).5 Most of the trade houses have theirhead office -or at least its trade administration office- in this landlocked country. Theytypically buy future coffee contracts from suppliers abroad and resell them to clientswho are also abroad, meaning the coffee never touches Swiss soil. Like this, the members of the Swiss Coffee Trade Association (SCTA) handle a volume of more than 50% ofglobal coffee exports (SCTA, 2020).Figure 2.Top 5 coffee tradersNeumannKaffee Gruppe13
Country overview – production, hectares, farmers 85%PercentageFOB priceExportvolume20191700 kHaArabica40.7 mExport volume growth2010/11 — 18/19 9.9 m 410 kHaRobusta35% 18/1936% 10/11Farms Brazil14 5.1 bn281.10014.000Export value 2019smallholdersFigure 3:of worldproductionExport value 2019 2.6 bn 88%PercentageFOB priceExport volume 2019 Exportvolume2019 310kHa2.1 m Arabica930 kHaRobustasmallholders 6.3 mIndonesia 1.2 bn7%7%18/1910/11of worldproduction 660 m Exportvolume2019 2%3%18/1910/11of worldproductionExport value 2019Export volume growth2010/11 — 18/191.342.500ArabicaExport value 20199%6%smallholders940 kHaExport value 2019Export volume growth2010/11 — 18/19 - 0.2 m 18/1910/11of worldproduction 950 m 75% PercentageFOB priceExport volume 2019342kHaArabica4%3%Export volume growth2010/11 — 18/19 1.9 m 120.400 4.000 Farms175.100 smallholders smallholders 3.6 kHaArabicaGuatemala 3056.8 m Honduras Export volume growth2010/11 — 18/19 5.6 m 554.500 13.7 mColombia 18/1910/11of worldproduction
2.200.000Export value 2019 2.7 bn95% PercentageFOB pricePercentageFOB price385kHaArabica a234Export volume growth2010/11 — 18/190.2 msmallholders18/1910/11of worldproductionExport value 2019 in U DExport volume 2019 in 60kg bags x million70%FOB price in percentage paid to farmerArabica & Robusta coffee lands in kilohectaresExport volume growth in 60kg bags x millionSmallholders/1910/114%4%18/1910/11of worldproduction 500 mUganda Arabica5%6%18Export volume growth2010/11 — 18/19 1.0 m 525 kHaExport value 2019185.100 6.0 mIndia Exportvolume2019PercentageFOB priceof worldproduction 820 m Export value 2019 3.9 mExport volume growth2010/11 — 18/192%3% 77%PercentageFOB t volume growth2010/11 — 18/19Exportvolume2019 2.1 m 70%smallholders 4.5 m 85%202.100 smallholders 3.7 mPeru 740 m1.800.000Export value 2019 620 mof worldproduction- 0.08 mArabica19% 18/1915% 10/11Export value 2019Ethiopia90Robusta15Export volume growth2010/11 — 18/19600 kHasmallholders27.4 mVietnamExportvolume2019600.50011.3 m 18/1910/11of worldproduction
3.3Income and value distributionIn the vast majority of producing countries, coffee is primarily seen as an export cashcrop. Around 75% of the global coffee production is exported to international markets.This generated a total value of US 20 billion on average in the period 2015-2020(Samper et al., 2017). Figure 3 illustrates the exact export value per country in 2019.Almost all coffee is exported as green unprocessed coffee beans. Roasters and retailers16in importing countries capture the largest share of the value addition (see figure 1). It isestimated that currently the average green coffee export value accounts for less than10% of the US 200 to US 250 billion of revenues generated in the coffee retail market(Samper et al., 2017; Sachs et al. 2019).For the most part of 2020, coffee prices have remained up to 30% below the averageprice level in the past ten years (ICO, 2020b). Figure 4 illustrates the average of theICO composite indicator price in the last decade, in relation to the global productionand consumption of coffee (also see Box 3). Actually, this is the third year in a row thatcoffee farmers are experiencing a commodity price of coffee negatively impacting theprofitability of all producers (ICO, 2019b). At these low prices coffee production is noteconomically viable for the majority of coffee farmers. Multiple factors can influence afarms’ profitability, including farm size, exchange rates, labour costs, market access,coffee plant diseases, fertiliser costs, or lack of access to capital and insurance (Sachset al., 2019). Yet the impact is felt differently in the high-productivity countries wherethe more productive farms remain profitable, compared to most of the other countriesIf coffee were a product of thedeveloped world there would havebeen some price stabilisationmechanism put in place or, at thevery least, there would have beensubsidies at low prices. (OLAM, 2019)
where producers are operating at a loss. This threatens famous quality origins in countries like Kenya, El Salvador and Mexico (WCR, 2020). Recent research in 13 countriesindicates that coffee producers’ average annual income decreased significantly overthe last 2 years (ICO, 2019b). As a result, the proportion of producers living below theextreme poverty line of US 1.90 per day has increased dramatically by as much as 44%in Cameroon and 50% in Nicaragua. In 2019, with an average price of US 1.80 per kg ofgreen coffee, a Colombian producer with 4.3 hectares coffee land could only reach a living income with a production of 1.46 metric tons per hectare (Solidaridad, 2020). Evenunder a very optimistic scenario with a simultaneous increase in yield and farmgateprices, a producer with a small plot of land would not reach an income level above thepoverty line (TFCLI, 2020). The development of economically viable coffee production isvital to many countries’ efforts to combat extreme poverty (CABI, 2019).6 Although Africa accounts for about 10 percent of global coffee production, these figures understatethe importance of coffee production in terms of its contribution to a country’ GDP, ruralemployment, tax incomes and export earnings. For instance, in Ethiopia and Burundicoffee is the largest single exported product by percentage in 2019.7BOX 3 Priceof coffee: farmgate, FOB, futures, ICO indicatorFarmgate price: A farmers’ revenue depends on the quantities sold and the farmgate prices(volume x price income). Farmgate price varies by variety, quality, and market destination.Due to many reasons — low volumes, poor market information, lack of infrastructure —producers are predominantly price takers. The farmers’ revenue also depends on operatingcosts, which often outpace inflation and the exchange rate of the local currency versus theUS dollar.Free on Board price (FOB): Exporters sell green coffee on FOB prices to importers, supplyingqualities graded according to business specifications.Futures price: The coffee futures markets in New York (for Arabica coffees) and London (forRobusta coffees) project the future prices for standardised coffee qualities. This is a classicmethod for pricing commodities and reflect the estimated availability and demand of coffeeof the Arabica or the Robusta type.ICO indicator price: For research purposes and to get a better overview of the worldwide pricedevelopment for coffee, the ICO indicator prices represent and track prices of four main typesof coffee qualities: Colombian mild Arabicas, other mild Arabicas, Brazilian and other naturalArabicas, Robustas. Arabica coffees are generally perceived as a better quality product compared to Robusta coffees. This is also expressed in the Arabica price level leading to comparatively higher value of exports with Robusta coffees.17
3.4Social marginalisationCoffee production is highly labour-intensive because most work is manual. Smallholderfarms employ farmers and their family members, as well as hired workers. Larger plantations employ many (seasonal) workers. It is difficult to pinpoint the total number offarm workers due to the rural and seasonal nature of the work and the widespread informality of employment.8 The allocation of tasks can vary by gender. A substantial partof weeding, harvesting and processing is often performed by women, while men are18more involved in pruning, application of pesticides and logistics. Coffee production andharvesting has several specific health risks, like injuries from sharp tools, injuries fromrepetitive movements, lifting heavy loads
mechanism, the coffee commodity market which every day determines the global price of coffee (ICO, 2020b; SCA, 2020). The most radical idea is to create a “Global Coffee Fund” in the range of USD 10 billion per year (Sachs et al., 2019). The Coffee Barometer is not a