Transcription
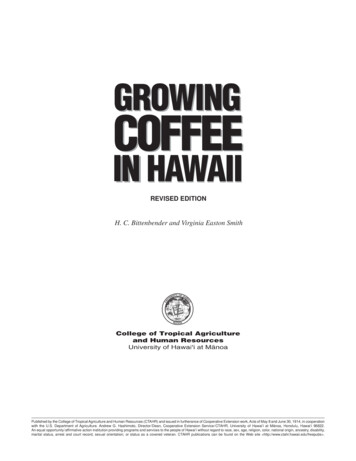
SUSTAINABLE COMMODITIESMARKETPLACE SERIES 2019Global Market Report: CoffeeVivek Voora, Steffany Bermúdez, Cristina Larrea, Sofia BaliñoSeries Editor: Sofia BaliñoDemand for coffee is expected to grow, but lowfarm profitability may hurt supply.Coffee is one of the most traded agricultural commoditiesin the world: in 2017 alone, 70 per cent of total coffeeproduction was exported, worth USD 19 billion.1,2 Thatsame year, the sector had a retail market value of USD 83billion, providing jobs for 125 million people.1,3 Coffee isgrown on 12.5 million farms worldwide, of which 67–80 percent are smallholder farms primarily located in developingcountries, including 22 Low Human DevelopmentCountries (LHDCs).4,5 The largest producing and exportingcountries in 2017, irrespective of human developmentlevel, were Brazil (USD 4.6 billion), Vietnam (USD 3.5billion) and Colombia (USD 2.58 billion), while the largestimporting countries in 2017 were the United States (USD6.3 billion), Germany (USD 3.5 billion) and France (USD2.8 billion).6 Overall, coffee supply growth outpaced demandgrowth from 2016 to 2017, at rates of 5 per cent versus 2per cent respectively, resulting in a global coffee surplus ofaround 250,000 metric tonnes. The global supply–demandbalance of coffee varies from year to year: 2016 closed witha supply deficit, while a surplus is estimated for 2018.2 Thesector is projected to grow, fuelled by increasing demandfrom producing countries and emerging economies that havenot traditionally been among the major coffee importers,such as Brazil, Indonesia and China, as well as the expansionof retail options and coffee-based products such as readyto-drink products.7,8 Another notable development is theincreased adoption of voluntary sustainability standards(VSSs) by coffee producers: in 2016, 34.5 per cent of themarket was made up of VSS-compliant coffee, while coffeethat was potentially VSS-compliant represented 21.4 percent, and conventional coffee production accounted for 44per cent of the market.VSS-Compliant Coffee Accounted for at Least 34 Per Cent of Total Coffee Production in 2016Figure 1. Global coffee production trend 2008–2016910,000,000Metric Tonnes8,000,00034.5%6,000,00021.4%4,000,000VSS Compliant44%2,000,00002008PotentiallyVSS 016Note: Conventional production volumes do not comply with a VSS, while VSS-compliant production volumes refer to coffee produced in compliance with one or more VSSs.Production volumes that are defined as potentially VSS-compliant cannot be definitively identified as conventional or VSS-compliant with the data currently available.
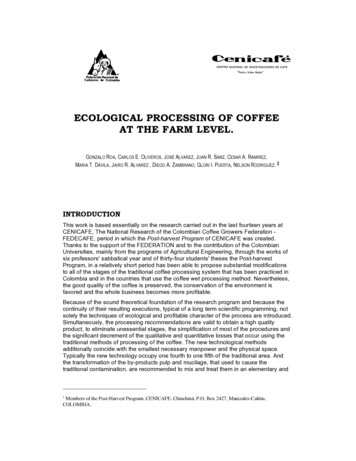
The market advisory firm Mordor Intelligence predictsthat the global market (retail) value of the coffee sectorwill experience a 5.5 per cent compound annual growthrate (CAGR) from 2018 to 2023, yet this positive outlookmust be viewed against the coffee sector’s history of pricevolatility across multiple decades and long-term pricedecline.7 Traditionally, farm gate prices have struggledto keep pace with production costs, which hurts farmprofitability and makes it difficult for coffee farmers to makelong-term decisions on investments and planting, ultimatelydisincentivizing many of them from staying in the sector.4,7Increasing the volume of coffee production, regardless ofwhether this coffee is VSS-compliant, to meet the projectedgrowth in demand from non-traditional coffee importers isfurther challenged by the effects of a changing climate, asland suitable for coffee cultivation will be subject to moreunpredictable weather patterns, with negative implicationsfor coffee yields. These climate change risks are not limitedjust to extreme weather events: there are already cases wherecoffee-producing countries have faced severe pest anddisease outbreaks, such as coffee rust, that have decimatedtheir crops and further exacerbated the volatility of theglobal coffee market.4How Much Coffee is Certified by EachStandard?Consumption of more sustainable coffeesupports the growth of VSS-compliantproduction, which can help addressenvironmental and social developmentchallenges.Figure 2. Standard-compliant coffee productionvolumes in 201694C2,764,002 MTUTZ Certified870,102 MTFairtrade International560,902 MTRainforest Alliance508,632 MTOrganic431,912 MTLIVELIHOODSOver 125 million jobs in the coffee sector12.5 million growing farms67%-80% smallholder farmsVSSs emerged in the coffee sector over 30 years ago, withnon-governmental organizations, private sector actors andother industry stakeholders looking to provide roasters,retailers and consumers with the ability to distinguish betweenconventionally produced coffee and its more sustainablecoffee equivalent. The latter options would be produced in away that was conscious of emissions, biodiversity conservation,and worker health and safety considerations throughout thevalue chain, while also aiming to provide larger economicgains for producers. Being able to associate a particular coffeebrand with a socially and environmentally sound reputationthrough certification was meant to stimulate demand fromcoffee sourcing companies and end consumers for this typeof product. This would in turn drive greater investment intomore sustainable production practices, and the correspondingtraining and support that farmers would need to change theirproduction techniques and approaches, thus boosting thesupply of VSS-compliant coffee.To date, there are some promising signs of VSSs’ success onthe supply side, particularly in recent years: VSS-compliantcoffee experienced a CAGR of about 24 per cent from2008 to 2016, accounting for at least 34 per cent of coffeeproduction overall. 4C, UTZ Certified, Rainforest Alliance,Fairtrade and Organic are the main VSSs in the coffee sector,when ranked by production size. In 2016, at least 3 millionmetric tonnes were VSS-compliant, with coffee valued at USD7.2 billion. This value is derived from the average producerprices per country, as reported by the Food and AgricultureOrganization of the United Nations (FAO), which is thenapplied to the volume of VSS-compliant coffee produced percountry.9,10 The majority of VSS-compliant production, atapproximately 70 per cent, comes from Latin America (Brazil,Colombia and Peru) with some important volumes comingfrom Asia (Vietnam and Indonesia) and Africa (Ethiopia,Tanzania and Uganda).9,11
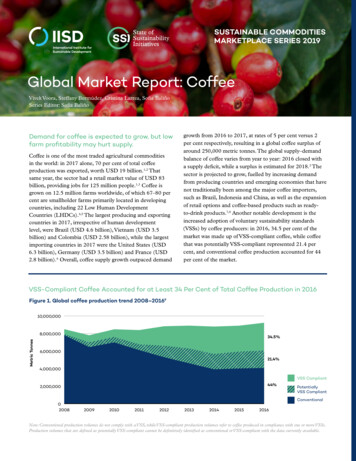
On the demand side, the results have been mixed. The 10largest coffee roasting companies purchased 3.31 millionmetric tonnes of coffee in 2016, accounting for 35 per centof total global coffee sourcing. From this total, 1.14 millionmetric tonnes were VSS- and corporate-initiative-compliantcoffee, which refers to sustainable coffee production programsestablished by private companies rather than by independentthird parties.4 Examples of corporate sustainability initiativesin the coffee sector include Starbucks’ CAFÉ Practices andNestle’s Nespresso AAA programs.Based on the sourcing commitments of the 10 largest coffeeroasting companies, and assessing these against current coffeesourcing information, an additional 0.3 million metric tonnesof sustainable coffee could be sourced by 2025. The leadingbuyers’ sourcing commitments are driven mainly by final endconsumer preferences to purchase more sustainable and healthyproducts.12 Even though demand for VSS-compliant coffeecontinues to grow, because this demand is concentrated mainlyin traditional markets such as Europe and the United States, itremains lower than supply.13 This supply–demand imbalancecan limit VSS-compliant coffee’s market growth potential andneeds to be addressed by value chain actors to benefit from theopportunities that stem from growing coffee demand from nontraditional coffee importers. This includes higher demand fromproducing countries and emerging economies, especially thosein Asia and Oceania.2,7,8Expanding production of sustainable coffeemay require moving into less-developedgrowing regions.VSS-compliant coffee and sustainable corporate initiativesare propelling the sector toward potentially becoming one ofthe first commodities to reach significantly high compliancewith a sustainability initiative. This potential, however,must be assessed against the above-mentioned risks, suchas price volatility and price decline, oversupply of VSScompliant coffee and the effects of climate change on coffeeGood Progress Toward Sourcing More Sustainable CoffeeFigure 3. Major coffee roasting companies and their sustainable sourcing commitments4,14–1870% sustainable sourcing by 2020Nestlé870,000* Jacobs Douwe EgbertsIn 2016, Nestle's total coffee consumptionwas 870,000 metric tonnes, of which 55%was sustainably sourced. They are close toreaching their goal of 70% by 2020.710,00010% sustainable sourcing by 2018SmuckersCommitment to 70%sustainable sourcing by 2020350,000100% sustainable sourcing by 2020Starbucks55% SustainableConsumption in 2016290,00045% ConventionalConsumption in 2016870,000 MT* Strauss285,000* Lavazza200,000* Ueshima Coffee Co.Sustainable Consumption(MT, 2016)Conventional Consumption(MT, 2016)190,000Sustainable SourcingCommitment (% and year)100% sustainable sourcing by 2025Tchibo180,000* Massimo Zanetti145,000100% sustainable sourcing by 2020Keurig Green Mountain* data not found for sustainablesourcing ,0000Metric Tonnes
yields. Although the production of sustainable coffee isexperiencing a greater growth trend than the overall sector,its continued expansion may now require moving intonew markets and working with farmers that have fewerresources and less capacity than those that are already VSScompliant. This strategy will require greater investmentsand innovative approaches to support farmers as theytransition toward more sustainable production practices.11Another core consideration in assessing opportunities forexpanding VSS compliance in the sector is the humandevelopment level of coffee-producing countries, asassessed by the Human Development Index (HDI).Out of 82 coffee-growing countries in 2016, 22 wereranked as LHDCs under the HDI, and 11 of theseLHDCs produced VSS-compliant coffee. These LHDCsaccounted for 12 per cent of the total coffee grown in2016 and were responsible for 8–9 per cent of the totalVSS-compliant coffee produced worldwide that same year.According to our analysis, there have been promisingsigns of growth in VSS-compliant production amongthese LHDCs: looking at the 2008–2016 time period,VSS-compliant coffee production in LHDCs increasedat a CAGR of approximately 19 per cent with Organicas the VSS with the largest volume of coffee productioncoming from LHDCs followed by 4C and RainforestAlliance in 2016.9 The expansion of VSS-compliant coffeeproduction in LHDCs could result in important environmentaland societal development benefits via the adoption of moresustainable agricultural practices, such as lower emissions fromproduction and the improvement of working conditions.Going forward, there are promising signs of VSS expansionpotential among countries that are already producingsignificant shares of the world’s coffee and have begun toadopt VSSs, including some countries that are LHDCs.MARKET VALUEOver 7.12 Billion USD VSS-compliant coffeebased on 2016 coffee producer pricesCAGR 2008-2016Conventional production is down by 8%while VSS production is up by 24%VSS production in LHDCs is up by 19%COFFEE PRODUCTION IN LHDCs12% of total coffee produced8-9% of VSS compliant coffee producedbased on 2016 dataOf the top coffee-growing countries, Brazil, Vietnam,Indonesia, Ethiopia and Colombia offer good prospects forincreased sustainable coffee production, considering theirtotal coffee output and existing presence of VSSs. Notably,only one of those five top coffee-growing countries,specifically Ethiopia, is an LHDC: the overall contributionof LHDCs to global coffee production is still relativelysmall compared to the largest coffee producers. In termsof the opportunities for expanding VSS-compliant coffeeproduction in LHDCs and the potential for maximizingsustainable development outcomes, the countries thatshow the most potential for growth in light of their shareof total coffee production, the presence of VSSs and theirHDI value are Ethiopia and Uganda, followed by Côted’Ivoire, Madagascar and Papua New Guinea, according toour analysis based on 2016 figures.9 Positive developmentThe Sustainable Commodities Marketplace Series provides a market performance overview and outlook for keyagricultural commodities that comply with voluntary sustainability standards (VSSs), focusing on global sustainableconsumption and production. Each year, the series focuses on a different overarching theme, with individual reports forthat year devoted to providing a market update for a chosen commodity. These reports are designed to be accessibleand relevant for a range of audiences, including supply chain decision makers, procurement officers, policy-makersand producers. The series builds on The State of Sustainable Markets: 2018: Statistics and Emerging Trends, a jointpublication from IISD, the International Trade Center (ITC), and the Research Institute of Organic Agriculture (FiBL),which examines over a dozen sustainability standards for various different commodities.This Global Market Report analyzes recent trends in coffee production, consumption, trade flows and other relevant areas.The report also emphasizes the potential for expanding VSS-compliant production in Low Human Development Countries(LHDC), given factors such as share of global coffee production, VSS presence and Human Development Index (HDI) value.It uses 2016 data across all three factors, given that this is the latest year with data available for VSS-compliant coffee.By comparing the growth rates and patterns of standard-compliant versus conventional consumption and production ofcoffee, this report provides insights on how sustainable and conventional markets are performing at a global level, andhighlights which countries have the potential to produce more VSS-compliant coffee.The State of Sustainability Initiatives (SSI) is an international transparency and capacity-building project that aims toimprove strategic planning and sustainable development outcomes related to VSSs. It does so by providing in-depth,credible and needs-based information on VSS characteristics, market performance and potential contributions toaddressing development challenges.
Coffee-Growing Regions of the WorldSignificant Producer HDIVietnamChinaLaosIndonesiaIndiaUganda EthiopiaCôte sNicaraguaFigure 4. Distribution of coffee production in the top fifteen producing countries in 2016HighHarvest AreaPotentially VSS CompliantMediumVery HighPrevalent VSS-Compliant AreaVSS ComplianttonnesConventional ProductionLow1,000,000500,0000Sources: see endnotes 9, 25, 26Download high resolution version of map at bit.ly/ssi-coffeeoutcomes through the expansion of VSSs can also takeplace in the largest coffee-producing countries, such asBrazil, Vietnam and Colombia. While these are not LHDCs,their smallholder coffee farmers continue to experiencepoverty, and pursuing greater VSS compliance mightcontribute to improving their livelihoods.19–21Moving the coffee sector toward more sustainable formsof consumption and production will require additionalresources and investments, given that the least demandingopportunities to do so have, for the most part, alreadybeen pursued. In addition, there is also a clear needfor coordination among value chain actors, includingbuyers, standards bodies and roasters, to addresspersistent challenges in moving the coffee sector towardmore sustainable production methods and consumption,including by capitalizing on the opportunities providedby VSSs. For example, these value chain actors can worktogether to stimulate greater demand for VSS-compliantcoffee in importing and producing countries, improvefarm profitability and strengthen the resilience of coffeeproduction practices to climate change.This coordination among value chain actors is even moreimportant given some of the risks that the sector facesin terms of price volatility and the negative impacts ofclimate change, which lie largely outside their control.The emergence of several important initiatives such asthe Sustainable Coffee Challenge, Sustainable FoodAgriculture Environment Platform and the GlobalCoffee Platform, born out of the 4C standard, suggeststhat coffee sector stakeholders are already moving in acoordinated fashion toward a more sustainable future forcoffee producers and consumers.22–24Of the leading producer countries, Brazil andVietnam dominated coffee exports in 2016. Topimporters were primarily European countries,followed by North American countries.Figure 5. Trade flows of the largest producercountries in 2016, in metric tonnes. Coffee notroasted, not 03[14.95%]Africa &Middle east254,202 m1,637,781[34.22%]North America1,154,302[24.50%]South America78,765 [1.67%]South Asia251,563 [5.34%]Note: These five countries represent the 68% of total coffee production in2016. The % in brackets for each country represents the proportion of the totalvolume of coffee exported in 2016 by the five countries. The % in brackets foreach region represents the proportion of the total volume of coffee imported in2016 from the five countries.Sources: see endnotes 27, 28
1.Salado, A. (2018). Five most promising markets in coffee. Presented at DNA Café– Seminário Internacional 2018. Retrieved from ve Most Promising Markets in Coffee.pdf?mkttok aDROcmpqQnphMSJ92.International Coffee Organization. (2019, March). Coffee market report.Retrieved from pdf3.Fairtrade Foundation. (n.d.). Coffee farmers. Retrieved from offee4.Panhuysen, S., & Joost, P. (2018). Coffee Barometer 2018 (p. 36). Retrieved rometer-2018.pdf5.International Coffee Organization. (2019, April 12). Report of the 16th meetingof the Statistics Committee held on 27 March 2019 (SC 93/19). (p. 4). Retrievedfrom rt.pdf6.Workman D. (2019). Coffee exports by country. Retrieved from ntry/7.Mordor Intelligence. (2018). Coffee market - Growth, trends and forecasts(2018-2023). Retrieved from /coffee-market8.Sänger, C. (2018, April 25). State of the global coffee market. Presented at the10th Multi-Year Expert Meeting on Commodities and Development, Geneva,Switzerland. Retrieved from 18 Christoph%20Saenger 25042018.pdf9.Lernoud, J., Potts, J., Sampson, G., Schlatter, B., Huppe, G., Dang, D.(2018). The state of sustainable markets 2018: Statistics and emerging trends.Geneva, Switzerland: International Trade Centre. Retrieved from t-FIN-web2.pdf10.Food and Agriculture Organization. (2017). Producer prices - Annual.Retrieved from http://www.fao.org/faostat/en/#data/PP11.Potts, J., Lynch, M., Wilking, A., Huppe, G., Cunningham, M., & Voora, V.(2014). State of sustainability initiatives review 2014: Standards and the greeneconomy. Winnipeg, Canada: International Institute for Sustainable Develoment,International Institute for Environment and Development.12.Nielsen. (2018). Sustainable shoppers buy the change they wish to see in theworld. The Evolution of the Sustainability Mindset. Retrieved from 4.Nestlé. (2017). Nestlé in society: Creating shared value and meeting our commitments2017. Retrieved from rary/documents/corporate social page 5615.Keurig Green Mountain. (2017). Keurig Green Mountain 2017 sustainabilityreport. (p. 30). Retrieved from http://www.keuriggreenmountain.com/ gSustainabilityReport 2017.ash16.Tchibo. (2018). Sustainability. Retrieved from Starbucks. (2017). Global social impact: 2017 performance report (p. 24). Retrievedfrom 019/01/StarbucksSocial Impact Report 2017.pdf18.Smucker’s. (2018). Green coffee: Responsible sourcing. Retrieved from ing/coffee.php19.Summers, C. (2014). How Vietnam became a coffee giant. BBC News.Retrieved from https://www.bbc.com/news/magazine-2581172420.Lamm, S. (2013). Poverty and the coffee industry. The Borgen Project.Retrieved from 21.Degn, E. (2018). How fair trade coffee in Colombia could solve the povertystruggle. The Borgen Project. Retrieved from colombia/22.Global Coffee Platform. (n.d.). Accelerate your coffee sustainability. Retrievedfrom ur-coffee-sustainability23.Conservation International. (n.d.). Sustainable Coffee Challenge. Retrievedfrom an Development Bank.(n.d.). SAFE Sustainable Agriculture FoodEnvironment. Retrieved from http://www.safeplatform.org/25.Monfreda, C., Ramankutty, N., & Foley, J. A. (2008, March). Farming theplanet: 2. Geographic distribution of crop areas, yields, physiological types,and net primary production in the year 2000. Global Biogeochemical Cycles,22, 1. doi: 10.1029/2007GB002947. Retrieved from crops26.Tayleur, C.,Vickery, J., Butchart, S., Corlet W. C., Buchanan, G Ducharme,H. (2017). GIS data for: Where are commodity crops certified, and what doesit mean for conservation and poverty alleviation?, Mendeley Data, v2. Retrievedfrom Chatham House. (2017). Resource Trade. Earth. Retrieved from https://resourcetrade.earth/28.Food and Agriculture Organization. (2017). Production Quantity. Retrievedfrom http://www.fao.org/faostat/en/#data/QCElliott, K.A. (2018). What are we getting from voluntary sustainability standardsfor coffee? Retrieved from ee.pdfExternal Peer Reviewer: Sjoerd Panhuysen, HIVOS 2019 The International Institute for Sustainable DevelopmentPublished by the International Institute for Sustainable Development.In collaboration with ITC and FiblHead Office111 Lombard Avenue, Suite 325Winnipeg, ManitobaCanada R3B 0T4Tel: 1 (204) 958-7700Website: www.iisd.orgTwitter: @IISD newsiisd.orgWith the support of the Swedish government
(VSSs) by coffee producers: in 2016, 34.5 per cent of the market was made up of VSS-compliant coffee, while coffee that was potentially VSS-compliant represented 21.4 per cent, and conventional coffee production accounted for 44 per cent of the market. VSS-Compliant Coffee Accounted fo