Transcription
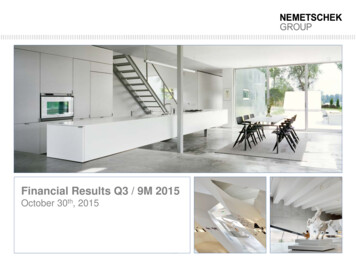
Financial Results Q3 / 9M 2015October 30th, 2015
Nemetschek Group Highlights for Q3 / 9M 2015 (1)Strong revenuegrowth in Q3 withnew record levelFocus oninternationalization/Strong US marketNew high of revenuesfrom softwarelicensesOCTOBER 2015 Q3: Revenues increased by 38.2% to new high of 70.7 mEUR (previous year: 51.2 mEUR)9M: Revenue increase of 34.2% to 205.9 mEUR (previous year: 153.5 mEUR)9M: Currency adjusted growth of 28.5%Bluebeam contributed in Q3: 11.1 mEUR / 9M: 32.1 mEUROrganic growth: Q3: 16.5% / 9M: 13.3% US revenues more than tripledRevenue share in the US increased to 25%Revenues abroad increased by 50.8% to 137.7 mEURDomestic revenues increased nicely by 9.8% to 68.3 mEUR 9M: Software license revenues increased significantly by 48.7% to record highof 106.7 mEURSoftware licenses will generate more recurring revenues in the future and will secure newcustomersRecurring revenues up to 89.9 mEUR ( 21.7%) – high share of 43.6%FINANCIAL RESULTS Q3 / 9M 20152
Nemetschek Group Highlights for Q3 / 9M 2015 (2)DesignBuildMedia &EntertainmentOCTOBER 2015 Product / New releases:ARCHICAD 19: “Faster than ever” – multi-processing, faster 3D navigation and 3D surfacepainter and productivity improvements, such as point cloud supportVectorworks 2016: Improved project sharing, energy tool (Energos), point cloud support etc.Vectorworks with new Atlanta Office for new software engineersAllplan 2016: Integration of the world-leading Parasolid modeling kernel for better designAcquisitions / Co-operations:Vectorworks acquired ESP Vision (most advanced lighting pre-visualization software) andsigned cooperation agreement with BIMobject (building material, product specificationsGraphisoft acquired distributor in Italy and UK Product / New releases / Rebranding:Bluebeam Studio Prime – a new cloud-based subscription solution: since 2010 over 225,000global users have generated over 2 billion posts in 131,000 projectsNevaris: New joint company name for Auer und Bausoftware. In a joint development, Nevaris3.0 was released: Easy to use commercial/technical holistic 5D solutionAcquisitions / Co-operations:Bluebeam acquired Swedish distributor Bluebeam AB as European headquarters and signedagreement with Allplan Swiss as a resellerBluebeam entered technology partnerships with Microsoft, CMiC and FieldLens Product / New releases:Cinema 4D Release 17: “Faster, easier, more realistic” – with improved rendering andanimationNew development office in CanadaFINANCIAL RESULTS Q3 / 9M 20153
Nemetschek Group Highlights for Q3 / 9M 2015 (3)Profitability ongood level Increase in EPS(w/o PPA) Strong cashconversion/Solid balance sheet Forecast increased * OperatingEBITDA grew by 27.2% to 49.4 mEUR; EBITDA margin at 24.0% as expectedNo activation of development costsno effects on expenses and earningsStrategic investments in future growth:Internationalization, BIM 5D competence, intensified sales activities etc.Tax rate increased to 31.0% (previous year: 26.9%)Reasons: Higher results in countries with higher tax rate and extraordinary impact due todeferred taxes of unrealized intra-group f/x gainsNet income (group shares) showed growth of 8.3% to 24.2 mEUR, EPS at 0.63 EURNet income w/o PPA increased stronger by 19.0% to 29.6 mEUR, EPS w/o PPA at 0.77 EURCash flow from operating activities up by 33.7% to 48.8 mEURConversion rate* at 99%Cash and cash equivalents at 71.5 mEUR; net liquidity at 20.5 mEUREquity ratio of 48.9% - leeway for further investments (organic and in acquisitions)Revenue target range increased to 278-282 mEUR, 27-29% (previously: 262-269 mEUR)EBITDA target range raised to 65-67 mEUR (previously: 62-65 mEUR)cash flow / EBITDAOCTOBER 2015FINANCIAL RESULTS Q3 / 9M 20154
Q3: Revenue growth rate accelerated again205,9153,551,351,070,768,666,651,2Revenuesin mEURQ1 2014Q1 2015 30.5%Change OCTOBER 2015Q2 2014Q2 2015 33.8%Revenue up by 38.2% to 70.7 mEURCurrency-adjusted growth of 32.9%Bluebeam contributed 11.1 mEUROrganic growth of high 16.5% yoyQ3 2014Q3 20159M 20149M 2015 34.2% 38.2% Up by 34.2% to 205.9 mEURCurrency-adjusted growth of 28.5%Bluebeam contributed 32.1 mEUROrganic growth of 13.3% yoyFINANCIAL RESULTS Q3 / 9M 20155
Strong growth in the U.S.Revenue split 9M 2015 in %Asia/Pacific9%Americas25%RoW1%Germany33%Europe w/oGermany32% Revenues abroad increased by 50.8% to 137.7 mEURUSA is becoming an important market: Revenues more than tripled year to date 2015Revenue share in the USA increased to 25% (previous year: 11%)Home market also developed nicely with 9.8%OCTOBER 2015FINANCIAL RESULTS Q3 / 9M 20156
Strong software license revenue growth ( 48.7%)Revenue split 9M 2015 in %Software license revenuesConsulting &Hardware4,6%Up by 48.7% to new record level of 106.7 mEURNew customers winsSoftwarelicenserevenues51,8%Increasing customer baseConsequently recurring revenues will followRecurring revenues*Up by 21.7% to 89.9 mEURRecurringrevenues*43,6%* Software services, subscriptionOCTOBER 2015FINANCIAL RESULTS Q3 / 9M 20157
EBITDA margin improved from Q2 to Q3in mEUR49,438,817,416,815,213,2Q1 2014EBITDAMarginQ1 2015Q2 2014 31.9%Change25.8%13,212,426.1%Q2 2015Q3 2014 22.6%24.2%22.2%Q3 20159M 2014 27.2% 27.0%25.9%23.8%9M 201525.3%24.0% EBITDA margin inline with expectations Future-oriented investments: Internationalization, BIM 5D competence, intensified sales and marketing activitiesOCTOBER 2015FINANCIAL RESULTS Q3 / 9M 20158
Net income and EPS (with and w/o PPA)Net incomeNet income w/o PPAEPSEPS w/o PPAin mEURin mEURin EURin EUR29,624,224,822,30,770,589M 2014Change9M 2015 8.3%9M 20149M 2015 19.0%9M 20140,630,659M 20159M 2014 8.3%9M 2015 19.0% Higher tax rate of 31.0% (previous year: 26.9%) Reasons: Increased results in countries with higher tax rates; Deferred tax expenses on unrealized intra-Group foreignexchange gains Higher PPA because of Bluebeam acquisitionOCTOBER 2015FINANCIAL RESULTS Q3 / 9M 20159
Segment overviewDesignDesign segment showed significantrevenue growth in Q3 with 18.1%and 13.4% in 9M 2015Stable margin with strategicinvestments to secure future growth(employees, internationalization)BuildBluebeam is growth driver(32.1 mEUR contribution)9M 2015 organic growth of6.5%Further investments in BIM 5DcompetenceManageContinued revenue growth (9M2015: 11.4%)Slight margin decline becauseof growth investments inhousing sectorMedia & EntertainmentPositive development with 18.0%revenue growth in 9M 2015Investments in new customersegments etc. will have furtherimpact on margins143,4126,443,5126,4Revenuesin mEUR12,610,79M 2014ChangeEBITDAMarginOCTOBER 20159M 20159M 2014 13.4%24.5%24.2%9M 20153,74,29M 20149M 2015 306.8%18.7%18.5%9M 2014 11.4%16.9%15.4%14,99M 2015 18.0%41.0%40.6%FINANCIAL RESULTS Q3 / 9M 201510
Cash flow situation49,4EBITDAEBITDA 27.2% yoy38,8Operating cash flow48,8Operating cash flow36,5 33.7% yoyInvesting cash flowHigher Capex with 5.7 mEUR-8,0Investing cash flowInvestment in distribution network in Italy, UK(Graphisoft) and Sweden (Bluebeam)-3,6-28,5Cash flow from financing activities-16,4Cash flow from financing activitiesRepayment of bank loan (9.0 mEUR)20,5Net liquidity-3,0 *Dividend payment (15.4 mEUR)Net liquidity situationLeeway to grow organically and via acquisitions*OCTOBER 20159M 20159M 2014as of Dec. 31, 2014Conversion rate99% (previous year: 94%)FINANCIAL RESULTS Q3 / 9M 201511
Outlook 2015 – Forecast increased Current situation Successful 9-months figures with strong revenue growth andstable profitability Market conditions Robust development of construction markets Additional growth coming from trends such as Open BIM, BIM5D, collaboration, mobile solutions, cloud Strategic marketpositioning Clear focus on AEC market Leading in Open BIM solutions Strong and independent global brands Growth potential/Investments Forecast increasedFocus on internationalization (North/Latin America, Asia)Investments in sales and marketingInvestments in BIM 5D competenceStrategically sound co-operationsSolid balance sheetCapable of investing in organic and in inorganic growthin mEURRevenuesEBITDAFY 2014Previous Forecast*as of March 31, 2015Forecast 2015 revised**as of October 30, 2015218.5262 – 269 ( 20%-23%)278 - 282 ( 27%-29%)56.862 - 6565 - 67* USD/EUR plan rate: 1.25** USD/EUR plan rate: 1.11OCTOBER 2015FINANCIAL RESULTS Q3 / 9M 201512
AppendixOCTOBER 2015FINANCIAL RESULTS Q3 / 9M 201513
P L statement Q3 comparisonmEURQ3 2015Q3 2014% YoY9M 20159M 2014% YoY70.751.2 38.2%205.9153.5 34.2%0.71.0-27.3%3.62.7 34.6%Operating income71.552.2 36.9%209.5156.1 34.2%Cost of materials/ purchased services-2.5-2.1 17.5%-6.9-5.9 17.5%Personnel expenses-32.3-21.7 49.0%-93.2-66.2 40.9%Other operating expenses-19.9-15.2 31.0%-60.0-45.2 32.6%Operating costs-54.7-39.0 40.3%-160.1-117.3 36.5%16.813.2 27.0%49.438.8 27.2%23.8%25.9%24.0%25.3%Depreciation of PPA and amortization-4.2-2.4 77.6%-12.5-6.6 88.0%t/o PPA-2.5-1.0 151.0%-7.6-3.0 155,0%EBITA (normalized EBIT)15.111.9 27.4%44.535.2 26.6%EBIT12.610.9 15.9%36.932.2 14.7%Financial result-0.10.0-0.20.0EBT12.510.9 14.5%36.732.2 14.0%Income taxes-3.4-2.6 32.9-11.4-8.7 31.0%Non-controlling interests-0.3-0.4-1.2-1.28.77.9 9.6%24.222.3 8.3%0.230.21* 9.6%0.630.58* 8.3%RevenuesOwn work capitalized/ other operating incomeEBITDAMarginNet income (group shares)EPS in EUR* for better comparability, earnings per share has been presented after the stock splitOCTOBER 2015FINANCIAL RESULTS Q3 / 9M 201514
Balance sheet - AssetsmEURSeptember 30, 2015December 31, 2014Cash and cash equivalents71.557.0Trade receivables, net29.128.90.90.712.111.8113.698.4Property, plant and equipment13.310.8Intangible assets64.668.8117.1111.32.92.5Non-current assets, total197.9193.3Total assets311.4291.7AssetsInventoriesOther current assetsCurrent assets, totalGoodwillOther non-current assetsOCTOBER 2015FINANCIAL RESULTS Q3 / 9M 201515
Balance sheet – Equity and liabilitiesmEURSeptember 30, 2015December 31, 2014Short-term borrowings and current portion of long-term loans12.012.0Trade payables & accrued liabilities27.626.9Deferred revenue45.432.4Other current assets10.113.0Current liabilities, total95.184.3Long-term borrowings without current portion39.048.0Deferred tax liabilities15.815.49.17.4Non-current liabilities, total63.970.8Subscribed capital and capital reserve51.051.0104.696.6-5.0-12.61.81.6Equity, total152.4136.6Total equity and liabilities311.4291.7Equity and liabilitiesOther non-current liabilitiesRetained earningsOther comprehensive incomeNon-controlling interestsOCTOBER 2015FINANCIAL RESULTS Q3 / 9M 201516
Cash flow statementmEURSeptember 30, 2015September 30, 2014% YoYCash and cash equivalents at the beginning of theperiod57.048.6 17.3%Cash flow from operating activities48.836.5 33.7%Cash flow from investing activities-8.0-3.6 123.3%t/o CapEX-5.7-2.5 129.9%t/o Cash paid for business combinations-2.4-0.9Cash flow from financing activities-28.5-16.4 73.6%t/o Dividend payments-15.4-12.5 23.1%2.20.9Cash and cash equivalents at the end of the period71.566.0 8.4%Free cash flow(1)40.833.0 23.9%FX-effects(1)Operating cash flow -Investing cash flowOCTOBER 2015FINANCIAL RESULTS Q3 / 9M 201517
ContactDisclaimerNEMETSCHEK AGInvestor RelationKonrad-Zuse-Platz 1D-81829 MunichGermanyE-mail contact@nemetschek.comwww.nemetschek.comThis presentation contains forward-looking statements based on the beliefs of Nemetschek AGmanagement. Such statements reflect current views of Nemetschek AG with respect to futureevents and results and are subject to risks and uncertainties. Actual results may vary materiallyfrom those projected here, due to factors including changes in general economic and businessconditions, changes in currency exchange, the introduction of competing products, lack ofmarket acceptance of new products, services or technologies and changes in businessstrategy. Nemetschek AG does not intend or assume any obligation to update these forwardlooking statements.OCTOBER 2015FINANCIAL RESULTS Q3 / 9M 2015
OCTOBER 2015 FINANCIAL RESULTS Q3 / 9M 2015 2 . Vectorworks 2016: Improved project sharing, energy tool ( Energos), point cloud support etc. Vectorworks with new Atlanta Office for new software engineers Allplan 2016: Integration of the wo


