Transcription
Morbidity and Mortality Weekly ReportWeekly / Vol. 64 / No. 9March 13, 2015Invasive Cancer Incidence and Survival — United States, 2011S. Jane Henley, MSPH1, Simple D. Singh, MD1, Jessica King, MPH1, Reda Wilson, MPH1, Mary Elizabeth O’Neil, MPH1, A. Blythe Ryerson, PhD1(Author affiliations at end of text)Because of improvements in early detection and treatmentof cancer, the proportion of persons with cancer who survive 5 years after diagnosis has increased (1). To assess progresstoward achieving Healthy People 2020 objectives (2),* CDCanalyzed data from U.S. Cancer Statistics (USCS) for 2011, themost recent data available. USCS includes incidence and survival data from CDC’s National Program of Cancer Registries(NPCR) and the National Cancer Institute’s Surveillance,Epidemiology, and End Results (SEER) program and mortalitydata from the National Vital Statistics System (3). In 2011,a total of 1,532,066 invasive cancers were reported to cancerregistries in the United States (excluding Nevada), for anannual incidence rate of 451 cases per 100,000 persons. Cancerincidence rates were higher among males (508) than females(410), highest among black persons (458), and ranged by state,from 374 to 509 per 100,000 persons (339 in Puerto Rico).The proportion of persons with cancer who survived 5 yearsafter diagnosis was 65% and was similar among males (65%)and females (65%) but lower among black persons (60%)compared with white persons (65%). Surveillance of cancerincidence and survival are essential for identifying populationgroups with high cancer incidence rates and low cancer survivalrates as well as for estimating the number of cancer survivors,which was 13.7 million in 2012 (1). These data are being usedby states to effectively develop comprehensive cancer controlprograms, including supporting the needs of cancer survivors.Invasive cancers are all cancers excluding in situ cancers(except in the urinary bladder) and basal and squamous cellskin cancers. Data on new cases of invasive cancer diagnosedduring 2011 were obtained from population-based cancer* As of 2014, Healthy People 2020 objectives included improving to 71.7% theproportion of persons surviving 5 years after cancer diagnosis, reducingcolorectal cancer incidence to 41.6 per 100,000 persons, reducing late-stagebreast cancer incidence to 38.9 per 100,000 women, and reducing cervicalcancer incidence to 7.5 per 100,000 women.registries affiliated with the NPCR and/or SEER programs ineach state, the District of Columbia (DC), and Puerto Rico (3).For comparability with past estimates, data for the UnitedStates are restricted to the states and DC, and data for PuertoRico are analyzed and presented separately. Data from DCand all states except Nevada met USCS publication criteria for2011†; consequently, data in this report cover 99% of the U.S.population. Cases were first classified by anatomic site usingthe International Classification of Diseases for Oncology, Third† Cancer registries demonstrated that cancer incidence data were of high qualityby meeting the six USCS publication criteria: 1) case ascertainment is 90%complete; 2) 5% of cases are ascertained solely on the basis of a death certificate;3) 3% of cases are missing information on sex; 4) 3% of cases are missinginformation on age; 5) 5% of cases are missing information on race; and6) 97% of the registry’s records passed a set of single-field and inter-fieldcomputerized edits that test the validity and logic of data components.Additional information available at http://www.cdc.gov/uscs.INSIDE243 Missed Opportunities for Tetanus PostexposureProphylaxis — California, January 2008–March 2014247 Stressful Life Events Experienced by Women in theYear Before Their Infants’ Births — United States,2000–2010252 Bacterial Enteric Infections Detected by CultureIndependent Diagnostic Tests — FoodNet, UnitedStates, 2012–2014258 Notes from the Field: Multistate Outbreak of HumanSalmonella Infections Linked to Live Poultry from aMail-Order Hatchery in Ohio — February–October 2014260 QuickStatsContinuing Education examination available athttp://www.cdc.gov/mmwr/cme/conted info.html#weekly.U.S. Department of Health and Human ServicesCenters for Disease Control and Prevention
Morbidity and Mortality Weekly ReportEdition. Cases with hematopoietic histologies were furtherclassified using the World Health Organization Classificationof Tumours of Haematopoietic and Lymphoid Tissues, FourthEdition. Breast cancers were characterized by stage at diagnosisusing SEER Summary Staging Manual 2000§; late-stage cancers include those diagnosed after they had spread regionallyor metastasized.Population denominators for incidence rates are race-,ethnicity-, and sex-specific county population estimates fromthe 2010 U.S. Census, as modified by SEER and aggregatedto the state and national level.¶ Annual incidence rates per100,000 population were age-adjusted by the direct methodto the 2000 U.S. standard population.For the first time, a subset of the USCS dataset includesthe 5-year relative survival rate, defined as the proportion ofpersons surviving 5 years after cancer diagnosis comparedwith the proportion of survivors expected in a set of comparable cancer-free persons. These estimates are based ondata from NPCR-funded states that met USCS publicationcriteria and conducted active case follow-up or linkage withCDC’s National Center for Health Statistics National Death§ Additional information available at http://seer.cancer.gov/tools/ssm.¶ Population estimates incorporate bridged single-race estimates derivedfromthe original multiple race categories in the 2010 U.S. Census. Additionalinformation available at http://seer.cancer.gov/popdata/index.html and dex (4). For this report, 30 states met these criteria, covering71% of the U.S. population. The 5-year relative survival rateswere calculated for cases diagnosed during 2003–2010 withfollow-up through 2010 (4).In 2011, a total of 1,532,066 invasive cancers were diagnosedand reported to central cancer registries in the United States(excluding Nevada), including 786,102 among males and745,964 among females (Table 1). The age-adjusted annualincidence for all cancers was 451 per 100,000 population: 508per 100,000 in males and 410 per 100,000 in females. Amongpersons aged 20 years, 14,754 cancer cases were diagnosed in2011 (Table 1). By age group, rates per 100,000 populationin 2011 were 18 among persons aged 20 years, 154 amongthose aged 20–49 years, 816 among those aged 50–64 years,1,840 among those aged 65–74 years, and 2,223 among thoseaged 75 years (Table 1).By cancer site, rates were highest for cancers of the prostate(128 per 100,000 men), female breast (122 per 100,000women), lung and bronchus (61 per 100,000 persons), andcolon and rectum (40 per 100,000 persons) (Table 1). Thesefour sites accounted for half of cancers diagnosed in 2011,including 209,292 prostate cancers, 220,097 female breastcancers, 207,339 lung and bronchus cancers, and 135,260colon and rectum cancers. In 2011, the cervical cancer incidence rate was 7.5 per 100,000 women, representing 12,109reported cancers.The MMWR series of publications is published by the Center for Surveillance, Epidemiology, and Laboratory Services, Centers for Disease Control and Prevention (CDC),U.S. Department of Health and Human Services, Atlanta, GA 30329-4027.Suggested citation: [Author names; first three, then et al., if more than six.] [Report title]. MMWR Morb Mortal Wkly Rep 2015;64:[inclusive page numbers].Centers for Disease Control and PreventionThomas R. Frieden, MD, MPH, DirectorHarold W. Jaffe, MD, MA, Associate Director for ScienceJoanne Cono, MD, ScM, Director, Office of Science QualityChesley L. Richards, MD, MPH, Deputy Director for Public Health Scientific ServicesMichael F. Iademarco, MD, MPH, Director, Center for Surveillance, Epidemiology, and Laboratory ServicesMMWR Editorial and Production Staff (Weekly)Sonja A. Rasmussen, MD, MS, Editor-in-ChiefCharlotte K. Kent, PhD, MPH, Executive EditorJohn S. Moran, MD, MPH, EditorTeresa F. Rutledge, Managing EditorDouglas W. Weatherwax, Lead Technical Writer-EditorJude C. Rutledge, Writer-EditorMartha F. Boyd, Lead Visual Information SpecialistMaureen A. Leahy, Julia C. Martinroe,Stephen R. Spriggs, Terraye M. StarrVisual Information SpecialistsQuang M. Doan, MBA, Phyllis H. KingInformation Technology SpecialistsMMWR Editorial BoardWilliam L. Roper, MD, MPH, Chapel Hill, NC, ChairmanMatthew L. Boulton, MD, MPH, Ann Arbor, MIVirginia A. Caine, MD, Indianapolis, INJonathan E. Fielding, MD, MPH, MBA, Los Angeles, CADavid W. Fleming, MD, Seattle, WAWilliam E. Halperin, MD, DrPH, MPH, Newark, NJ238MMWR / March 13, 2015 / Vol. 64 / No. 9King K. Holmes, MD, PhD, Seattle, WATimothy F. Jones, MD, Nashville, TNRima F. Khabbaz, MD, Atlanta, GAPatricia Quinlisk, MD, MPH, Des Moines, IAPatrick L. Remington, MD, MPH, Madison, WIWilliam Schaffner, MD, Nashville, TN
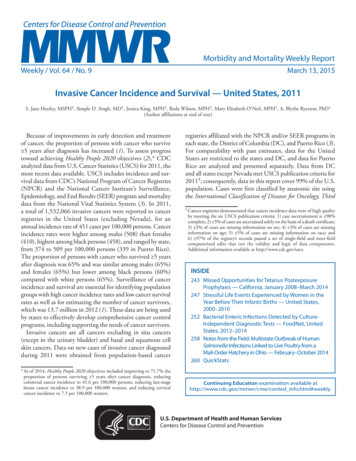
Morbidity and Mortality Weekly ReportTABLE 1. Number of invasive cancers* and annual rate,† by sex, primary site, race/ethnicity,§ and age group — National Program of CancerRegistries, and Surveillance, Epidemiology, and End Results Program, United States,¶ 2011OverallCharacteristicRateNo.All sitesProstateFemale breastLate-stage female breastLung and bronchusColon and rectumCervix uteriRace/EthnicityWhiteBlackAmerican Indian/Alaska NativeAsian and Pacific IslanderHispanicAge group (yrs)0–1920–4950–6465–74 97,01765,16112,109(84)(11)( (9)(2)Abbreviation: NA not available.* Excludes basal and squamous cell carcinomas of the skin except when these occur on the skin of the genital organs, and in situ cancers except urinary bladder.† Per 100,000 persons, age-adjusted to the 2000 U.S. standard population.§ Racial categories are not mutually exclusive from Hispanic ethnicity. Rates are not presented for persons with unknown or other race.¶ Compiled from cancer registries that meet the data quality criteria for all invasive cancer sites combined (covering approximately 99% of the U.S. population).By state in 2011, all-sites cancer incidence rates ranged from374 to 509 per 100,000 persons (Figure). State site-specificcancer incidence rates ranged from 79 to 195 per 100,000 menfor prostate cancer, 106 to 153 per 100,000 women for femalebreast cancer, 29 to 93 per 100,000 persons for lung cancer,33 to 49 per 100,000 persons for colorectal cancer, and 4.5 to13.7 per 100,000 women for cervical cancer (Figure). HealthyPeople 2020 targets were reached in 37 states for incidence ofcolorectal cancer and in 28 states for incidence of cervical cancer. Compared with the states and DC, cancer incidence ratesin Puerto Rico in 2011 were lower for all-sites cancer (339 per100,000 persons), lung cancer (17 per 100,000 persons), andbreast cancer (93 per 100,000 women), but higher for prostatecancer (150 per 100,000 men), colorectal cancer (43 per 100,000persons), and cervical cancer (13.5 per 100,000 women).Among persons with cancer diagnosed during 2003–2010,the 5-year relative survival rate was 65% (Table 2). This percentage was similar for males and females. The 5-year relativesurvival was highest among those diagnosed with cancer beforeage 45 years (81%) and decreased with increasing age (Table 2).Among the most common cancer sites, 5-year relative survivalwas highest for prostate cancer (97%) and breast cancer (88%),intermediate for colorectal cancer (63%), and lowest for lungcancer (18%) (Table 2). The 5-year relative survival after anycancer diagnosis was lower for black persons (60%) than forwhite persons (65%) and for each cancer site (Table 2).DiscussionThis report provides estimates of cancer incidence for 2011in the United States and shows that Healthy People 2020 targets were achieved in 37 states for reduced colorectal cancerincidence and 28 states for reduced cervical cancer incidence.For the first time, cancer incidence rates in Puerto Rico areincluded with the state-specific cancer incidence rates. Cancerincidence rates in Puerto Rico reflect screening practices andrisk factors that might differ from those in the U.S. states.Also for the first time, data on survival are included. In theUnited States, about two of three persons diagnosed withcancer survive 5 years after diagnosis. This depends on thetype of cancer and age at diagnosis, and was lower among blackpersons compared with white persons. Differences in survivalafter cancer diagnosis might be attributable to differences intype of cancer, stage at diagnosis, timeliness of follow-up afterdiagnosis, appropriate treatment after diagnosis, or having achronic condition (5). Cancer itself is considered a chroniccondition, and many cancer survivors face physical, psychological, social, spiritual, and economic challenges becauseof their cancer diagnosis and treatment (6). CDC strives toaddress health and quality-of-life issues of cancer survivorsthrough programs and research related to coordination ofcare, patient-provider communication, health promotion,supportive services, fertility preservation, and health equity.**** Additional information available at http://www.cdc.gov/cancer/survivorship.MMWR / March 13, 2015 / Vol. 64 / No. 9239
Morbidity and Mortality Weekly ReportFIGURE. Rate* of invasive cancer, by primary cancer site — National Program of Cancer Registries and Surveillance, Epidemiology, and EndResults Program, United States, 2011All 55.2373.8–434.6Data suppressedPR (338.6)Breast 8.6–120.7Data suppressedCervix 9–116.5Data suppressedPR ata suppressedPR (12.8)Colon and .8Data suppressedPR (17.2)* Per 100,000 persons, age-adjusted to the 2000 U.S. standard population.240PR (150.0)MMWR / March 13, 2015 / Vol. 64 / No. a suppressedPR (43.3)
Morbidity and Mortality Weekly ReportTABLE 2. 5-year relative survival (percentage) after cancer diagnosis,* by race, sex, primary site, and age group — National Program of CancerRegistries, United States†All racesCharacteristicOverallAll sites65ProstateNAFemale breastNALung and bronchus18Colon and rectum63Cervix uteriNAAge group at diagnosis (yrs)0–448145–547155–646865–7464 on: NA not available.* Based on cases diagnosed during 2003–2010 and follow-up of patients through 2010.† Compiled from 30 cancer registries that met data quality criteria for survival analysis, covering approximately 71% of the U.S. population.Cancer incidence and survival data can guide the planningand evaluation of cancer prevention and control programs. InVermont, for example, cancer registry data were used to identifytwo counties with high melanoma incidence rates in which topilot a new program for skin cancer prevention (7). These datacan also assist long-term planning for cancer diagnostic andtreatment services. The Colorado Central Cancer Registry, incollaboration with CDC, has built a free, user-friendly webbased module for clinicians that uses cancer registry data tocreate treatment summaries and personalized cancer survivorship plans (8). Finally, these data can help public health officialsset priorities for allocating health resources. For example, datafrom the North Carolina Central Cancer Registry are linkedinto North Carolina’s Integrated Cancer Information andSurveillance System, which overlays the cancer data with censusdata, health indicators, and socioeconomic variables to facilitatecancer-focused research, from prevention through diagnosis,treatment, survival, and end-of-life care (9). CDC annuallyprovides cancer surveillance via several products, includingUSCS, CDC WONDER, State Cancer Profiles, and CDC’sNational Center for Health Statistics Research Data Centers.††The findings in this report are subject to at least three limitations. First, analyses based on race and ethnicity might bebiased if race and ethnicity were systematically misclassified;ongoing efforts are made to ensure that this information is asaccurate as possible.§§ Second, delays in cancer reporting mightresult in an underestimate of certain cancers; reporting delays††Additional information available at http://www.cdc.gov/cancer/npcr/datarelease.htm, http://wonder.cdc.gov, erates/index.php, and http://www.cdc.gov/rdc/b1datatype/dt131.htm.§§ Additional information available at http://www.cdc.gov/cancer/npcr/uscs/technical notes/interpreting/race.htm.What is already known on this topic?Cancer is a leading cause of illness in the United States. Becauseof earlier detection of cancers with effective treatments,improved cancer treatments, and better general medical care,the percentage of persons living after a cancer diagnosis hasincreased over the past decades.What is added by this report?National cancer surveillance data indicate that 1,532,066 newcases of invasive cancer were diagnosed in the United States(excluding Nevada) in 2011, an annual incidence rate of 508cases per 100,000 among males and 410 among females.All-sites cancer incidence rates ranged by state from 374 to 509per 100,000 persons and was 339 per 100,000 persons in PuertoRico. Healthy People 2020 targets were reached in 37 states forreduced incidence of colorectal cancer and in 28 states forreduced incidence of cervical cancer. About two of three personsdiagnosed with cancer survived 5 years after diagnosis.What are the implications for public health practice?Public health officials can use cancer incidence and survivaldata to identify population groups with high cancer incidencerates and low cancer survival rates who might benefit mostfrom targeted cancer prevention and control efforts. Usingthese data to effectively develop comprehensive cancer controlprograms, including supporting the needs of cancer survivors,can help reduce cancer incidence and improve survival.are more common for cancers such as melanoma that are diagnosed and treated in nonhospital settings such as physicians’offices (10). Finally, relative survival rates could be calculatedonly for white and black racial groups because accurate lifetables were not available for other racial/ethnic groups.National cancer surveillance data are essential for publichealth officials to monitor cancer incidence, mortality, andMMWR / March 13, 2015 / Vol. 64 / No. 9241
Morbidity and Mortality Weekly Reportsurvival in the United States; identify populations that mightbenefit most from targeted cancer prevention and controlefforts; help guide the planning of health care allocation andsupport services; and track progress toward the national cancerobjectives set forth in Healthy People 2020.1Division of Cancer Prevention and Control, National Center for ChronicDisease Prevention and Health Promotion, CDC (Corresponding author:S. Jane Henley, shenley@cdc.gov, 770-488-4157)AcknowledgmentState and regional cancer registry personnel.References1. de Moor JS, Mariotto AB, Parry C, et al. Cancer survivors in the UnitedStates: prevalence across the survivorship trajectory and implications forcare. Cancer Epidemiol Biomarkers Prev 2013;22:561–70.2. US Department of Health and Human Services. Healthy People 2020.Available at 2020/default.aspx.3. US Cancer Statistics Working Group. United States Cancer Statistics:1999–2011 incidence and mortality web-based report. Available athttp://www.cdc.gov/uscs.242MMWR / March 13, 2015 / Vol. 64 / No. 94. Wilson RJ, Ryerson AB, Zhang K, Dong X. Relative survival analysisusing the Centers for Disease Control and Prevention National Programof Cancer Registries surveillance system data 2000–2007. J RegistryManag 2014;41:72–6.5. Hewitt M, Greenfield S, Stovall E, eds. From cancer patient to cancersurvivor: lost in transition. Washington, DC: The National AcademiesPress; 2005.6. Livestrong Foundation, CDC. A national action plan for cancersurvivorship: advancing public health strategies. Atlanta, GA: USDepartment of Health and Human Services, Centers for Disease Controland Prevention; 2004. Available at f.7. Vermont Cancer Registry. Using melanoma incidence data to designsun protection interventions, 2013. Available at ONT.pdf.8. Colorado Department of Public Health and Environment. Coloradosurvivorship care planning program. Available at https://www.colorado.gov/cdphe/Survivorship.9. Meyer AM, Olshan AF, Green L, et al. Big data for population-basedcancer research: the Integrated Cancer Information and SurveillanceSystem. N C Med J 2014;75:265–8.10. Clegg LX, Feuer EJ, Midthune DN, et al. Impact of reporting delay andreporting error on cancer incidence rates and trends. J Natl Cancer Inst2002;94:1537–45.
Morbidity and Mortality Weekly ReportMissed Opportunities for Tetanus Postexposure Prophylaxis — California,January 2008–March 2014Cynthia Yen, MPH1, Erin Murray, PhD1, Jennifer Zipprich, PhD1, Kathleen Winter, MPH1, Kathleen Harriman, PhD1 (Author affiliations at end of text)Tetanus is an acute and sometimes fatal disease characterizedby sudden muscle contractions. The number of tetanus casesreported annually in the United States has declined significantly since the 1930s and 1940s as a result of the introductionof tetanus vaccines (1). However, sporadic cases continue tooccur in persons who are not up-to-date with tetanus toxoidcontaining vaccinations (TT) and do not receive appropriatepostexposure prophylaxis (PEP). To assess the extent of thesecases, the California Department of Public Health reviewedall tetanus cases reported during January 2008–March 2014.A total of 21 tetanus patients were reported; five (24%) died.An average of three cases were reported each year during2008–2013; the average annual incidence among patients aged 65 years (0.23 cases per 1 million population) was twice thatamong patients aged 21–64 years (0.10 cases per 1 millionpopulation). Of 16 patients with an acute injury before illness and diagnosis, nine (56%) sought medical care, and two(22%) of the nine received appropriate PEP. Although tetanusis rare, it is a life-threatening disease that is preventable. Healthcare providers should ensure that their patients are up-to-datewith TT vaccination and provide appropriate postexposureprophylaxis for patients with wounds.During 2008–2010, a confirmed case was defined by theCouncil of State and Territorial Epidemiologists (CSTE) asa patient with acute onset of hypertonia or painful muscularcontractions (usually of the muscles of the jaw and neck) andgeneralized muscle spasms without other apparent medicalcause.* In 2010, CSTE removed the “confirmed” classification and defined all clinically compatible cases as probable.†The California Department of Public Health analyzed allconfirmed and probable cases in accordance with CSTE casedefinitions. Using the CDC tetanus surveillance worksheet,local health department and California Department of PublicHealth staff reviewed case surveillance and medical record data,including demographics, clinical presentation and course,vaccination status, and wound management. Vaccinationand wound data were reviewed to determine whether healthcare providers followed wound management and PEP recommendations (2,3). Tetanus incidence rates were calculated* Additional information available at YrID 864&DatePub 1/1/1996.† Additional information available at YrID 865&DatePub 1/1/2010.using population estimates from the California Departmentof Finance. Hospitalization costs were estimated using discharge data from the Office of Statewide Health Planningand Development.During January 2008–March 2014, a total of 21 tetanuscases were reported; five (24%) were fatal (Table 1). Thepatients were all adults ranging in age from 21 to 89 years(median 52 years); 15 (71%) were male. An average of threecases were reported each year during 2008–2013 (range 0–5).The average annual tetanus incidence rate during 2008–2013was 0.09 cases per 1 million population, compared with0.19 cases during 2002–2007. During 2008–2013, the averageannual incidence among patients aged 65 years (0.23 casesper 1 million population) was twice that among patientsaged 21–64 years (0.10 cases per 1 million population). Thecase-fatality rate among patients aged 65 years was 50%,compared with 13% among patients aged 21–64 years. Raceand ethnicity were reported for 18 (86%) patients. The averageannual incidence rates among Hispanics (0.08 cases per 1 million population), non-Hispanic whites (0.09), non-Hispanicblacks (0.07), and non-Hispanic Asians/Pacific Islanders (0.03)were similar.All 21 tetanus patients were hospitalized; 19 (90%) wereadmitted to an intensive care unit, and nine required mechanical ventilation. The median number of days hospitalized was 18(range 2–65); of 15 patients for whom data were available, themedian cost of total hospital charges per patient was 166,259(range 22,229– 1,024,672). Seven patients had conditionsassociated with increased risk for tetanus; four were diabetic,and three were injection-drug users (1).TT history was reportedfor 12 (57%) patients; three (25%) could not recall receivingany doses, and nine (75%) recalled receiving 1 dose. Amongthe nine patients who recalled receiving 1 dose, six receivedtheir last dose 10 to 50 years before their illness, and threecould not recall when they received their last dose.Sixteen (76%) patients reported that an acute injury hadoccurred before illness onset; including punctures (seven),abrasions (four), linear lacerations (three), compound fracture (one) and animal bite (one). Of six patients with data onwound depth, two had wounds that were 1 cm deep. Sevenof 11 patients with available data had wounds that appearedinfected, and two of seven patients with available data hadwounds with devitalized, ischemic, or denervated tissue. FiveMMWR / March 13, 2015 / Vol. 64 / No. 9243
Morbidity and Mortality Weekly ReportTABLE 1. Number of tetanus cases (N 21), by selected characteristics and outcome — California, January 2008–March 2014DiedCharacteristicSexMaleFemaleAge group (yrs)21–4950–64 65Clinical courseHospitalizedAdmitted to ICUMedian no. of days hospitalized (range)Underlying conditionsDiabetesInjection drug userTetanus vaccination historyZero dosesAt least one dose*UnknownInjury historyAcute injury before illnessPunctureAbrasionLinear lacerationCompound fractureAnimal biteSought medical care for acute injuryReceived recommended postexposure 9 (4–38)17 (2–65)17 (2–65)* Of patients who had received at least one dose of TT-containing vaccine, none recalled receiving a dose in the preceding 10 years.patients reported no acute injuries before onset; of these, threewere injection-drug users. The remaining two patients couldnot recall any acute injuries; however, one reported an insectbite, and the other reported chronic abrasions on the handsand feet and exposure to soil.Of the 16 patients who reported acute injuries before illnessonset, nine had sought medical care for their injuries (Table 2).Of the nine, only two received appropriate PEP before theonset of tetanus symptoms as recommended by the AdvisoryCommittee on Immunization Practices (ACIP) (Table 3) (2,3).Of the seven patients who did not receive appropriate PEP,five had punctures or contaminated wounds and unknown TTvaccination histories, and should have received both TT andtetanus immune globulin (TIG) as recommended. However,four patients did not receive any PEP, and one received TT PEPonly. Of the two remaining patients, one had a clean, minorwound and reported receiving at least one TT dose more than10 years ago, but was not offered TT PEP as recommended;the other patient was contraindicated for TT because of a history of anaphylaxis, but was not offered TIG as an alternative.Following their tetanus diagnoses, all 21 patients were treatedwith TIG; six were treated 1 day after symptom onset, eight 4 days, six 9 days, and one was treated 2 weeks after onset.244MMWR / March 13, 2015 / Vol. 64 / No. 9Among the five fatal cases, one patient was treated 1 day aftersymptom onset, two were treated 4 days, and two 9 daysafter onset. Of 15 patients for whom data on TIG dosagewere available, five received less than the 3,000–6,000 U thatis generally recommended for treatment (4); two received lessthan 500 U, a
Morbidity and Mortality Weekly Report. MMWR / March 13, 2015 / Vol. 64 / No. 9 239. By st