Transcription
for the Agedand chronically illUnitedStates- April- June1963Statisticson number and types of institutionsforthe aged accordingto whetherround-the-clocknursing service is provided,type of nurse in chargepolicies,and chargesof nursingcare, admissionfor care of residents.Based on data collectedfrominstitutionsduring the period 65WELFAREPublicHealthServiceLutherL. TerrySurgeonGeneralSeriesI Number121
/.!r.Fublic Health Service Publication No. 1 0 0 M e x i e s12-No. 1For sale b y the S u erintendent of Documents, U.S. G o v e r n m e n t Printing O & ek a & i n & m , D.C., 2 0 4 0 2 - Price 8 5 cente
NATIONALCENTERFORHEALTHSTATISTICSFORREST E. LINDER,PH. D., DirectorTHEODORED. WOOLSEY, DeputyDirectorOSWALD K. SAGEN, PH.D., ArsirtantDirectorWALT R. SIMMONS, M.A., %atirtica AdvisorALICE M.WATERHOUSE,M.D., MedicalAd&orJAMES E.KELLY,D.D.S., Dental AdvisorLOUIS R. STOLCIS,M.A., Executive OjicerDIVISION OF HEALTH RECORDS STATISTICSMONROE G. SIRKEN,PublicHealthLibraryServiceof CongressPublicationCatalogPH.D., ChiefNo.lOOO-Series12.No.Card Number 65-615461
CONTENTSPageJnQ-duction ---------------------------------General Survey Design Cflaj-acteristics of Institutions -- - 33Type of Service, Ownership, Region, and Size-------------------------4Type of Nurse in Charge of NursingCare----------------------------- --Ro d-the-Clock NursingService - -- ---------- - - --7Admission ------7Charges for Car- of Residents --- -- - --- 13Derailed -----------17Appendix I. Technical Notes on the Survey Design and Prccedures--------General -- --- -------------------31313131333334Sampling ------Sample --------Survey p-j--edure and tion of Missing Data-- -------------- -Estimation and Reliability of Est&nates-----Appendix II.A. Definitions of Certain Terms Used in This Report-----------------Terms Relating to Establishments or ---------------------------------------B. Classification of Establishments by Type of Service and Ownership--1. Source of Data for Classifying Establishments------------------2. Criteria for Classifying Establishments by Type of Service------Appendix III.A. Questionnaire for the Resident Places Survey-l -------------------B. Questionnaire for the Master Facility Inventory Survey--------------3737373838384044
IN THIS REPORTinstitutionsfor the aged in the United States ayedescribed in terms of their admission policies, type of nuY.se in chargeof nursingcave, whether OY not round-the-clocknursing service isprovided, and the amount charged for cave of residents.The data ayebased on a sample survey conducted during the spring of 1963 of nuys ing homes and Yelated facilities,including chronic disease and geriat ric hospitals and all types of homes for the aged.An estimated 17,100 institutionsweYe classified according to the pyi mary and predominanttype of service provided. On this basis about 46percent weYe classified as nursing cave homes and 29 percent as per sonal-care-with-nursinghomes (personal caYe was the primaryserv ice, but some nursing caye was provided). Only 4 percent were longstay hospitals OY hospital units for the cave of the aged and chronicallyill. The remaining 21 percent were homes which routinely providedpersonal care but not nursing cave.About two-thirdsof the institutionsreportedthat their policy was toadmit bedfast patients. Almost all of the nursing care homes and “hos pitals” had such a policy. This is consistent with the findings that thevast majority of the nursing caye homes ana’ “hospitals” employed anuxse of some type to supervise nursing caye and provided nursingservice 24 hours a day.The average charge most frequentlymade by institutions for the aged(excluding hospitals) was 170 per resident per month. This was thecharge made directlyby the institutionforlodging, meals, nursingcare, and other personal services. The average most frequent chargecare homes to 206 perranged from 117 per month for personalmonth for nursing care homes.SYMBOLSData not available--CategoryQuantity- -not applicable-----------------zeroQuantity more than 0 but less than 0.05----Figure does not meet standards ofreliabilityor precision---------------------.0.0*
INSTITUTIONS FOR THE AGEDAND CHRONICALLY ILLE. Earl Bryant,DivisionINTRODUCTIONBackgroundThe data presented in this report are basedon the first of the institutionalpopulationsurveysbeing conducted by the Division of Health RecordsStatistics of the National Center for Health Statis tics. The InstitutionalPopulation Survey is partof the National Health Survey program to providecurrent health statisticson the Nation’s popu lation. In other parts of the program, statisticsare collected about the noninstitutionalpopulationfrom personal interviews, physical examinations,and hospital records. A detailed descriptionofthe National Health Survey programhas beenpublished.*as used in the In The term “institution,”stitutionalPopulation Survey, refers to all groupquartersin which residents,patients, or inmates are domiciledfor the purpose of med nursing,personal,or cus ical, psychiatric,todial care. Included, for example, are longterm hospitals,nursing homes, homes for theaged, homes for incurables,homes for theblind or deaf, homes for crippled or depend ent children,detention homes for juvenile de linquents, reformatories,and penitentiaries.The list illustratesthe heterogeneityofthe institutionalpopulation.One would expectresidentsof certaintypes of institutionstobe well, in general, having health character isticsnot unlike those of the noninstitutional‘National Center for Health Statistics:Origin, program, and op eration of the U.S. National Health Survey. Vi&Z and Health Sta lk-tics.PHS Pub. No. 1000 Series l-No. 1. Public Healtb Service.Washington.U.S. Government Printing Office, Aug. 1963.of Health tiecordsStatisticspopulation. Contrastingly,many of the residentsof other types of institutionsare very ill, im mobile,senile,etc. In some types of insti tutions the best source of health data is thesample person; in other types it is a proxysuch as a nurse or an adminis respondent,trator; still in others the best data source isrecords.Because of this diversityamong thepopulationgroups, the InstitutionalPopulationSurvey is being conducted in a series of adhoc surveys covering differenttypes of insti tutions or classes of the population. This pro cedure makes it feasible to collect statisticswhich have a special meaning for a particularsegment of the population;it also enables thecollectionof informationwhich has a similarmeaning for all classes of the population.The survey on which this report is basedwas conducted during April-June1963. Includedin the survey were all types of resident placeswhich provide nursing, personal, or domiciliarycare to the aged or chronicallyand mentallyill.For conveniencethe survey is referredto as the “Resident Places Survey-l,”or RPS-1.This report,which presents statisticsonsuch characteristicsof institutionsfor the agedas admissionpolicy, type of service,size ofinstitution,type of ownership,and geographicregion, is the first of a series to be publishedon the findings of the RPS-1. A second reportdeals with the characteristicsof residents inthese institutions.*2 NationalCenter for Health Statistics:Characteristicsof res idents in institutionsfor the aged and chronicallyill.Vital andHenlth Statistics.PHS Pub. No. 1000 Series 12-No. 2. PublicHealth Service.Washington.U.S. Government Printing Office.1
GeneralSurveyDesignandQualificationsThe scope of the RPS-1 included all res ident institutionsin the United States whichprovidecare to the aged or chronicallyandmentally ill. This includes nursing homes, con valescent homes, rest homes, and other similartypes of places with 3 or more beds; nurs ing home units and chronic disease wards ofgeneral hospitals;chronic disease and geriat ric hospitals; and psychiatrichospitals. Homesfor the aged which did not routinelyprovidesome level of personalcare, i.e., providedonly room and board, were not within the scopeof the survey. The chronic disease wards andpossibly some of the nursing home units areusually not considered as institutionsbut asintegralparts of short-stayhospitals.Theywere included in this survey because of thetype of care provided.The samplingframe for the survey wasthe Master FacilityInventory (MFI), which isdiscussedin Appendix I. A detailed descrip tion of its development and content as well asa procedurefor evaluating its coverage hasbeen published.3It should be emphasized thatthe data in this report can be no more rep resentativeof the establishmentsin the UnitedStates than the universe from which the samplewas selected.Accordingto preliminaryresearch to evaluate the coverage of the MFI,the sampling frame for the RPS-I may havebeen no more than 85-90 percent complete.This should be remembered when interpretingthe data.The survey was based on a probabilitysample of 172 mental hospitals and 3,176 nonmental facilitieswhich were found to be inbusiness and in-scope at the time of the sur vey. With the exception of establishmentswith300 or more beds the survey was conductedby mail.Personalvisitswere made to thelarger homes and “hospitals” to select a sam-3National Center for Health Statistics:Developmentand main tenance of a national inventory of hospitals and institutions.Vitaland HeaZth Statistics.PHS Pub. No. 1000 Series I-No. 3. PublicHealth Service. Washington. U.S. Government Printing Office, Feb.1965.2ple of patients or residentsand to aid in thecompletionof the questionnaires.Health andrelated informationabout residents in the sam ple as well as certain informationabout theinstitutionswas collected.The data presentedin this report are based on that collected aboutnonmental institutions.Details about the sam ple design and survey procedures are describedin Appendix I of this report.A facsimileofthe questionnaireused in the survey is shownin Appendix III.Since the estimates derived from the sur vey are based on a sample rather than onall establishmentsin the United States, theestimatesare subject to sampling variability.The sampling errors for most of the estimatesshown in the report are relativelysmall; however, caution should be taken in interpretationwhen estimatesare based on small numbers.Tables of approximatesamplingerrorsandillustrationson the use of the tables are givenin Appendix I.Definitionsof certain terms used in thisreport may be found in Appendix II-A. To prop erly interpretthe data, the reader should become familiarwith the definitions.Specialattention is called to the procedure for clas sifying institutions,which is described in Ap pendix II-B.The classificationof homes forthe aged, i.e., nursinghomes, rest homes,and related types of places, is based on thetype of service provided in the home ratherthan on state licensure laws or what the homemay be called.The data used for classifying homes for theaged in this report were collected primarilyduring April-June1962 in a survey of all es tablishmentslisted in the Master Facility In ventory. Thus, there was a time intervalofabouta year between the MFI Survey and the RPS-1.During this l-year interval the type of serviceprobablychanged for some of the establish ments: a nursinghome may have convertedto personalcare only and vice versa. However, because of the relativelyshort time pe riod between the two surveys any changes whichmay have occurredshould not have a largeeffect on the statisticspresented in this report.
CHARACTERISTICSOFand nursing home units of general hospitals.For convenience these facilities will be re ferred to as “hospitals.” The remaining 16,370to in thisestablishments, often referredreport as “homes for the aged,” include 7,834nursing care homes (the primary and predominant service is nursing care), 4,968 per sonal-care-with-nursing homes (the primary andpredominant service is personal care, but somenursing care is provided), and 3,568 personalcare homes. The procedure for classifying in stitutions is described in Appendix II-B.Most of the institutions were privately owned(table A). This was true for each type of in stitution except “hospitals,” where only 16 percent were under proprietary control. The mostfrequent operator of “hospitals” was govern ment (Federal, State, city, or county), whichcontrolled 38 percent of the “hospitals.” Theremaining 62 percent was about equally di vided among proprietary,church, and othernonprofit organizations.As shown in table 4, most of the insti tutions were quite small. Almost two-thirdsof them maintained less than 30 beds. Onlyabout 6 percent of the places had 100 or morebeds.The estimated average size for all typesof institutions for the aged was about 39 beds.As shown in table B, the average size var ied considerably by type of service and typeof ownership. Privately owned institutions weremuch smaller than nonprofit institutions forINSTITUTIONSThis report describes characteristics ofan estimated 17,098 institutions in the UnitedStates which provide nursing or personal careto the aged and chronically ill in terms oftheir admission policies, type of nurse in charge ofnursing care, whether or not round-the-clocknursing service is provided, and the amountcharged for the care of residents. The in stitutions are classified according to the pri mary type of service provided as well as bysize of institution, type of ownership, and thegeographic region in which they are located.In this analysis the major findings of the sur vey and the more important relationships whichseem apparent from the data are discussed.More detailed information about the establish ments is given in tables 1-13, which followthe text of the report.TypeofService,andRegion,Ownership,SizeTable 1 shows how the institutions aredistributed by type of service, geographic re gion, and type of ownership. Table 4 showshow they are distributed by size. The 17,098institutions are classified in four type-ofservice categories; 728 are hospitals or hos pital units consisting of geriatric and chronicdisease hospitals and chronic disease wardsTable A. Percent distributionof institutionsfor the aged, by primary type of serviceand type of ownership:United States, April-June1963Type of ownershipPrimary type of serviceNumber care------------Personal carewith nursing-----------Personal care-----------Hospital care-----------Nursingno :z&tG 28100100100ii16i24:38132533
.-each type of service, and nonprofit were con sistentlysmallerthan the government-ownedinstitutions.A largerproportionof the Nation’s in stitutionsfor the aged were located in theNorth Central Region (36 percent) than in anyother region (table 1). The next largest proportionwas observed for the Northeast (28percent),followedby the South (22 percent)and the West (15 percent).In general, thispattern exists for each type-of-service,ownership group.Relative to the population 65 years of ageand over, by region, there were as many in stitutions for the aged in the West as the Northeast (1.0 per 1,000 population 65 years andover). The lowest proportion was observed forthe South (0.8 per 1,000 population 65 yearsand over); the highest, for the North CentralRegion (1.2 per 1,000 population 65 years andover). In terms of beds maintained in the in stitutions,the South had only 29 beds per 1,000population65 years and over compared withratios of 42, 44, and 46 per 1,000 population65 years and over for the West, Northeast,and North Central Regions, respectively.The distributionsof institutionswithin re gions by type of service are somewhat dif ferent for the various regions. For example,the proportionof all institutionsin a regionthat are nursing care homes ranges from 42percent for the North CentralRegion to 52Table B.percent for the Northeast.The pattern is reversed for personal-care-with-nursinghomes:the highest proportionwas observed for theNorth Central Region; the lowest, for the Northeast. When nursingcare and personal-carewith-nursinghomes are combined, however, theratio of homes providing nursing care to totalinstitutionsis about the same for each region.Nearly half of all church-operatedinstitutionswere located in the North Central Region; bytype of servicethe proportionranged from45 percent for personal-care-with-nursinghomesto 60 percent for “hospitals.”TypeofNurseinChargeofNursingCareIn the RPS-1 the respondentwas asked,“DO you providenursingcare to the resi dents in your establishment?”If the answerwas “yes ,1’ he was asked, “Who is in chargeof nursing care?" and was instructed to in dicate the type of nurse in charge and wheth er or not she worked full- or part-time.Hewas also asked, “Is there at least one nurseor nurse’s aide on duty 24 hours a day?” (Thisquestion is discussed in the next section ofthis report,)If the respondent’s answer to thequestion regardingnursing care was “no,” hewas instructed to skip the questions concerning24 hours’ nursing service and the supervisionof nursing care.Average size of institutionsforof service and type of ownership:the aged (number of beds),United States, April-Juneby primary1963typeType of ownershipPrimarytype of serviceAlltypesNonprofit(ion;t ngProprietaryGovernmentAverage number of ’712;;types---------------------care withnursing----------
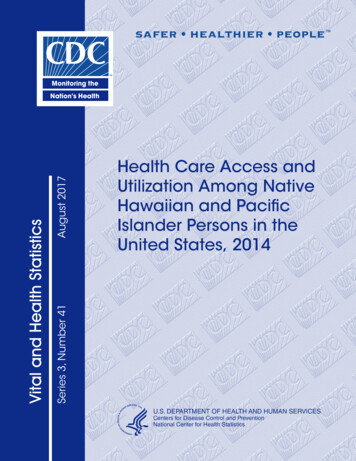
It should be realized that the question con cerning the provision of nursing care was askedas a screening question only and was not usedto classifyinstitutions.As in other parts ofthe report the classificationof institutionsbytype of service is based on detailed informa tion collected in surveys of all establishmentsin the MasterFacilityInventory.The clas sificationprocedureis described in AppendixII-B. Tables 2-4 show how the institutionsaredistributedaccording to the type of nurse incharge of nursingcare, by primarytype ofservice,type of ownership, size of institution,and geographic region.About two-fifthsof all establishmentsem ployed a full-timeregistered professional nurse(RN) to supervise nursing care (table 2). Parttime RN’s were the supervisorsin a tenthof the institutions,while the supervisorwasa full-timelicensed practicalnurse (LPN) ina fifth of the places. Approximately30 percent of the homes for the aged and 3 percentof the “hospitals”did not have a nurse ofany type in charge of nursing care. The ma jority of the homes without a nurse in chargeof nursingcare were personalcare homeswhich did not provide nursing care.Almost all of the nursing care homes hada nurse of some level of skill in charge ofnursing care. In 55 percent of the homes theperson was a full-timeRN, and in 28 percent she was a full-timeLPN. About twothirds of the personal-care-with-nursinghomesemployed a nurse of. some type to supervisenursing care. Of such places having nurse su pervisors,about 40 percent of them employedfull-timeRN’s, and 35 percent employed fulltime LPN’s.The remaining25 percent usedpart-time RN’s and LPN’s.Full-timeRN’s were in charge of nursingcare in a third of proprietarynursing and per sonal care homes comparedwith about halfof the homes operated by government and nonprofit organizations.The proportions differ sub stantiallybetween the varioustype-of-serv ice classes. About half of the proprietarynurs ing care homes, compared with two-thirdsofthose operated by nonprofitorganizationsand85 percent of government nursing care homes,employedfull-timeRN supervisors.Proprie tary nursing care homes, however, utilized parttime RN’s and full-timeLPN’s more frequent ly than did homes of other types of ownership. Nonprofithomes used full-timeLPN’smore frequentlythan did governmenthomes.If all levelsof nursing skill are combined,there is not much difference by type of ownership in the proportionof nursing care homeswith a nurse in charge of nursing care.For personal-care-with-nursinghomes abouthalf of those under nonprofitownership hada full-timeRN supervisor;this is nearly twicethe proportionfor the other types of ownership. Only 22 percent of these nonprofit homeswere without a nurse supervisorof some type;this is about half the proportion for other ownership types.Consideringthe proportionof establish ments with a nurse of some type to supervise nursingcare, there are no differencesin the proportionsfor personal care homesby ownership and very little for “hospitals.”About 25 percent of the personal care homesfor each type of ownership employed a nurse,either full- or part-time,to supervisenurs ing care. Almost all of the “hospitals,”re gardlessof type of ownership,had a nursein charge of nursing care, the vast majorityof which were full-timeRN’s.As shown in table 4, RN’s were moreoften in charge of nursing care in large thanin small homes. This is illustratedin figure 1,which shows that the proportionof homes em ploying full-timeRN supervisorsincreasesconsistentlyas the size of the home increasesfor both nursingcare homes and personalcare-with-nursinghomes. This pattern does notprevail for “hospitals,”however; the proportionis approximatelythe same for all “hospitals”regardless of size.The low proportionof full-timeRN’s insmall homes is partiallycompensated by rel ativelyhigh proportionsof LPN’sand parttime RN’s. This is especiallynoticeablefornursing care homes: about half of those withless than 30 beds, compared with only 8 per-5
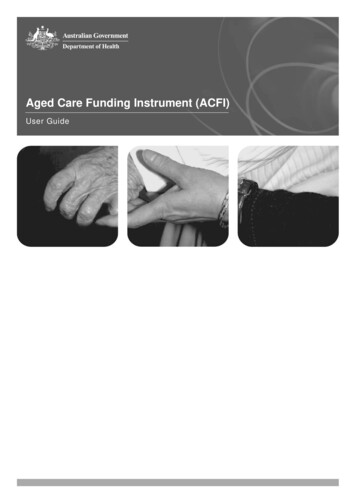
The only notable difference for “hospitals” byregion was observed for the North CentralRegion, where only 83 percent had a full-timeRN supervisor.This compares with 94 percent or greater for “hospitals”in other re gions. About 16 percent of the “hospitals” inthe North Central Region, compared with lessthan 2 percent in the other regions, used parttime RN supervisors.Personal care with nursingNursingcareTYPEOF NURSEIN CHARGEmOF NURSINGCARE:RN full-timeRN part-timeLPNUnder 30beds30 - 49bedsSIZEOF50-99bedsHOMEFigureI.Percentof homes with a full-timein charge ofnursingcare,by primarytypeserviceand size of home.RNofcent of those with 100 or more beds, em ployed either a part-timeRN or a full-timeLPN.Table 3 shows how the institutionsaredistributedby type of nurse in charge of nurs ing care according to primarytype of serv ice and region. There is a noticeable differencebetween the proportionof nursing care homesin the West and those of other regions whichemployed full-timeRN’s to supervisenurs ing care. About three-fourthsof the nursingcare homes in the West had a full-timeRNin charge of nursing care; this compares withless than half of the homes in the South andNorth CentralRegions and two-thirdsof thehomes in the Northeast(fig. 2). Nursingcare homes in the other regions used parttime RN’s as well as full- and part-timeLPN’smore often than did homes in the West. Con sequently,there is not much differencebyregion in the proportionof homes which didnot have a nurse supervisorof some type.6full-timeloo 00HOMESPercentdistributionofNursingCareFigure 2.by type of nurse in chargeof nursingHomes,care accordingto region.
Round-the-ClockNursingServiceThe respondents in the survey were asked,“Are there one or more nurses or nurse’saides ON DUTY 24 hours a day?” On the basisof answersto this question it is estimatedthat about 78 percent of the institutionshada nurse or nurse’s aide on duty 24 hours aday (tables 2-4).The proportionvaries up or down depend ing on the type of serviceprovided in theAlmostall of the places clas institutions.and nursing care homessified as “hospitals”provided round-the-clocknursing service. Aboutfour-fifthsof the personal-care-with-nursinghomes and a third of the personal care homeshad a nurse or nurse’saide on duty at alltimes.As shown in table 2, within a type-ofserviceclass there is little,if any, vari ation in the proportionof institutionsprovid ing round-the-clocknursing service,by typeof ownership. The only exception was observedfor personal-care-with-nursinghomes. Only twothirds of the governmenthomes had a nurseor nurse’saide on duty at all times, whilethree-fourthsof the proprietaryhomes and al most 90 percent of the nonprofithomes pro vided round-the-clockcare. The reason for thisdifferenceis not clear. Possibly the level ofnursing care required in the government homesis lower than in the homes of other ownerships. The governmentpersonal-care-with-nurs ing homes are almost entirely city-countyop erated; this may or may not be a clue.Except for “hospitals”and nursing carehomes the provisionof round-the-clocknurs ing service is related to the size of the homes(table 4). For personal-care-with-nursinghomes,for example, the proportion increases with eachsize group, ranging from 73 percent for homeswith less than 30 beds to 98 percent for homeswith 100 or more beds. This same patternwas observedfor personalcare homes, butthe proportionis lower for each size groupthan for correspondingsizes of personal-carewith-nursinghomes.There is almost no variation between re gions in the proportionof institutionsprovid ing round-the-clocknursingservice (table 3).The only differencefor any type of institu tion was observed for personal care homes.In the NortheastRegion only 19 percent ofthe homes had a nurse on duty 24 hours awith proportionsday; this is in comparisonranging from 34 to 45 percent for the otherregions.AdmissionPolicyTables 5-10 show how the institutionsaredistributedaccording to certain admission pol icies. The findings of their stated policies re gardingadmissionof men and women, bedmentallyill patients,recipientsfast patients,of public assistanceor welfare,age limita of a physicalex tions, and requirementamination before (or soon after) admission arediscussed in this section.Sex. -Most institutions accepted both men andwomen. However, when there was a limitationbecause of sex, it was usually to accept onlywomen. Ninety-sevenpercent of the “hospitals”and 89 percent of the nursing care homes ac cepted both sexes compared with 82 percentof the personal-care-with-nursinghomes and66 percentof the personalcare homes. Ofthe places accepting only one sex, the ratiowas at least 4 to 1 in favor of homes for wom en for each type of institutionexcept “hos ad pitals.” Three percent of the “hospitals”mittedonly males, while less than one percent admitted only females.The admission policy regarding sex is ap parently more related to the size of the homesthan to other factors in this analysis. As shownin table 9, except for “hospitals”the proportion of places accepting both sexes for eachtype of service is lowest for institutionswithless than 30 beds. For places with 30 ormore beds the proportionsare of similar sizefor each type of institution.The lowest proportion was observed for personal care homeswith less than 30 beds: only 63 percent ofthese homes accepted residents of both sexes.Admission policy regarding the sex of res idents appears to be influenced by type of ownership also. For each of the three types of nurs ing and personal care homes the lowest proportionof homes acceptingboth sexes was7
observed for nonprofit homes, followed by pro prietary and government homes (table 7). Nearlyhalf of the nonprofit personal care homes anda third of the proprietaryhomes were re strictedto one sex; this compares with only2 percent of the government homes.In general,the patterns for each regionare similarto those for the United States asa whole (table 5). One exception is interest ing, however: there are as many personal carehomes in the West Region for men as thereare for women-about16 percent of the totalhomes for either sex. The proportion of per sonal care homes restrictingadmissionsbysex is about the same for each region, butthe vast majorityof these homes in the otherthree regions are for women.Bedfast patients. -Bedfastpatients were ac cepted by about two-thirdsof the institutions.The proportionvariesappreciablydependingon the type of institution.Over 90 percentof the “hospitals” and nursing care homes ac cepted bedfast patients.This compares with63 percent of the personal-care-with-nursinghomes and 18 percentof the personal carehomes (table C).One might question why bedfast patientsare not accepted by all “hospitals” and nurs ing care homes or why they are accepted bypersonalcare homes which do not routinelyprovide nursing care. There are several pos TableC. Percent of institutionstype of serviceand typesible explanations.Probablythe best one isbased on the procedurefor classifyinges tablis hments. The criteriafor classifyingin stitutions for the aged (except “hospitals”)arebased on the type of serviceprovided,asreported by the institutionsthemselves, rath er than on the availabilityof facilitiesto provide service.Accordingto informationcol lected in this survey,about a third of theplaces classifiedas personal care homes hada nurse or nurse’s aide on duty 24 hours aday. Thus, some of these homes would prob ably accept bedfast patients.Another expla nation also relates to the classificationof es tablishments.The data used in classifying placeswere collectedin a MasterFacilityInven tory survey about a year prior to the RPS-1.Consequ
aged, homes for incurables, homes for the blind or deaf, homes for crippled or depend ent children, detention homes for juvenile de linquents, reformatories, and penitentiaries. The list illustrates the heterogeneity of the institutional population. One w