Transcription
Journal of Economic Perspectives—Volume 28, Number 3—Summer 2014—Pages 3–24The Role of Entrepreneurship in US JobCreation and Economic Dynamism†Ryan Decker, John Haltiwanger, Ron Jarmin, andJavier MirandaThe United States has long been viewed as having among the world’s mostentrepreneurial, dynamic, and flexible economies. It is often argued thatthis dynamism and flexibility has enabled the US economy to adapt tochanging economic circumstances and recover from recessions in a robust manner.While the evidence provides broad support for this view, the outcomes of entrepreneurship are more heterogeneous than commonly appreciated and appear to beevolving in ways that could raise concern. Evidence along a number of dimensionsand a variety of sources points to a US economy that is becoming less dynamic. Ofparticular interest are declining business startup rates and the resulting diminishedrole for dynamic young businesses in the economy.We begin by describing how the concept of entrepreneurship is reflectedin existing data on firm age and size. The recent addition of firm age to officialstatistics represents a dramatic improvement in the information available to entrepreneurship researchers. We then turn to a discussion of the role of startup firmsin job creation. Business startups account for about 20 percent of US gross (total)job creation while high-growth businesses (which are disproportionately young) Ryan Decker is a PhD student in Economics, University of Maryland, College Park, Maryland.John Haltiwanger is the Dudley and Louisa Dillard Professor of Economics and DistinguishedUniversity Professor, University of Maryland, College Park, Maryland, and also a ResearchAssociate, National Bureau of Economic Research, Cambridge, Massachusetts. Ron Jarminis Assistant Director for Research and Methodology, US Census Bureau, Washington, DC.Javier Miranda is a Principal Economist, US Census Bureau, Washington, DC. The authors’email addresses are decker@econ.umd.edu, haltiwan@econ.umd.edu, ron.s.jarmin@census.gov, and Javier.miranda@census.gov. Haltiwanger is the corresponding author.†To access the data Appendix and disclosure statements, visithttp://dx.doi.org/10.1257/jep.28.3.3doi 10.1257/jep.28.3.3
4Journal of Economic Perspectivesaccount for almost 50 percent of gross job creation. Startups and young businessesare small, the underlying reason many commentators described small businesses asthe engine of US job growth prior to availability of data by firm age (for summaries,see Haltiwanger, Jarmin, and Miranda 2013; Haltiwanger 2012).The contribution of startups and young businesses to job creation involves richdynamics. Most business startups exit within their first ten years, and most survivingyoung businesses do not grow but remain small. However, a small fraction of youngfirms exhibit very high growth and contribute substantially to job creation. Thesehigh-growth firms make up for nearly all the job losses associated with shrinking andexiting firms within their cohort. The implication is that each entering cohort ofstartups makes a long-lasting contribution to net job creation.The contribution of startups and young firms to job creation is part of an overallrapid pace of reallocation of productive resources across firms in the US economy.Young firms exhibit rich post-entry dynamics: specifically, low-productivity youngfirms contract and exit, while high-productivity young firms rapidly expand. Inaddition, young firms appear to play a critical role in innovative activity that alsocontributes to productivity growth (including within-firm productivity growth).An optimal pace of business dynamics—encompassing the processes of entry,exit, expansion, and contraction—would balance the benefits of productivity andeconomic growth against the costs to firms and workers associated with reallocationof productive resources. It is difficult to prescribe what the optimal pace shouldbe, but evidence accumulating from multiple datasets and methodologies suggeststhat the rate of business startups and the pace of employment dynamism in theUS economy has fallen over recent decades and that this downward trend accelerated after 2000 (Haltiwanger, Jarmin, and Miranda 2011; Reedy and Litan 2011).A critical factor in accounting for the decline in business dynamics is a lower rateof business startups and the related decreasing role of dynamic young businesses inthe economy. For example, the share of US employment accounted for by youngfirms has declined by almost 30 percent over the last 30 years.These trends suggest that incentives for entrepreneurs to start new firms in theUnited States have diminished over time. We do not identify all the factors underlying these trends in this paper but offer some clues based on the empirical patternsfor specific sectors and geographic regions. We conclude with reflections on riperesearch topics in this area.Measuring EntrepreneurshipMeasuring entrepreneurship and its economic effects is difficult. Availablegovernment data on US firms do not have a specific entry for “entrepreneurs.”These data have traditionally contained information about the size of firms, andthus some observers have written or spoken as if small businesses are synonymouswith entrepreneurs. However, we believe entrepreneurial activity is better represented by new businesses—that is, by age rather than by size. Indeed, using recently
Ryan Decker, John Haltiwanger, Ron Jarmin, and Javier Miranda5available data with information on both firm size and firm age, Haltiwanger, Jarmin,and Miranda (2013) show that most of the job-creating prowess of small businessesis due to the contribution of startups and young businesses, which are also small atthat stage in their lifecycle, as we discuss in the next section.When thinking about “new” businesses, the distinction between new firms andnew establishments is critical. Many US firms operate multiple establishments (thatis, specific locations of business activity). New establishments of existing firms cantake many forms, including simply replacing outdated existing establishments, thusnew establishments often do not conform to standard notions of entrepreneurialbehavior. For this reason, entrepreneurial research should focus on startups andyoung firms. It should exclude “new” businesses emerging from reorganizationssuch as mergers and acquisitions.The Business Dynamics Statistics and the Longitudinal Business Databasemaintained by the US Census Bureau track the universe of employer firms—thatis, firms in the private, nonagricultural sector with at least one employee.1 TheLongitudinal Business Database includes annual observations beginning in 1976and currently runs through 2011. It provides information on detailed industry,location, and employment for every establishment in the private sector in anationally comprehensive and integrated manner. With these data, it is possibleto distinguish between true “startups,” new establishments of existing businesses,and “new” firms formed by combining pre-existing establishments throughmerger and acquisition activity. The Longitudinal Business Database identifiesthe relationship between firms and establishments both cross-sectionally and overtime. Thus, researchers can link establishment and firm information, computecharacteristics such as firm size and firm age from the establishment information,and track patterns over time.However, even within the category of startups, we should expect to find varioustypes of entrepreneurs. Schoar (2010) argues for distinguishing between “subsistence” entrepreneurs and “transformational” entrepreneurs. Her distinction wasintended primarily for emerging economies where many entrepreneurs have limitedprospects for growth, but we think this distinction is useful for the US economy aswell. Subsistence entrepreneurs can be thought of as those that create small businesses that provide employment for the entrepreneur and perhaps a few others(often family members), which do not usually grow. For example, Hurst and Pugsley(2011) find that many young and small business owners in the US economy statethey do not have aspirations for high growth, but rather often started businessesfor nonpecuniary reasons like time flexibility or personal goals. Transformational1The Business Dynamic Statistics are recently available public domain data derived from the Longitudinal Business Database, and can be found at http://www.census.gov/ces/dataproducts/bds/. A fullerdescription of these data and the measures we use are provided in the online Appendix available withthis paper at http://e-jep.org. We note that the Longitudinal Business Database employment and jobcreation numbers track closely those of the County Business Patterns and Statistics of US Businessprograms of the US Census Bureau (Haltiwanger, Jarmin, and Miranda 2009), as they all share theCensus Bureau’s Business Register as their source data.
6Journal of Economic Perspectivesentrepreneurs, on the other hand, create small startup businesses with the intention to innovate and grow, thus creating employment for other workers and valueadded for the economy. Clearly, only a subset of these transformational entrepreneurs are likely to succeed in the marketplace and grow. When people discuss theimportance of entrepreneurs in job creation and productivity growth, they areenvisioning transformational entrepreneurs, not subsistence entrepreneurs.Other useful sources of data on startups include the Business EmploymentDynamics from the US Bureau of Labor Statistics, which is a rich source of quarterlyinformation on job creation and destruction. These data are more timely than theCensus data but are less useful for studying firm size and firm age effects becausefirms are defined based on all activity operating under a single Employer Identification Number. However, many large multi-establishment firms have multipleEmployer Identification Numbers. By contrast the Census Bureau uses survey andadministrative data to create an enterprise-wide representation of all the establishments in the US economy that are under common ownership and control. Otherimportant sources of data describing firm dynamics for the US economy includeCOMPUSTAT (which tracks publicly traded firms), the National EstablishmentTime Series (based on Dun and Bradstreet data), and the Kauffman Survey trackinga sample of recent entrants.Startups and US JobsStartups and young businesses clearly play an important role in job creation.Between 1980 and 2010, the gross number of jobs created annually by all establishments averaged about 18 percent of the workforce—an average of 16.3 millionjobs per year—according to our calculations from the Business Dynamics Statistics.About one-sixth of this amount, an average of 2.9 million jobs annually, can betraced to new firms, and another one-sixth can be traced to new establishments ofexisting firms. The net job creation statistics are even more striking. For new firms(that is, those with age equal to zero in the Business Dynamics Statistics), “net” and“gross” job creation are the same, because they have no previous jobs to lose, and sotheir net job creation is also 2.9 million jobs per year. Over these 30 years, averagenet job creation in the entire US private sector was approximately 1.4 million jobsper year. The implication is that cohorts of firms aged one year or older typicallyexhibit net job declines.Taken at face value, these statistics might be interpreted as implying that allnet job creation is due to startups. This interpretation is misleading for two reasons.First, gross job creation is an order of magnitude greater than net job creation in anygiven period. This implies that in any given period there are many different groupings of growing firms that could be used to account for net job creation. Second,it is important to examine the post-entry dynamics of startups. If, for example, allstartups failed after a short period of time, then startups would not be making anylong-lasting contribution to net job creation.
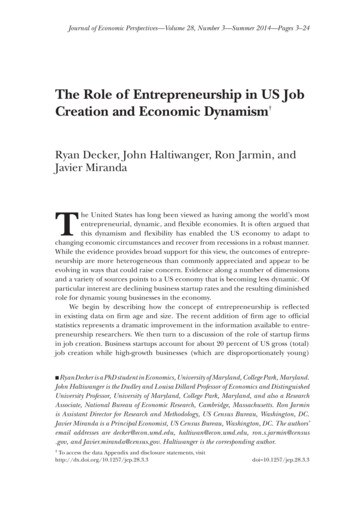
The Role of Entrepreneurship in US Job Creation and Economic Dynamism7Figure 1Up or Out Dynamics for Young Firms1816Job destruction from exiting firmsNet job creation of continuing firms14Percent121086420123456789Firm age10111213141516 Source: Annual averages of statistics computed from the Longitudinal Business Database from 1992–2011.Notes: Figure 1 shows patterns of net employment growth of continuing firms and job destruction fromfirm exit for firms age 1 and older. Startups have firm age equal to zero, so this figure reports on thepost-entry dynamics of firms. (See footnotes 2 and 3 and online Appendix for details.)To explore post-entry dynamics, we need to track firm growth and survivalas a function of firm age. We rely here on the methodology developed by Davis,Haltiwanger, Jarmin, and Miranda (2007) and Haltiwanger, Jarmin, and Miranda(2013). Firm age is measured using the age of the oldest establishment in the firm.For startups, all of the establishments of the new organization are entrants so firmage is zero. In this methodology, continuing firms age “naturally,” one year at a time,as long as the organization stays in existence.2 Consistent with this approach, firmexits represent legal entities that cease to exist and in which all of their associatedestablishments shut down. Thus, firm exits do not reflect legal entities that ceasethrough organizational change or buyout activity and where at least some establishments continue operation in subsequent years.Using this approach, Figure 1 shows patterns of net employment growth forcontinuing firms and job destruction from firm exits for firms age 1 and older.32As part of this same methodology for assigning firm age, Haltiwanger, Jarmin, and Miranda (2013)develop a method for capturing firm growth that focuses on organic growth rather than growth frommerger and acquisition activity and other related changes in organization. We use that methodologyhere, and explain it in more detail in the Appendix available with this paper at http://e-jep.org.3Reported statistics in this figure reflect the net employment growth for the cell using the growth ratemethodology developed by Davis, Haltiwanger, and Schuh (1996). The growth rate concept at any level
8Journal of Economic PerspectivesRecall that startups have firm age equal to zero, and so Figure 1 provides insights onthe post-entry dynamics of firms. The statistics are based on tabulations of pooleddata from 1992–2011 from the Longitudinal Business Database. Conditional onsurvival, younger firms have much higher rates of job growth than more maturefirms. Indeed, even the typical 10 year-old firm has net growth that is 1.4 percentagepoints higher than the typical 16 year-old firm. The exit dynamics look different aswell. Young firms have a substantially higher exit rate (job destruction from exit isan employment-weighted exit rate): 50 percent of the jobs generated by an enteringcohort of firms will have been lost to exits by age five.Thus, young firms exhibit a strong “up or out” dynamic (Haltiwanger, Jarmin,and Miranda 2013). For any given cohort, jobs lost due to the high failure rate ofyoung firms are almost offset by the growth of the surviving firms. Five years afterthe entry of a typical cohort, total employment is about 80 percent of the originalemployment contribution of the cohort—in spite of losing about 50 percent of theoriginal employment to business exits. In this sense, cohorts of startups do make along-lasting contribution to net job creation. But the high volatility of young firmshighlights that the contribution to net job creation from startups can’t be simplyunderstood from the immediate contribution upon starting up.The high mean net employment growth of surviving young firms masks enormous heterogeneity among young surviving firms. Figure 2A shows the 90th, 50th,and 10th percentiles net job growth of surviving firms by firm age. Figure 2B showsthe mean and median of net employment growth of surviving firms by firm age. Themean is the aggregate net growth rate for each age group. The 90th, 10th, and medianare the employment-weighted percentiles, so they reflect the employment-weighteddistribution underlying the aggregate mean. Young firms have very high dispersion ofgrowth and also very high skewness. The skewness is seen in the relative magnitudesof the 90th and 10th percentiles where the growth rates of younger firms are muchmore skewed to the right (positive) compared to more mature firms. This accounts forthe high mean growth rate of young firms relative to older firms that is evident in thelower panel of Figure 2. In short, the typical young firm (as captured by the median)exhibits little or no growth even conditional on survival (many of these are presumably the “subsistence” entrepreneurs discussed earlier), however, among all the youngfirms, a few do exhibit very high rates of growth which yields a high mean growth rate.The skewed right tail of the growth rate distribution of young firms is importantfor understanding the contribution of startups and young firms to overall job creation.Startups account for less than 10 percent of firms and about 20 percent of firm-levelgross job creation. But the contribution of startups to job creation does not stop atentry, at least for some firms. High-growth firms—defined here as firms expandingof aggregation is based on the change in the number of jobs for a cell from period t 1 to t divided bythe average number of jobs in periods t 1 and t. This growth rate measure was developed originallyby Törnqvist, Vartia, and Vartia (1985). Like log changes, this growth rate measure is symmetric but ithas the advantage of accommodating zeroes (entry and exit). It is a second order Taylor approximationto the log first difference. See the online Appendix with this paper at http://e-jep.org for more details.
Ryan Decker, John Haltiwanger, Ron Jarmin, and Javier Miranda9Figure 2Net Employment Growth and Growth Rates for Surviving FirmsA: 90th, Median, and 10th Percentiles of Net Employment Growth for Surviving Firms100MedianGrowth rate (percent)8090th percentile10 percentile6040200 20 40 6012345678910111213141516 Firm ageB: Mean and Median Net Employment Growth Rates for Surviving Firms16Growth rate 516 Firm ageNotes: Annual averages of statistics computed from Longitudinal Business Database, from 1992–2011.The 90th, 10th, and median are all based on the employment-weighed firm level growth rate distributionfor each firm age cell. The mean is the aggregate net growth rate of the firm age cell which is equivalentto the employment-weighted average of the firm level net growth rate in each cell.their employment by more than 25 percent per year—account for about 15 percentof firms and 50 percent of firm-level gross job creation. Together, startups andhigh-growth firms (which are disproportionately young as seen in Figure 2) accountfor about 70 percent of firm-level gross job creation in a typical year. Balancing thispositive contribution is the sharp job loss that occurs for many firms in the first several
10Journal of Economic PerspectivesTable 1Estimates of Net Growth for Continuing Firms by Firm Size and Firm Age(in percent)Firm size (number of employees)Firm �1516 All ages6.72.0 0.5 2.0 3.7 2.1 0.8 2.40.29.02.5 0.2 1.2 2.4 0.90.0 1.71.210–1920–4950–9911.54.41.80.8 0.20.93.0 0.91.712.95.62.92.10.92.43.5 0.12.114.97.44.63.72.53.84.40.62.5100– 249250– 499500 All 2.41.81.91.80.7Notes: Tabulations from the US Census Bureau. Details of methodology and results can be found in theonline appendix of Haltiwanger, Jarmin, and Miranda (2013). The analysis covers the period 1992–2005.years after startup entry. Overall, the evidence shows that most startups fail, andmost that do survive do not grow. But among the surviving startups are high-growthfirms that contribute disproportionately to job growth. These high-growth youngfirms yield the long-lasting contribution of startups to net job creation.To understand the population of startups and their dynamics, it helps torealize that their size distribution is quite different from that of the overall distribution of firms. Startups are small; more than 90 percent of all startups have fewerthan 20 employees, and these small startups account for about half of all startupemployment. For purposes of comparison, about 50 percent of employment in theUS private sector is accounted for by the less than 1 percent of US firms with morethan 500 employees. Large startups are almost nonexistent and account for a verysmall share of startup activity; however, many small firms are old, accounting for about30 percent of employment. This image is enriched by examining the average netemployment growth rate by firm age and firm size class in Table 1. Table 1 focuseson continuing firms, to help link back to the evidence in Figure 1 regarding the highaverage net growth rate for young surviving firms. Average net job growth falls monotonically with firm age for all firm size groups. However, the average net growth foryoung firms is substantially higher for firms that are larger than 20 employees. Suchpatterns highlight that rapid employment growth among young surviving firms isespecially present among larger—or at least not micro-sized—young firms.Startups, Reallocation, and ProductivityThe high pace of labor market reallocation with a critical role for startupsand young firms raises a question: What is driving this reallocation? Considerable
The Role of Entrepreneurship in US Job Creation and Economic Dynamism11evidence suggests that entry, exit, expansion, and contraction of firms are closelyrelated to measures of productivity and profitability (for surveys and summaries, seeSyverson 2011; Foster, Haltiwanger, and Krizan 2001; Bartelsman and Doms 2000).Producers, even those within the same industry, display enormous differencesin measured productivity and profitability. For example, within the same four-digitUS manufacturing industry, the establishment at the 90th percentile of the productivity distribution produces almost twice as much output (measured by real revenue)with the same measured inputs as the 10th percentile establishment (Syverson 2004,2011). These large differences are persistent, but not permanent, indicating thatfirms are subject to ongoing idiosyncratic productivity and profitability shocks.These large differences in productivity and profitability are connected to thegrowth and survival dynamics of firms. As such, they underlie the reallocationdynamics we have discussed and documented above. For example, Foster, Grim,and Haltiwanger (2013) estimate, using data for the entire US manufacturing sectorfor the period 1980–2011, that the probability of exit for the establishment at the90th percentile of the productivity distribution within an industry is 4 percentagepoints lower than the establishment at the 10th percentile (the average annualexit rate for manufacturing establishments is 8 percent per year). Conditional onsurvival and holding initial size constant, estimates from the same data imply thatan establishment at the 90th percentile of productivity has a growth rate that is3 percentage points higher than a plant at the 10th percentile. Finally, estimatesfrom Syverson (2011) also show that entrants tend to start with productivity that ison average similar to incumbents. These estimated effects of productivity on growthand survival are very similar to those found in the literature. As stated in that paper:“[A] robust finding in the literature—virtually invariant to country, time period orindustry—is that higher productivity producers are more likely to survive than theirless efficient counterparts.”4When focusing on the relationship between reallocation of resources across theeconomy and firm-level measures of productivity, several issues arise. One issue is thatmuch of the micro empirical literature in this area focuses on establishment-levelrather than firm-level measures of productivity. Part of the reason for this focusreflects the complexity of measuring firm-level productivity for large, mature firmsoperating across several sectors. However, when the research looks just at establishments owned by young firms, as in Foster, Grim, and Haltiwanger (2013), themarginal effects of revenue-based measures of productivity on growth and survival(discussed above) are, if anything, larger. This is consistent with the up-and-outdynamics of young firms discussed earlier.Another issue is that much of the literature in this area measures total factorproductivity in terms of revenue. This choice is primarily due to data limitations asmost sources of firm- and establishment-level data that are used to measure productivity do not include micro level measures of output and input prices. Instead, real4We discuss the robustness of the findings in the literature further in section II of the online Appendixavailable with this paper at http://e-jep.org.
12Journal of Economic Perspectivesoutput and real inputs are measured as establishment- or firm-level revenues andcosts divided by a price deflator. Such revenue-based measures of productivity willthus reflect some combination of the technical efficiency with which inputs aretranslated into outputs, together with demand and cost effects on prices.Revenue-based measures of productivity may be a reasonable approximation for measures that adjust for price dispersion across producers. When Foster,Haltiwanger, and Syverson (2008) compare the revenue-based measures of totalfactor productivity with total factor productivity measured in physical quantities fora sample of manufacturing industries, they find that the correlation between thesetwo measures of productivity is .75, which suggests that broad findings in the literature based on measures of revenue productivity would hold up reasonably well withmeasures of productivity based on quantities.5 The industries for which physicalquantity data are available in the US economy are limited, so there is some questionas to the wider applicability of these findings across the whole economy. However,evidence for Colombia (where establishment-level price indices are available for allmanufacturing establishments) suggests these patterns are robust for a much widerrange of industries (Eslava, Haltiwanger, Kugler, and Kugler 2004, 2013).To be clear, productivity growth in an economy is not only a matter of moreproductive entering firms replacing less-productive exiting firms. A common findingin the literature about productivity growth in manufacturing is that about 60 percentof industry-level productivity growth happens within existing establishments andthe rest comes from reallocation of productive resources resulting from entry, exit,and the expansion and contraction of existing establishments. For example, Foster,Haltiwanger, and Syverson (2008) find that entrants and young establishments haveslightly higher total factor productivity (measured in quantity terms) than moremature incumbents, but the entrants have substantially higher productivity thanexiting establishments. In their data, 35 percent of industry-level productivity growthis accounted for by net entry. However, their study looks over a five-year time period,and thus some of the 60 percent of productivity growth happening within existingestablishments occurs in young firms. Foster, Haltiwanger, and Krizan (2001, 2006)provide evidence of such selection and learning dynamics and show that within-plantproductivity growth is more rapid for surviving young establishments than moremature establishments.6In sectors like retail trade, the evidence suggests that productivity growthwithin establishments is less important except in the case of young establishments5In section II of the online Appendix available with this paper at http://e-jep.org, we discuss the evidencethat shows the relationship between revenue productivity and growth and survival are very similar to therelationship between physical productivity and growth and survival.6Foster, Haltiwanger, and Syverson (2008) also find that the role of net entry is substantially larger usingtotal factor productivity measured in quantity terms as opposed to measuring it in revenue terms. Thenet entry component accounts for 35 percent of productivity growth with quantity-based productivity and24 percent of productivity growth with revenue-based productivity. The difference must lie, of course, inprice factors that differ between entrants and younger incumbents on the one hand and more matureincumbents on the other. They find that entrants and young establishments face substantially lowerprices, which may reflect the challenges of becoming established and building reputation in a market.
Ryan Decker, John Haltiwanger, Ron Jarmin, and Javier Miranda13that show productivity growth in their early years. Instead, most of the labor productivity growth in this sector has been attributed to net entry (Foster, Haltiwanger,and Krizan 2006). In many cases, existing firms improve productivity in retailtrade primarily through adding new, more-productive retail locations rather thanexpanding existing establishments. Moreover, much of the exit of low-productivityretail establishments in the US economy has been dominated by the exit of “momand pop” single-establishment firms. Doms, Jarmin, and Klimek (2004) find thatmore-intensive investment in information technology by large producers is relatedto both differences in the level of productivity across establishments and differencesin the within-establishment growth rates of productivity, thus highlighting the linkbetween technology, productivity, and business dynamics.An impo
The contribution of startups and young businesses to job creation involves rich dynamics. Most business startups exit within their first ten years, and most surviving young businesses do not grow but remain small. However, a small fraction of young firms exhibit very high growth and contribute substantially to job creation. These