Transcription
DE ANZA COLLEGE – DEPARTMENT OF MATHEMATICSInferential Statistics andHypothesis TestingA Holistic ApproachMaurice A. Geraghty1/1/2014Supplementary material for an introductory lower division course in Probability and Statistics
Page 1Inference and Hypothesis Testing – A Holistic ApproachSupplementary Material for an Introductory Lower DivisionCourse in Probability and StatisticsMaurice A. Geraghty, De Anza CollegeJanuary 1, 20141. Introduction – a Classroom Story and an Inspiration . . .Page 022. The Six Blind Men and the Elephant . Page 053. Two News Stories of Research . . .Page 064.5.6.7.8.9.Review and Central Limit Theorem . .Page 08Point Estimation and Confidence Intervals .Page 13One Population Hypothesis Testing .Page 20Two Population Inference. .Page 41One Factor Analysis of Variance (ANOVA) .Page 51Glossary of Statistical Terms used in Inference. .Page 5610. Flash Animations .Page 6211. PowerPoint Slides . . .Page 6312. Notes and Sources . . . .Page 64
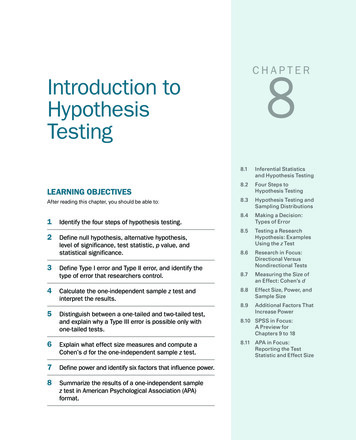
Page 21. Introduction - A Classroom Story and an InspirationSeveral years ago, I was teaching an introductory Statistics course at De Anza College where I hadseveral achieving students who were dedicated to learn the material and who frequently asked mequestions during class and office hours. Like many students, they were able to understand the materialon descriptive statistics and interpreting graphs. Unlike many introductory Statistics students, they hadexcellent math and computer skills and went on to master probability, random variables and the CentralLimit Theorem.However, when the course turned to inference and hypothesis testing, I watched these students’performance deteriorate. One student asked me after class to again explain the difference between theNull and Alternative Hypotheses. I tried several methods, but it was clear these students never reallyunderstood the logic or the reasoning behind the procedure. These students could easily perform thecalculations, but they had difficulty choosing the correct model, setting up the test, and stating theconclusion.These students, (to their credit) continued to work hard; they wanted to understand the material, notsimply pass the class. Since these students had excellent math skills, I went deeper into the explanationof Type II error and the statistical power function. Although they could compute power and sample sizefor different criteria, they still didn’t conceptually understand hypothesis testing.On my long drive home, I was listening to National Public Radio’s Talk of the Nation 1 where there was adiscussion on the difference between the reductionist and holistic approaches to the sciences, which thecommentator described as the western tradition vs. the eastern tradition. The reductionist or westernmethod of analyzing a problem, mechanism or phenomenon is to look at the component pieces of thesystem being studied. For example, a nutritionist breaks a potato down into vitamins, minerals,carbohydrates, fats, calories, fiber and proteins. Reductionist analysis is prevalent in all the sciences,including Inferential Statistics and Hypothesis Testing.Holistic or eastern tradition analysis is less concerned with the component parts of a problem,mechanism or phenomenon but instead how this system operates as a whole, including its surroundingenvironment. For example, a holistic nutritionist would look at the potato in its environment: when itwas eaten, with what other foods, how it was grown, or how it was prepared. In holism, the potato ismuch more than the sum of its parts.Consider these two renderings of fish:The first image is a drawing of fish anatomy byJohn Cimbaro used by the La Crosse Fish HealthCenter. 2 This drawing tells us a lot about how afish is constructed, and where the vital organsare located. There is much detail given to thescales, fins, mouth and eyes.
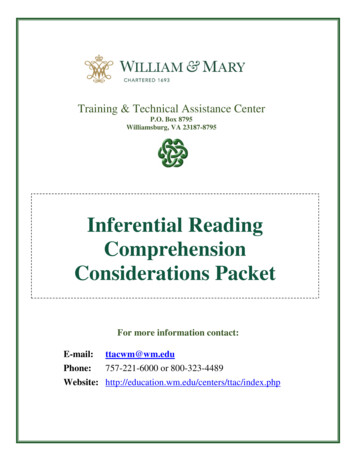
Page 3The second image is a watercolor bythe Chinese artist Chen ZhengLong3. In this artwork, we learn verylittle about fish anatomy seeing onlyminimalistic eyes, scales and fins.However, the artist shows how fishare social creatures, how their finsmove to swim and the type ofplants they like. Unlike the firstdrawing, we learn much more aboutthe interaction of the fish in itssurrounding environment and much less about how a fish is built.This illustrative example shows the difference between reductionist and holistic analyses. Eachrendering teaches something important about the fish: The reductionist drawing of the fish anatomyhelps explain how a fish is built and the holistic watercolor helps explain how a fish relates to itsenvironment. Both the reductionist and holistic methods add to knowledge and understanding, andboth philosophies are important. Unfortunately, much of Western science has been dominated by thereductionist philosophy, including the backbone of the scientific method, Inferential Statistics.Although science has traditionally been reluctant to embrace, often hostile to including holisticphilosophy in the scientific method, there have been many who now support a multicultural or multiphilosophical approach. In his book Holism and Reductionism in Biology and Ecology 4, Looijen claimsthat “holism and reductionism should be seen as mutually dependent, and hence co-operatingresearch programs than as conflicting views of nature or of relations between sciences.” Holismdevelops the “macro-laws” that reductionism needs to “delve deeper” into understanding or explaininga concept or phenomena. I believe this claim applies to the study of Statistics as well.I realize that the problem of my high-achieving students being unable to comprehend hypothesis testingcould be cultural – these were international students who may have been schooled under a moreholistic philosophy. The Introductory Statistics curriculum and most texts give an incompleteexplanation of the logic of Hypothesis Testing, eliminating or barely explaining such topics as Power, theconsequence of Type II error or Bayesian alternatives. The problem is how to supplement anIntroductory Statistics course with a holistic philosophy without depriving the students of the requiredreductionist course curriculum – all in one quarter or semester!I believe it is possible to teach the concept of Inferential Statistics holistically. This course material is aresult of that inspiration, which was designed to supplement, not replace, a traditional course textbookor workbook. This supplemental material includes: Examples of deriving research hypotheses from general questions and explanatory conclusionsconsistent with the general question and test results.An in-depth explanation of statistical power and type II error.
Page 4 Techniques for checking that validity of model assumptions and indentifying potential outliersusing graphs and summary statistics.Replacement of the traditional step-by-step “cookbook” for hypothesis testing with interrelatedprocedures.De-emphasis of algebraic calculations in favor of a conceptual understanding using computersoftware to perform tedious calculations.Interactive Flash animations to explain the Central Limit Theorem, inference, confidenceintervals, and the general hypothesis testing model including Type II error and power.PowerPoint Slides of the material for classroom demonstration.Excel Data sets for use with computer projects and labs.This material is limited to one population hypothesis testing but could easily be extended to othermodels. My experience has been that once students understand the logic of hypothesis testing, theintroduction of new models is a minor change in the procedure.
Page 52. The Six Blind Man and the ElephantThis old story from China or India was made into the poem The Blind Man and the Elephant by JohnGodfrey Saxe 5. Six blind men find excellent empirical evidence from different parts of the elephant andall come to reasoned inferences that match their observations. Their research is flawless and theirconclusions are completely wrong, showing the necessity of including holistic analysis in the scientificprocess.Here is the poem in its entirety:It was six men of Indostan, to learning much inclined,who went to see the elephant (Though all of them were blind),that each by observation, might satisfy his mind.The first approached the elephant, and, happening to fall,against his broad and sturdy side, at once began to bawl:"God bless me! but the elephant, is nothing but a wall!"The second feeling of the tusk, cried: "Ho! what have we here,so very round and smooth and sharp? To me tis mighty clear,this wonder of an elephant, is very like a spear!"The third approached the animal, and, happening to take,the squirming trunk within his hands, "I see," quoth he,the elephant is very like a snake!"The fourth reached out his eager hand, and felt about the knee:"What most this wondrous beast is like, is mighty plain," quoth he;"Tis clear enough the elephant is very like a tree."The fifth, who chanced to touch the ear, Said; "E'en the blindest mancan tell what this resembles most; Deny the fact who can,This marvel of an elephant, is very like a fan!"The sixth no sooner had begun, about the beast to grope,than, seizing on the swinging tail, that fell within his scope,"I see," quothe he, "the elephant is very like a rope!"And so these men of Indostan, disputed loud and long,each in his own opinion, exceeding stiff and strong,Though each was partly in the right, and all were in the wrong!So, oft in theologic wars, the disputants, I ween,tread on in utter ignorance, of what each other mean,and prate about the elephant, not one of them has seen!-John Godfrey Saxe
Page 63. Two News Stories of ResearchThe first story is about a drug that was thought to be effective in research, but was pulled from themarket when it was found to be ineffective in practice.FDA Orders Trimethobenzamide Suppositories Off the market 6FDA today ordered makers of unapproved suppositories containing trimethobenzamide hydrochlorideto stop manufacturing and distributing those products.Companies that market the suppositories, according to FDA, are Bio Pharm, Dispensing Solutions,G&W Laboratories, Paddock Laboratories, and Perrigo New York. Bio Pharm also distributes theproducts, along with Major Pharmaceuticals, PDRX Pharmaceuticals, Physicians Total Care,Qualitest Pharmaceuticals, RedPharm, and Shire U.S. Manufacturing.FDA had determined in January 1979 that trimethobenzamide suppositories lacked "substantialevidence of effectiveness" and proposed withdrawing approval of any NDA for the products."There's a variety of reasons" why it has taken FDA nearly 30 years to finally get the suppositoriesoff the market, Levy said.At least 21 infant deaths have been associated with unapproved carbinoxamine-containing products,Levy noted.Many products with unapproved labeling may be included in widely used pharmaceutical referencematerials, such as the Physicians' Desk Reference, and are sometimes advertised in medical journals,he said.Regulators urged consumers using suppositories containing trimethobenzamide to contact their healthcare providers about the products.The second story is about promising research that was abandoned because the test data showed nosignificant improvement for patients taking the drug.Drug Found Ineffective Against Lung Disease 7Treatment with interferon gamma-1b (Ifn-g1b) does not improve survival in people with a fatal lungdisease called idiopathic pulmonary fibrosis, according to a study that was halted early after nobenefit to participants was found.Previous research had suggested that Ifn-g1b might benefit people with idiopathic pulmonary fibrosis,particularly those with mild to moderate disease.The new study included 826 people, ages 40 to 79, who lived in Europe and North America. Theywere given injections of either 200 micrograms of Ifn-g1b (551 people) or a placebo (275) three timesa week.
Page 7After a median of 64 weeks, 15 percent of those in the Ifn-g1b group and 13 percent in the placebogroup had died. Symptoms such as flu-like illness, fatigue, fever and chills were more commonamong those in the Ifn-g1b group than in the placebo group. The two groups had similar rates ofserious side effects, the researchers found."We cannot recommend treatment with interferon gamma-1b since the drug did not improve survivalfor patients with idiopathic pulmonary fibrosis, which refutes previous findings from subgroupanalyses of survival in studies of patients with mild-to-moderate physiological impairment ofpulmonary function," Dr. Talmadge E. King Jr., of the University of California, San Francisco, andcolleagues wrote in the study published online and in an upcoming print issue of The Lancet.The negative findings of this study "should be regarded as definite, [but] they should not discouragepatients to participate in one of the several clinical trials currently underway to find effectivetreatments for this devastating disease," Dr. Demosthenes Bouros, of the Democritus University ofThrace in Greece, wrote in an accompanying editorial.Bouros added that people deemed suitable "should be enrolled early in the transplantation list, whichis today the only mode of treatment that prolongs survival."Although these are both stories of failures in using drugs to treat diseases, they represent two differentaspects of hypothesis testing. In the first story, the suppositories were thought to effective in treatmentfrom the initial trials, but were later shown to be ineffective in the general population. This is anexample of what statisticians call Type I Error, supporting a hypothesis (the suppositories are effective)that later turns out to be false.In the second story, researchers chose to abandon research when the interferon was found to beineffective in treating lung disease during clinical trials. Now this may have been the correct decision,but what if this treatment was truly effective and the researchers just had an unusual group of testsubjects? This would be an example of what statisticians call Type II Error, failing to support ahypothesis (the interferon is effective) that later turns out to be true. Unlike the first story, we will neverget to find out the answer to this question since the treatment will not be released to the general public.In a traditional Introductory Statistics course, very little time is spent analyzing the potential error shownin the second story. However, both types of error are important and will be explored in this coursematerial.
Page 84. Review and Central Limit Theorem4.1Empirical RuleA student asked me about the distribution of exam scores after she saw her score of 87 out of 100. I toldher the distribution of test scores were approximately bell-shaped with a mean score of 75 and astandard deviation of 10. Most people would have an intuitive grasp of the mean score as being the“average student’s score” and would say this student did better than average. However, having anintuitive grasp of standard deviation is more challenging. The Empirical Rule is a helpful tool inexplaining standard deviation.The standard deviation is a measure of variability or spread from the center of the data as defined bythe mean. The empirical rules states that for bell-shaped data:68% of the data is within 1 standarddeviation of the mean.95% of the data is within 2 standarddeviations of the mean.99.7% of the data is within 3 standarddeviations of the mean.In the example, our interpretation would be:68% of students scored between 65 and 85.95% of students scored between 55 and 95.99.7% of students scored between 45 and 105.The student who scored an 87 would be in the upper 16% of the class, more than one standarddeviation above the mean score.4.2The Z-scoreRelated to the Empirical Rule is the Z-score which measures how many standard deviations a particulardata point is above or below the mean. Unusual observations would have a Z-score over 2 or under -2.Extreme observations would have Z-scores over 3 or under -3 and should be investigated as potentialoutliers.Formula for Z-score:Z Xi Xs
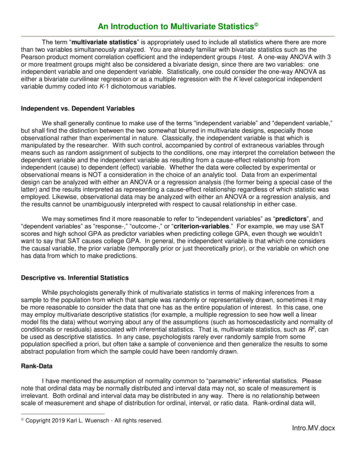
Page 9The student who received an 87 on the exam would have a Z-score of 1.2, meaning her score was wellabove average, but not highly unusual.Interpreting Z-score for Several StudentsTest Score877199394.3Z-score 1.2-0.4 2.4-3.6Interpretationwell above averageslightly below averageunusually above averageextremely below averageThe Sample Mean as a Random Variable – Central Limit TheoremIn the section on descriptive statistics, we studied the sample mean, 𝑋 , as measure of central tendency.Now we want to consider 𝑋 as a Random Variable.We start with a Random Sample X1, X2, , Xn where each of the random variables Xi has the sameprobability distribution and are mutually independent of each other. The sample mean is a function ofthese random variables (add them up and divide by the sample size), so 𝑋 is a random variable. So whatis the Probability Distribution Function (PDF) of 𝑋 ?To answer this question, conduct the following experiment. We will roll samples of n dice, determinethe mean roll, and create a PDF for different values of n.For the case n 1, the distribution of the sample mean is the same as the distribution of the randomvariable. Since each die has the same chance of being chosen, the distribution is rectangular shapedcentered at 3.5:
P a g e 10For the case n 2, the distribution of the sample mean starts to take on a triangular shape since somevalues are more likely to be rolled than others. For example, there six ways to roll a total of 7 and get asample mean of 3.5, but only one way to roll a total of 2 and get a sample mean of 1. Notice the PDF isstill centered at 3.5.For the case n 10, the PDF of the sample mean now takes on a familiar bell shape that looks like aNormal Distribution. The center is still at 3.5 and the values are now more tightly clustered around themean, implying that the standard deviation has decreased.
P a g e 11Finally, for the case n 30, the PDF continues to look like the Normal Distribution centered around thesame mean of 3.5, but more tightly clustered than the prior example:This die-rolling example demonstrates the Central Limit Theorem’s three important observations aboutthe PDF of 𝑋 compared to the PDF of the original random variable.1. The mean stays the same.2. The standard deviation gets smaller.3. As the sample size increase, the PDF of 𝑋 is approximately Normal.Central Limit TheoremIf X1, X2, , Xn is a random sample from a population that has a mean 𝜇and a standard deviation 𝜎, and n is sufficiently large then:1. 𝜇𝑋 𝜇𝜎2. 𝜎𝑋 𝑛 3. The Distribution of 𝑋 is approximately Normal.Combining all of the above into a single formula:𝑋 𝜇𝑍 𝜎where Z represents the Standard Normal Distribution. 𝑛 This powerful result allows us to use the sample mean 𝑋 as an estimator of the population mean 𝜇. Infact, most inferential statistics practiced today would not be possible without the Central LimitTheorem.
P a g e 12Example:The mean height of American men (ages 20-29) is µ 69.2 inches. If arandom sample of 60 men in this age group is selected, what is theprobability the mean height for the sample is greater than 70 inches?Assume σ 2.9”.Due to the Central Limit Theorem, we know the distribution of theSample will have approximately a Normal Distribution: (70 69.2) P ( Z 2.14) 0.0162P ( X 70) P Z 2.9 60 Compare this to the much larger probability that one male chosen will be over 70 inches tall:(70 69.2) P ( Z 0.28) 0.3897 P ( X 70) P Z 2.9 This example demonstrates how the sample mean will cluster towards the population mean as thesample size increases.
P a g e 135. Point Estimation and Confidence Intervals5.1Inferential StatisticsThe reason we conduct statistical research is to obtain an understanding about phenomena in apopulation. For example, we may want to know if a potential drug is effective in treating a disease. Sinceit is not feasible or ethical to distribute an experimental drug to the entire population, we instead muststudy a small subset of the population called a sample. We then analyze the sample and make aninference about the population based on the sample. Using probability theory and the Central LimitTheorem, we can then measure the reliability of the inference.Example: Lupe is trying to sell her house and needs to determine the market value of the home. Thepopulation in this example would be all the homes that are similar to hers in the neighborhood.Lupe’s realtor chooses for the sample nine recent homes in this neighborhood that sold in the last sixmonths. The realtor then adjusts some of the sales prices to account for differences between Lupe’shome and the sold homes.Sampled Homes Adjusted Sales Price 420,000 440,000 470,000 430,000 450,000 470,000 430,000 460,000 480,000
P a g e 14Next the realtor takes the mean of the adjusted sample and recommends to Lupe a market value forLupe’s home of 450,000. The realtor has made an inference about the mean value of the population.To measure the reliability of the inference, the realtor should look at factors like: the sample size beingsmall, values of homes may have changed in the last six months, or that Lupe’s home is not exactly likethe sampled homes.5.2Point EstimationThe example above is an example of Estimation, a branch of Inferential Statistics where sample statisticsare used to estimate the values of a population parameter. Lupe’s realtor was trying to estimate thepopulation mean (𝜇) based on the sample mean (𝑋 ).MeanStandard DeviationProportionSampleStatistics𝑋 s𝑝̂ PopulationParameters𝜇𝜎𝑝In the example above, Lupe’s realtor estimated the population mean of similar homes in Lupe’sneighborhood by using the sample mean of 450,000 from the adjusted price of the sampled homes.Interval EstimationA point estimate is our “best” estimate of a population parameter, but will most likely not exactly equalthe parameter. Instead, we will choose a range of values called an Interval Estimate that is likely toinclude the value of the population parameter.If the Interval Estimate is symmetric, the distancefrom the Point Estimator to either endpoint of theInterval Estimate is called the Margin of Error.In the example above, Lupe’s realtor could insteadsay the true population mean is probably between 425,000 and 475,000, allowing a 25,000Margin of Error from the original estimate of 450,000. This Interval estimate could also bereported as 450,000 25,000.5.3Confidence IntervalsUsing probability and the Central Limit Theorem, we can design an Interval Estimate called a ConfidenceInterval that has a known probability (Level of Confidence) of capturing the true population parameter.
P a g e 155.3.1Confidence Interval for Population MeanTo find a confidence interval for the population mean (𝜇) when the population standard deviation (𝜎) isknown, and n is sufficiently large, we can use the Standard Normal Distribution probability distributionfunction to calculate the critical values for the Level of Confidence:Constructing Confidence Intervals for 𝝁c Level ofConfidence90%95%99%Zc CriticalValue1.6451.9602.578Example: The Dean wants to estimate the mean number of hours worked per week by students. Asample of 49 students showed a mean of 24 hours with a standard deviation of 4 hours. The pointestimate is 24 hours (sample mean). What is the 95% confidence interval for the average number ofhours worked per week by the students?24 1.96 4 49 24 1.12 (22.88, 25.12) hours per weekThe margin of error for the confidence interval is 1.12 hours. We can say with 95% confidence that meannumber of hours worked by students is between 22.88 and 25.12 hours per week.If the level of confidence is increased, then the margin of error will also increase. For example, if weincrease the level of confidence to 99% for the above example, then:24 2.578 4 49 24 1.47 (22.53, 25.47) hours per weekSome important points about Confidence Intervals The confidence interval is constructed from random variablescalculated from sample data and attempts to predict an unknownbut fixed population parameter with a certain level of confidence.Increasing the level of confidence will always increase the margin oferror.It is impossible to construct a 100% Confidence Interval withouttaking a census of the entire population.Think of the population mean like a dart that always goes to the same spot, and the confidenceinterval as a moving target that tries to “catch the dart.” A 95% confidence interval would be likea target that has a 95% chance of catching the dart.
P a g e 165.3.2 Confidence Interval for Population Mean using Sample Standard Deviation – Student’s tDistributionThe formula for the confidence interval for the mean requires the knowledge of the population standarddeviation (𝜎). In most real-life problems, we do not know this value for the same reasons we do notknow the population mean. This problem was solved by the Irish statistician William Sealy Gosset, anemployee at Guiness Brewing. Gosset, however, was prohibited by Guiness in using his own name inpublishing scientific papers. He published under the name “A Student”, and therefore the distributionhe discovered was named "Student's t-distribution" 8.Characteristics of Student’s t Distribution It is continuous, bell-shaped, andsymmetrical about zero like the zdistribution.There is a family of t-distributions sharing amean of zero but having different standarddeviations based on degrees of freedom.The t-distribution is more spread out andflatter at the center than the Z-distribution,but approaches the Z-distribution as thesample size gets larger. Confidence Interval for 𝝁 𝒕𝒄𝑿𝒔 𝒏with degrees of freedom n - 1ExampleLast year Sally belonged to an Health Maintenance Organization (HMO) that had a population averagerating of 62 (on a scale from 0-100, with ‘100’ being best); this was based on records accumulated aboutthe HMO over a long period of time. This year Sally switched to a new HMO. To assess the populationmean rating of the new HMO, 20 members of this HMO are polled and they give it an average rating of65 with a standard deviation of 10. Find and interpret a 95% confidence interval for population averagerating of the new HMO.The t distribution will have 20-1 19 degrees of freedom. Using table or technology, the critical value forthe 95% confidence interval will be tc 2.09365 2.093 10 20 65 4.68 (60.32, 69.68) HMO rating
P a g e 17With 95% confidence we can say that the rating of Sally’s new HMO is between 60.32 and 69.68. Sincethe quantity 62 is in the confidence interval, we cannot say with 95% certainty that the new HMO iseither better or worse than the previous HMO.5.3.3Confidence Interval for Population ProportionRecall from the section on random variables the binomial distribution where 𝑝 represented theproportion of successes in the population. The binomial model was analogous to coin-flipping, or yes/noquestion polling. In practice, we want to use sample statistics to estimate the population proportion (𝑝).The sample proportion ( 𝑝̂ ) is the proportion of successes in the sample of size n and is the pointestimator for 𝑝. Under the Central Limit Theorem, if 𝑛𝑝 5 and 𝑛(1 𝑝) 5, the distribution of thesample proportion 𝑝̂ will have an approximately Normal Distribution. if Central Limit Theorem conditions are met.Normal Distribution for 𝒑𝑝(1 𝑝)𝑛𝜎𝑝 𝜇𝑝 𝑝Using this information we can construct a confidence interval for 𝑝, the population proportion:Confidence interval for 𝒑:𝑝(1 𝑝)𝑛𝑝̂ 𝑍 𝑝̂ 𝑍 𝑝 (1 𝑝 )𝑛Example200 California drivers were randomly sampled and it wasdiscovered that 25 of these drivers were illegally talkingon the cell phone without the use of a hands-free device.Find the point estimator for the proportion of drivers whoare using their cell phones illegally and construct a 99%confidence interval.The point estimator for 𝑝 is 𝑝̂ 25200A 99% confidence interval for 𝑝 is:0.125 2.576 .125(1 .125)200 .125 or 12.5%. .125 .060The margin of error for this poll is 6% and we can say with 99% confidence that true percentage ofdrivers who are using their cell phones illegally is between 6.5% and 18.5%
P a g e 185.3.4Point Estimator for Population Standard DeviationWe often want to study the variability, volatility or consistency of a population. For example, twoinvestments both have expected earnings of 6% per year, but one investment is much riskier, havinghigher ups and downs. To estimate variation or volatility of a data set, we will use the sample standarddeviation (𝑠) as a point estimator of the population standard deviation (𝜎).ExampleInvestments A and B are both known to have a rate of return of 6% per year. Over the last 24 months,Investment A has sample standard deviation of 3% per month, while for Investment B, the samplestandard deviation is 5% per month. We would say that Investment B is more volatile and riskier thanInvestment A due to the higher estimate of the standard deviation.To create a confidence interval for an estimate of standard deviation, we need to introduce a newdistribution, called the Chi-square (𝜒 2 ) distribution.The Chi-square 𝝌𝟐 DistributionThe Chi-square distribution is a family of distributions related to the Normal Distribution as it representsa sum of independent squared standard Normal Random Variables. Like the Student’s t distribution, thedegrees of freedom will be n-1 and determine the shape of the distribution. Also, since the Chi-squarerepresents squared data, the inference
on descriptive statistics and interpreting graphs. Unlike many introductory Statistics students, they had excellent math and computer skills and went on to master probability, random variables and the Central Limit Theorem. However, when the course turned to inference and hypothesis te