Transcription
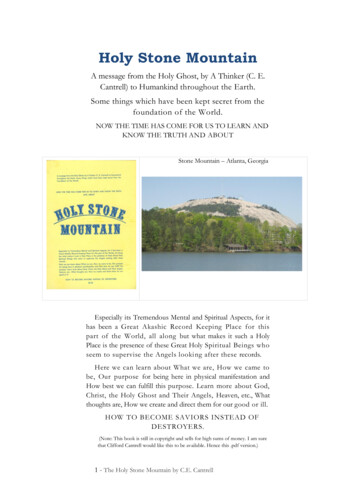
Economic Impact of Mountain Bikingin the Grand Mesa, Uncompahgre& Gunnison National ForestsJA MES N. M A PLES, PhDMICH A EL J. BR A DLEY, PhDImage Credit: Carl ZochReport submitted to Outdoor Alliance: November 2018Study funded by Outdoor Alliance1
Executive Summary of StudyGrand Mesa, Uncompahgre and Gunnison National Forest (GMUG) is an important Americanmountain biking destination.Mountain bikers visited the GMUG over 150,000 times per year. An estimated 70% of these visitswere from persons living outside the GMUG and surrounding region.Over 576 mountain bikers from around the nation responded to our survey collecting theireconomic expenditures on their most recent trip to the GMUG.Based on the economic impact analysis and NVUM visitation figures, the research team estimates:1.Mountain bike visitors who are not local residents annually spend 24 million in the GMUG.2. Mountain bike visitors’ expenditures in the GMUG support 315 jobs and 7.9 million in jobincome within the region.REPORT CONTENTSMeet Your Research Team2Methodological Notes3Study Regions4Visitor Mean Expenditures5Economic Impact Terminology8Economic Impact Modeling9Taxation Generation within the Study Areas10Visitor Expenditures beyond Study Area but in State11Local Resident Expenditures by Study Area12Local Resident Expenditures beyond Study Area but Inside State15Omissions, Considerations161
Meet Your Research TeamDR . JA MES N. M A PLES is an associate professor of sociologyat Eastern Kentucky University, where he examines the politicaleconomy of renewable tourism. His research interests include theeconomic impact of outdoor recreation and social change in ruralareas. In his free time, he is conducting an oral history of rockclimbing in Kentucky’s Red River Gorge. He is also an Eagle Scout,Girl Scout dad, and metal detectorist.james.maples@eku.eduDR . MICH A EL J. BR A DLEY is an associate professor anddirector of graduate studies in the Department of Recreation andPark Administration at Eastern Kentucky University. His professionaland academic interests include human dimensions of naturalresource and wildlife management as well as sustainable recreationpractices as it relates to outdoor recreation.michael.bradley@eku.eduCONTACT INFORMATION FOR FUTURE STUDIESOur research team regularly conducts economic impact studies, surveys, assessments, interpretationstudies, and other kinds of community-driven studies. If you or your organization is interested inconducting a study, please contact lead researchers Dr. James Maples or Dr. Michael Bradley(emails above) for further information.2
Methodological NotesSTUDY PUR POSEThe purpose of this study is to examine the annual economic impact of mountain biking visitorsin the GMUG based upon expenditures from most recent 2017 or 2018 visit.DATA COLLECTIONThe researchers collected data using an online survey available from July 14, 2018 until August 24, 2018.This is best treated as a convenience sample. The final survey language is available upon request. Thesurvey included questions examining economic expenditures across fifteen sectors and are outlined in thisreport. The survey included questions about where the respondent lives the majority of the year, the size ofthe group accounted for in the respondent’s economic impact questions, and a lodging selection.The research team used all of these questions in creating the economic estimates.A NA LYSISThis study uses established techniques utilized in previous peer-reviewed economic impact studies.First, respondents were sorted by local residents (respondents who self-reported as being a residentof the GMUG and immediate surrounding area) and visitors (respondents self-reporting as living outsidethe GMUG area). Local residents are separated from the economic impact estimates as their expenditures,while important, are not typically treated as true economic impact. Their mean expenditures are, however,reported as a supplement to the economic impact estimates.Second, mean expenditures were established for mountain biking visitors in each study area for each of thefifteen economic impact categories. Means are also included for expenditures outside the study area but stillwithin the state of Colorado.Third, group sizes in expenditures are addressed by dividing the respondent’s reported expendituresby their reported group size.Fourth, respondent cases in each mean with values higher than the third standard deviation were markedas missing data. This technique prevents overestimating economic impact and provides reliable,conservative means.Fifth, these means are entered into IMPLAN, an industry-leading economic impact calculation system,which uses input-output modeling to establish economic impact across three measures: output, value added,and job income.Sixth, these estimates are shaped by visitation data from the National Visitor Use Monitoring surveyconducted by the Forest Service. Visitation data were verified with the International Mountain BicyclingAssociation and broken down by study area to create a more nuanced economic estimate by study area.3
Study RegionsThis study includes four study areas: Grand Junction, Crested Butte, West Slope, and Ouray. Each areexplained in detail below. The economic impact study areas are built around common outdoor recreationdestinations and the cities and towns where outdoor recreation users are most apt to spend fundsas part of their trip.R EGION ONE: GR A ND J UNCTIONThe Grand Junction study area includesmountain biking opportunities in Grand Mesa,Cedaredge, and McClure Pass areas, as wellas the Uncompahgre Plateau, Montrose,Norwood, and Paonia / Northfork areas.Expenditures are modeled in Mesa County,Delta County, Montrose County, and SanMiguel County. These counties include citiesand towns such as Cedaredge, Paonia,Crawford, Hotchkiss, Montrose, Norwood,and Telluride. It also includes the GrandJunction metropolitan statistical area.R EGION T WO: CR ESTED BUTTEThe Crested Butte study area includesCrested Butte, Gunnison, and Taylor Parkmountain biking opportunities. It is modeledin Gunnison County, which includes bothGunnison and Crested Butte.R EGION THR EE: W EST SLOPEThe West Slope study area is the WesternSlope of the Monarch Pass area. Thisaggregated area includes Canyon Creek Trail,Monarch Crest, Agate Creek Trail, CochetopaHills, and Colorado Trails. The study area ismodeled in Gunnison County and ChafeeCounty, which includes Gunnison and Salidaas likely locations for expenditures.*Gross Regional Product and Total Personal Income listed in 1000sTable 1AEconomic Indicator Summary of Grand JunctionIndicatorGross Regional Product*Total Personal Income*Total EmploymentNumber of IndustriesLand Area (square miles)PopulationTotal HouseholdsValue 8,043,682 8,987,203129,8732987,996230,01391,470Table 1BEconomic Indicator Summary of Crested ButteIndicatorGross Regional Product*Total Personal Income*Total EmploymentNumber of IndustriesLand Area (square miles)PopulationTotal HouseholdsValue 817,151 710,87513,0441763,23916,4087,165Table 1CEconomic Indicator Summary of West SlopeIndicatorGross Regional Product*Total Personal Income*Total EmploymentNumber of IndustriesLand Area (square miles)PopulationTotal HouseholdsValue 1,470,259 1,473,02724,9372034,25235,46615,7584
Study Regions, ContinuedTable 1DR EGION FOUR : OUR AYThe Ouray study area includes mountain bikingin Ouray and Ridgway, Telluride, Silverton,and Lake City. The study area is modeled inSan Miguel, Hinsdale, and Ouray counties.Economic Indicator Summary of West SlopeIndicatorGross Regional Product*Total Personal Income*Total EmploymentNumber of IndustriesLand Area (square miles)PopulationTotal HouseholdsValue 815,090 888,4124,1811812,94613,6626,151Visitor Mean ExpendituresTables 2A - 2D detail overall meanvisitor expenditures inside the studyareas. Mean expenditures are anaveraged figure of what economicactivity one outdoor recreation visit(on average) to the study area creates.Mean expenditures were separatelycreated for visitors and local residentsacross fifteen common economic impactcategories covering most every facetof expenditures on a typical trip to theGMUG study areas.Each table includes means that havepreviously had all cases above threestandard deviations recoded as missingdata to discourage points of influencethat overstate economic impact. Themeans and standard deviations listed inthe table are the result of this process,hence they may still include cases threedeviations above the new estimates.Table 2AVisitor Mean Expenditures in the Grand Junction Study Area(Estimated 27,440 annual visits)VariableFast foodSit-down diningGrocery StoresGas station foodGasoline & oilRetail gearRetail, non-foodRental gearGuide serviceRental CarTaxi / Uber / LyftAdventure tourismEntertainmentHotels & 115114114114Mean 16.88 90.49 59.19 7.63 73.09 30.93 9.95 3.22 0.22 0.00 0.36 0.00 5.82 77.95 10.00Std. 50050050300500100180250200100900100In the Grand Junction study area (Table 2A), the largest expenditures were in sit-down dining(e.g. with wait staff) at 90.49 per trip and lodging at 77.95. Per visit expenditures for visitorsto the Grand Junction study area averaged 385.73.*Gross Regional Product and Total Personal Income listed in 1000s5
Visitor Mean Expenditures, ContinuedIn the Crested Butte study area(Table 2B), the greatest expenditureswere again sit-down dining ( 126.84)and lodging ( 160.53). The next highestmean expenditure was at grocery stores( 64.99). The typical mountain bikevisitor to Crested Butte spends 493.77 per visit.Table 2BIn the West Slope study area(Table 2C), the highest averageexpenditures are in sit-down dining( 78.79) and lodging ( 48.15), withgasoline ( 45.00) and groceries( 41.05) close behind. West Slopemountain bike visitors spend 263.41 per trip.Table 2CVisitor Mean Expenditures in the Crested Butte Study Area(Estimated 37,583 Annual Visits)VariableFast foodSit-down diningGrocery StoresGas station foodGasoline & oilRetail gearRetail, non-foodRental gearGuide serviceRental CarTaxi / Uber / LyftAdventure tourismEntertainmentHotels & 177178178161Mean 8.35 126.84 64.99 6.72 47.06 37.65 21.14 1.66 3.80 0.00 0.39 2.43 3.86 160.53 8.35Std. 050050200100015010040003083501000100Visitor Mean Expenditures in the West Slope Study Area(Estimated 9,843 Annual Visits)VariableFast foodSit-down diningGrocery StoresGas station foodGasoline & oilRetail gearRetail, non-foodRental gearGuide serviceRental CarTaxi / Uber / LyftAdventure tourismEntertainmentHotels & n 5.51 78.79 41.05 8.14 45.00 14.51 10.11 1.14 1.16 0.00 2.03 2.27 3.07 48.15 2.48Std. 3005020012510050500257550300556
Visitor Mean Expenditures, ContinuedIn the Ouray study area (Table 2D),mean expenditures continue to reflecthigh expenditures in dining and lodging.Here, the highest expenditures aresit-down dining ( 112.74) and lodging( 85.35). Ouray sees an estimated13,422 mountain bike visitors per year,each spending an average of 327.51.Table 2DVisitor Mean Expenditures in the West Slope Study Area(Estimated 10,738 Annual Visits)VariableFast foodSit-down diningGrocery StoresGas station foodGasoline & oilRetail gearRetail, non-foodRental gearGuide serviceRental CarTaxi / Uber / LyftAdventure tourismEntertainmentHotels & n 8.10 112.74 38.69 1.44 43.19 2.56 14.36 1.11 0.00 0.00 0.33 1.00 11.31 85.35 7.33Std. 025100330010302007501207
Economic Impact TerminologyIn the following paragraphs, three terms describe economic impact: direct effect, indirect effect,and induced effect.Direct effect is the economic impact created by the presence of the economic activity. For example,if a local restaurant sells 1K in food, its direct effect would be 1K.Indirect effect is economic activity created when local businesses purchase goods and services fromother local industries as a result of the direct effect.Induced effect is the estimated local expenditures by local households and employees as a resultof income created from the direct effect.Labor income impact is measured by the estimated labor income created by the economic activity in theregion. This is a conservative measure of economic impact.Value added is a measure of the increase in the study region’s gross domestic product. Gross domesticproduct is a measure of all goods and services produced in the study area and is treated as a measure ofthe size of the economy.Output is a measure of the increase in business sales revenue in the study area as a result of the economicimpact being studied. It includes business revenues as well as costs of doing business. It includes valueadded as part of its calculation.8
Economic Impact ModelingTable 3A summarizesthe economic impact ofmountain bike visitors inthe Grand Junction studyarea. In this study area,mountain biking visitors’expenditures support 100jobs and 2.6 million inlabor income.Table 3ATable 3B summarizesthe economic impact ofmountain biker visitors inthe Crested Butte studyarea. There, mountainbike visitors support anestimated 167 jobs andover 3.9 million inlabor income.Table 3BTable 3C lists economicimpact for mountain bikevisitors in the West Slopestudy area. There, theirexpenditures support27 jobs and 647,665 inlabor income for workers.Table 3CTable 3D describesmountain biker visitors’economic impact in theOuray study area. Theseexpenditures supportthe existence of anestimated 19 jobs andover 640,000 in laborincome each year.Table 3DEconomic Impact Summary of Mountain Biking Visitorsin Grand Junction Study AreaImpact TypeDirectIndirectInducedTotal EffectJobs Supported78.19.513.3100.9Labor Income 1,883,807 333,429 464,113 2,681,349Value Added 2,633,029 582,496 839,764 4,055,289Output 4,496,209 1,222,202 1,566,116 7,284,528Economic Impact Summary of Mountain Biking Visitorsin Crested Butte Study AreaImpact TypeDirectIndirectInducedTotal EffectJobs Supported137.313.716.5167.4Labor Income 3,022,165 460,375 464,812 3,947,352Value Added 3,874,813 924,102 996,933 5,795,847Output 7,173,569 1,820,512 1,854,327 10,848,408Economic Impact Summary of Mountain Biking Visitorsin West Slope Study AreaImpact TypeDirectIndirectInducedTotal EffectJobs Supported22.02.62.727.3Labor Income 503,299 68,911 75,455 647,665Value Added 643,433 138,918 162,627 944,978Output 1,182,793 320,404 303,173 1,806,370Economic Impact Summary of Mountain Biking Visitorsin Ouray Study AreaImpact TypeDirectIndirectInducedTotal EffectJobs Supported15.92.01.919.9Labor Income 510,431 69,907 59,779 640,117Value Added 1,017,965 138,150 129,227 1,285,342Output 1,539,167 269,827 236,825 2,045,8199
Taxation GenerationWithin the Study AreasTable 4AAnnual Estimated Taxation Generated byMountain Biking Visitors in Grand Junction Study AreaTax TypeEmployee CompensationProprietor IncomeTax on Production & ImportsHouseholdsCorporationsState & Local 8,534 0 475,466 63,235 5,786Federal 319,239 7,938 60,710 196,626 47,684Table 4BAnnual Estimated Taxation Generated byMountain Biking Visitors in Crested Butte Study AreaTax TypeEmployee CompensationProprietor IncomeTax on Production & ImportsHouseholdsCorporationsState & Local 12,447 0 685,022 96,251 7,956Federal 429,305 13,231 104,848 293,567 64,368Table 4CAnnual Estimated Taxation Generated byMountain Biking Visitors in West Slope Study AreaTax TypeEmployee CompensationProprietor IncomeTax on Production & ImportsHouseholdsCorporationsState & Local 2,022 0 116,043 15,062 1,110Federal 73,830 2,442 16,542 45,684 8,888Table 4DAnnual Estimated Taxation Generated byMountain Biking Visitors in Ouray Study AreaTax TypeEmployee CompensationProprietor IncomeTax on Production & ImportsHouseholdsCorporationsState & Local 1,859 0 120,744 16,556 2,370Federal 70,859 4,227 9,777 50,372 19,395Table 4A explains the tax contributions ofmountain bike visitors’ expenditures in theGrand Junction study area. There, mountainbiking visitors add over 553,021 in taxes tothe state and local economy. At the federallevel, mountain bike visitors add over 632,197 in taxes.Table 4B lists taxes generated by mountainbike visitors in the Crested Butte studyarea. Mountain bike visitors generate 801,676 in state and local taxes, as well as 905,319 in federal taxes in this study area.Table 4C lists taxes supported by mountainbike visitors in the West Slope area. Here,mountain bike visitors support 134,237 instate/local taxes. Their visits also generateover 147,386 in federal taxes, including 16,542 in taxes on production and imports.Finally, Table 4D summarizes taxes in theOuray study area. Mountain bike visitorssupport over 141,000 in state/local taxes,including 120,000 in production andimport taxes. Likewise, they support over 154,630 in federal taxes, mostly collectedthrough employee compensation taxes.10
Visitor Expenditures BeyondStudy Area But In StateTable 5 summarizes expendituresfor visitors making trips to the GMUGand, in the process, also spendingfunds outside the study area. Each year,mountain bike visitors expend around 103.60 outside the study area but stillin Colorado as a result of trips to theGMUG. Their highest expenses arelinked to travel-related expenditures,things like gasoline ( 21.01), generalretail purchases ( 20.23), sit-downmeals ( 16.99), getting mountain bikinggear or even a new bike ( 15.44),and groceries for the trip ( 11.54).Table 5Tourists Spending Outside Study Area but still in ColoradoVariableFast foodSit-down diningGrocery StoresGas station foodGasoline & oilRetail gearRetail, non-foodRental gearGuide serviceRental CarTaxi / Uber / LyftAdventure tourismEntertainmentHotels & 377375380374Mean 1.84 16.99 11.54 2.20 21.01 15.44 20.23 0.07 0.00 0.00 0.04 0.00 0.71 11.09 2.44Std. 2502500807550015011
Local Resident Expenditures by Study AreaTables 6A - 6D describe local residents’ expenditures as a result to visits to one of the three study areas.Although local resident mountain bikers are not regarded as true economic impact in their local economies,local residents do make a noted contribution to the local economy while visiting the GMUG.In the Grand Junction area(Table 6A), local resident mountainbiker expenditures are focused ingasoline purchases ( 72.37), dining( 57.37), and general retail sales( 32.50). There is one category(retail gear) which had a largerthan typical figure for this categorycompared to other study areas. This islikely due to a high number of mountainbiking purchases on the most recenttrip. As such, this statistic should betreated with caution.Table 6ALocal Resident Expenditures in Grand Junction Study Area(Estimated 11,888 Annual Visits)VariableFast foodSit-down diningGrocery StoresGas station foodGasoline & oilRetail gearRetail, non-foodRental gearGuide serviceRental CarTaxi / Uber / LyftAdventure tourismEntertainmentHotels & nStd. Dev. 4.9215.40 57.37112.10 31.0181.98 4.4311.51 72.37182.36 279.30837.15 32.50132.49 1.277.90 0.000.00 0.000.00 0.000.00 0.000.00 3.1814.90 2.9024.08 00600000100200012
Local Resident Expendituresby Study Area, ContinuedTable 6B examines similar expendituresin the Crested Butte study area. There,locals’ greatest contributions whilegoing to the GMUG to ride are in dining( 52.13), retail gear purchases ( 43.90),and gasoline ( 27.06).Table 6BTable 6C outlines local residentexpenditures in the West Slope studyarea. There, the leading expendituresare in lodging ( 82.73), dining ( 58.96),and groceries ( 31.39).Table 6CLocal Resident Expenditures in Crested Butte Study Area(Estimated 16,107 Annual Visits)VariableFast foodSit-down diningGrocery StoresGas station foodGasoline & oilRetail gearRental gearGuide serviceRental CarTaxi / Uber / LyftAdventure tourismEntertainmentHotels & resortsCampingRetail, non-foodObs565656575657585959595858616155Mean 5.36 52.13 15.25 1.06 27.06 43.90 0.00 0.00 0.00 0.00 0.00 2.24 9.84 0.00 2.52Std. 002030010000000070250050Local Resident Expenditures in West Slope Study Area(Estimated 4,218 Annual Visits)VariableFast foodSit-down diningGrocery StoresGas station foodGasoline & oilRetail gearRental gearGuide serviceRental CarTaxi / Uber / LyftAdventure tourismEntertainmentHotels & resortsCampingRetail, non-foodObs111212121112121212121211111012Mean 6.06 58.96 31.39 6.67 29.17 16.25 0.00 0.00 0.00 7.92 0.00 0.00 82.73 0.00 18.19Std. 0030601200005000500010013
Local Resident Expendituresby Study Area, ContinuedFinally, Table 6D lists local residentper visit expenditures for the Ouraystudy area. Here, expenditures werehighest in retail gear ( 35.00), dining( 29.08), and gasoline ( 18.34).Table 6DLocal Resident Expenditures in Ouray Study Area(Estimated 4,602 Annual Visits)VariableFast foodSit-down diningGrocery StoresGas station foodGasoline & oilRetail gearRental gearGuide serviceRental CarTaxi / Uber / LyftAdventure tourismEntertainmentHotels & resortsCampingRetail, non-foodObs363838373836383939393938383935Mean 0.00 29.08 12.82 1.62 18.34 35.00 0.00 0.00 0.00 0.00 0.00 2.63 1.97 0.00 0.51Std. 00400000001007501014
Local Resident ExpendituresBeyond Study Area But Inside StateLocal residents also continue to spend funds outside the study area as a result of visits to the GMUG.For example, these expenditures might include travel to the GMUG and the costs of travel. Local residentsspent an average of 74.41 outside the study areas but still within the Colorado state borders as a resultof recreating in the GMUG.Table 7 summarizes expendituresof local residents outside the studyarea but inside Colorado. Expendituresof these kinds are highest in gasoline( 20.77), rental gear ( 19.26), sit-downdining ( 12.69), and groceries ( 11.52).Again, these are expenditures thatoccur because of a trip to the GMUGto ride mountain bikes.Table 7Local Resident Expenditures Beyond Study Areabut inside Colorado (Estimated 36,816 Annual Visits)VariableFast foodSit-down diningGrocery StoresGas station foodGasoline & oilRetail gearRental gearGuide serviceRental CarTaxi / Uber / LyftAdventure tourismEntertainmentHotels & resortsCampingRetail, 192189Mean 2.69 12.69 11.52 0.99 20.77 5.16 19.26 0.32 0.00 0.00 0.11 0.00 0.21 0.48 0.21Std. 307502001000600020020924015
OMISSIONS & CONSIDER ATIONSDuring the research process, the research team identified minor issues that should be noted. First, as isalways the case with economic impact studies, the findings in this report must be treated as estimations.This economic impact study utilizes mean figures to estimate expenditures that may vary from year to year,visit to visit, event to event, and person to person.Second, this study does not account for length of visit. As point of reference, visitors in the study indicatedstaying an average of 4.8 days when staying at least one night.Third, collecting economic impact data well after the initial day of expenditures can result in unavoidableerrors in data collection. For examples, respondents rounding expenditures to the nearest dollar, forgettingexpenditures, or misstating expenditures are common issues. As such, the research team recommendsrepeating this study by collecting data in the field at or around the day expenditures are made.Fourth, this study uses generalized categories (e.g. mountain biking) to account for expenditures acrossmore than one form of outdoor recreation. Individual outdoor recreation types may have unique spendingpatterns that are lost in aggregated data. The researchers suggest conducting future field studies onseparate outdoor recreation categories to create a more nuanced economic estimate.Fifth, NVUM visitation estimates are unable to account for every single visit that occurs into a particular areaor study area. Outdoor recreation is particularly easy to undercount as outdoor recreation users are oftenless visible or in remote areas of a national forest.Sixth, NVUM classification of visitor use includes generalized uses (e.g. bicycling) which may cause inflationin the actual number of visits for the use being studied. As well, NVUM data allow for recreational users tovisit the GMUG for more than one purpose. As such, persons and expenditures represented in this studymay also overlap with other user groups’ economic contributions.Seventh, this study makes the assumption that the majority of bicycle use in the GMUG is attributed tomountain biking. This may cause under or overestimations of economic impact as a result. Working withIMBA, it was estimated that 80% of the visits included in this category were mountain biking.Eighth, the estimates in this report look to account for approximately 95% of visitors to the GMUGin a given year by focusing on the major areas of use. This may result in underreporting users of areasnot included in the report.16
in the Grand Mesa, Uncompahgre & Gunnison National Forests Image Credit: Carl Zoch. 1 Executive Summary of Study Grand Mesa, Uncompahgre and Gunnison National Forest (GMUG) is an important American mountain biking destination. Mountain bikers visited the GMUG over 150,000 times per year. An estimated 70% of these visits were from persons living outside the GMUG and surrounding region. Over 576 .