Transcription
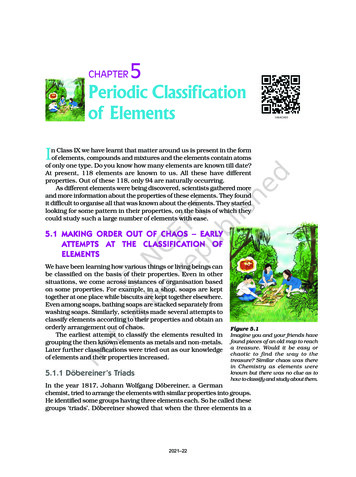
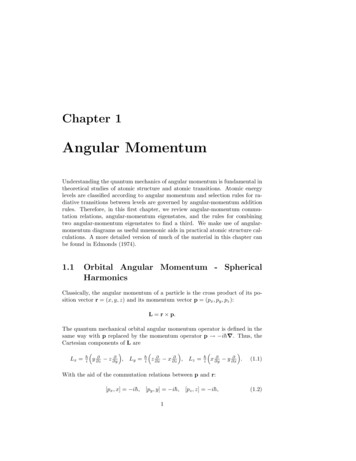
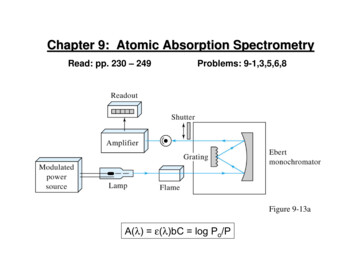
Chapter 9: Atomic Absorption SpectrometryRead: pp. 230 – 249Problems: 9-1,3,5,6,8Figure 9-13aA(λ) ε(λ)bC log Po/P
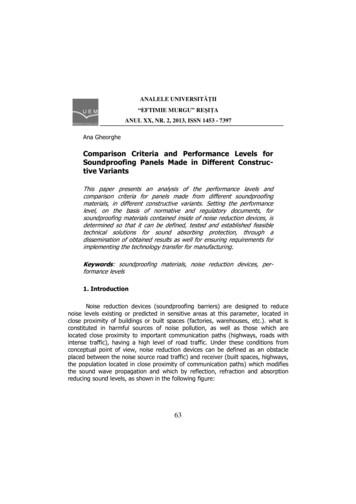
Flame-BurnerIn AAS, the flame functions as (i) sample holder,(ii) desolvation source, and (iii) volatilization source.Figure 9-5
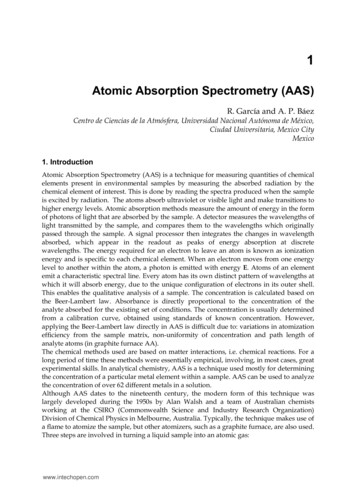
Flame StructurePrimary zone:C2, CH, and otherradical emissionSecondary zone:oxygen present sostable molecular oxidesare formed for somemetalshνInterzonal regions:hot region, most widelyused for analysisFigure 9-2
Optimum analysis position in the flame depends on theparticular element and its chemistry:Figure 9-4
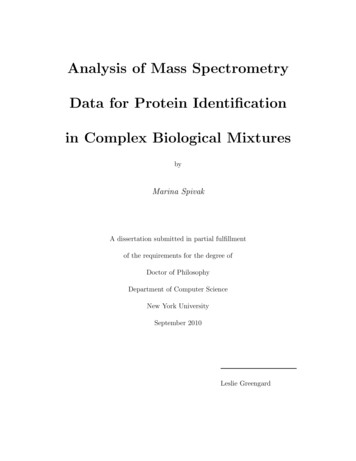
Line Source – Hollow Cathode LampFigure 9-11Cathode material made of the element of interest, e.g. Na HCL forthe analysis of Na. An individual lamp is needed for eachelement. So AAS is a one-element-at-a-time measurement!
Desired line of source is selected with monochromator:Figure 9-10
Monochromator – Wavelength SeparatorFigure 7-21nλ d(sin i sin r)R λ/ λ nNN grooves/mmProperties: light gathering power, stray light rejection,resolution, and linear dispersion
Optical DetectorsSingle vs. multichannel detectors!S kP kdPhotomultiplier tubeFigure 7-31b
Single-Beam Spectrometer:Figure 9-13a
Double-Beam Spectrometer:Figure 9-13b
Typical Figures of Merit for AAS Detection limits: ng/mL (ppb) for flamepg/mL (ppt) for electrothermal Linear range: 103 – 104 for flame102 for electrothermal Precision: 1 – 2% RSD for flame5 – 10% RSD for electrothermal Accuracy: 1 – 2% for flame% for flameRemember: mg/L ppm ug/L ppb ng/L ppt
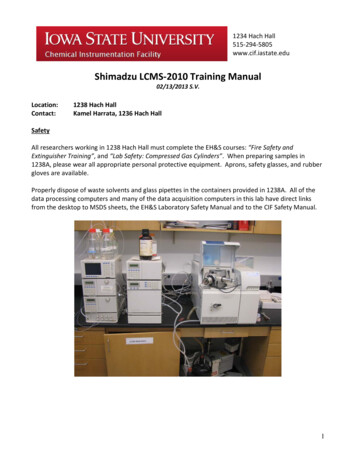
Chemical ProblemTypical data for the determinationof lead (Pb2 ) by graphite furnaceAAS in standards was 0.05µg/mL (0.09 AU), 0.1 µg/mL(0.16 AU), 0.2 µg/mL (0.31 AU)and in a sample of cannedorange juice was 0.10 AU.Assume that these absorbancedata were obtained for 2 µLaliquots of standards andsample. Calculate theconcentration of lead in theorange juice sample.Figure 9-7
Calibration Curve for Pb2 0.350.30y 1.4714x 0.0152R 100.15CONCENTRATION (µg/mL)0.200.25
Calibration equation: A 1.4714 C 0.015Orange juice sample: A 0.10C A 0.015 0.10 0.015 0.058 µg / mL Pb 2 1.47141.4714
Spectral and Chemical InterferencesRemember: Goal is neutral atoms in the gas phase! Absorption or emission of an interfering species overlaps orlies so close to the analyte absorption or emission thatresolution is not possible. Rare with HCLs. Presence of combustion products that exhibit broadbandabsorption or particulates that scatter radiation. Both diminishpower of transmitted beam and lead to positive errors.If caused by fuel/oxidant mixture, then correction is possibleby running a blank and performing background subtraction.More troublesome problem when absorption or scatteringresults from the sample matrix.
Interference by anions that form low volatility complexes withthe analyte, and thus reduce the atoms formed. Lead tonegative errors. Can be corrected by– Releasing agents (cations added to preferentially react)– Protecting agents (e.g., EDTA added to protect analyte cation) Dissociation equilibriaMO M OM(OH)2 M 2 OH Ionization equilibriaM M e–In both cases, analyte atoms are not all in the proper form toabsorb or emit at desired wavelength. Lead to negative errors.
Terms to Know!!!ablationaerosolatomic absorptionatomic emissionatomic fluorescenceatomizationbackground correctionBoltzman distributionchemical interferencedetection limitDoppler effectgraphite furnacehollow cathode lampionization interferencematrixnebulizationreleasing agentself-absorptionspectral interferenceionization suppressor
Cathode material made of the element of interest, e.g. Na HCL for the analysis of Na. An individual lamp is needed for each element. So AAS is a one-element-at-a-time measurement! Desired li