Transcription
ch01.qxd9/11/200211:40 AMPage 9S E C T I O N1Conceptualizationand Analysis ofChemical ProcessesThe first section of this book consists of Chapters 1–4. Chapter 1 covers the important diagrams that are routinely used by chemical engineers to help designand understand chemical processes. The book commences with this section andchapter because nearly all the technical information that is presented in the remainder of the book is, in some way, related to the three principal diagrams thatare presented in Chapter 1. These three diagrams are the block flow diagram(BFD), process flow diagram (PFD), and the piping and instrument diagram(P&ID). In addition, the three-dimensional representation of a process is introduced, and some of the basic issues regarding equipment location are addressed.In Chapter 2 the evolutionary process of design is investigated. The inputoutput structure of a process is presented, and the basic building blocks that arecommon to all processes are introduced. The different recycle structures ofprocesses are illustrated, and the rationale for adding inert material to the feed isalso explained.In Chapter 3, methods for tracing chemical species through a process flow diagram are given. By following the paths of feed chemicals and reactants, it is possible to obtain a much clearer picture of what is happening in an existing process.Finally, in Chapter 4, the conditions at which different equipment operateare discussed and explained. The concept of conditions of special concern is explained, and examples of such conditions are identified and explained in the context of the toluene hydrodealkylation process.Chapter 1: Diagrams for Understanding Chemical ProcessesThe technical diagrams commonly used by chemical engineers are presented. These diagrams include the block flow diagram (BFD), the processflow diagram (PFD), and the process and instrumentation diagram (P&ID).9
ch01.qxd9/11/20021011:40 AMPage 10Section 1Conceptualization and Analysis of Chemical ProcessesA standard method for presenting a PFD is given and illustrated using aprocess to produce benzene via the catalytic hydrodealkylation of toluene.The 3D topology of chemical processes is introduced, and some basic information on the spacing and elevation of equipment is presented. These concepts are further illustrated in the Virtual Plant Tour AVI file on the CD accompanying the textbook.Chapter 2: The Structure and Synthesis of Process Flow DiagramsThe evolutionary process of design is investigated. This evolution begins withthe process concept diagram that shows the input-output structure of allprocesses. From this simple starting point, the engineer can estimate the grossprofit margins of competing processes and of processes that use differentchemical synthesis routes to produce the same product. In this chapter, it isshown that all processes have a similar input/output structure whereby rawmaterials enter a process and are reacted to form products and by-products.These products are separated from unreacted feed, which is usually recycled.The product streams are then purified to yield products that are acceptable tothe market place. All equipment in a process can be categorized into one of thesix elements of the generic block flow process diagram. The process of processdesign continues by building preliminary flowsheets from these basic functional elements that are common to all processes.Chapter 3: Tracing Chemicals through the Process Flow DiagramIn order to gain a better understanding of a PFD, it is often necessary to follow the flow of key chemical components through the diagram. This chapter presents two different methods to accomplish this. The tracing of chemicals through the process reinforces our understanding of the role that eachpiece of equipment plays. In most cases, the major chemical species can befollowed throughout the flow diagram using simple logic without referringto the flow summary table.Chapter 4: Understanding Process ConditionsOnce the connectivity or topology of the PFD has been understood, it is necessary to understand why a piece of equipment is operated at a given pressureand temperature. The idea of conditions of special concern is introduced.These conditions are either expensive to implement (due to special materialsof construction and/or the use of thick-walled vessels) or use expensive utilities. The reasons for using these conditions are introduced and explained.
ch01.qxd9/11/200211:40 AMPage 11C H A P T E R1Diagramsfor UnderstandingChemical ProcessesThe chemical process industry (CPI) is involved in the production of a wide variety of products that improve the quality of our lives and generate income for thecompanies and their stockholders. In general, chemical processes are complex,and chemical engineers in industry encounter a variety of chemical process flowdiagrams. These processes often involve substances of high chemical reactivity,high toxicity, and high corrosivity operating at high pressures and temperatures.These characteristics can lead to a variety of potentially serious consequences, including explosions, environmental damage, and threats to people’s health. It isessential that errors or omissions resulting from missed communication betweenpersons and/or groups involved in the design and operation do not occur whendealing with chemical processes. Visual information is the clearest way to presentmaterial and is least likely to be misinterpreted. For these reasons, it is essentialthat chemical engineers be able to formulate appropriate process diagrams andbe skilled in analyzing and interpreting diagrams prepared by others.The most effective way of communicating information about aprocess is through the use of flow diagrams.This chapter presents and discusses the more common flow diagrams encountered in the chemical process industry. These diagrams evolve from the timea process is conceived in the laboratory through the design, construction, and themany years of plant operation. The most important of these diagrams are described and discussed in this chapter.11
ch01.qxd9/11/20021211:40 AMPage 12Section 1Conceptualization and Analysis of Chemical ProcessesThe following narrative is taken from Kauffman [1] (adapted by permissionof the American Institute of Chemical Engineers, AIChE copyright 1986, allrights reserved) and describes a representative case history related to the development of a new chemical process. It shows how teams of engineers work together to provide a plant design and introduces the types of diagrams that will beexplored in this chapter.The research and development group at ABC Chemicals Company worked out a wayto produce alpha-beta souptol (ABS). Process engineers assigned to work with the development group have pieced together a continuous process for making ABS in commercial quantities and have tested key parts of it. This work involved hundreds ofblock flow diagrams, some more complex than others. Based on information derived from these block flow diagrams, a decision was made to proceed withthis process.A process engineering team from ABC’s central office carries out the detailedprocess calculations, material and energy balances, equipment sizing, etc. Workingwith their drafting department, they produced a series of PFDs (Process Flow Diagrams) for the process. As problems arise and are solved, the team may revise and redraw the PFDs. Often the work requires several rounds of drawing, checking, andrevising.Specialists in distillation, process control, kinetics, and heat transfer arebrought in to help the process team in key areas. Some are company employees andothers are consultants.Since ABC is only a moderate-sized company, it does not have sufficient staff toprepare the 120 P&IDs (Piping and Instrumentation Diagrams) needed for thenew ABS plant. ABC hires a well-known engineering and construction firm (E&CCompany), DEFCo, to do this work for them. The company assigns two of the ABCprocess teams to work at DEFCo to coordinate the job. DEFCo’s process engineers,specialists, and drafting department prepare the P&IDs. They do much of the detailedengineering (pipe sizes, valve specifications, etc.) as well as the actual drawing. Thejob may take two to six months. Every drawing is reviewed by DEFCo’s project teamand by ABC’s team. If there are disagreements, the engineers and specialists from thecompanies must resolve them.Finally, all the PFDs and the P&IDs are completed and approved. ABC cannow go ahead with the construction. They may extend their contract with DEFCo toinclude this phase, or they may go out for construction bids from a number of sources.This narrative describes a typical sequence of events taking a project fromits initial stages through plant construction. If DEFCo had carried out the construction, ABC could go ahead and take over the plant or DEFCo could be contracted to carry out the start-up and to commission the plant. Once satisfactoryperformance specifications have been met, ABC would take over the operation ofthe plant and commercial production would begin.From conception of the process to the time the plant starts up, two or moreyears will have elapsed and millions of dollars will have been spent with no revenue from the plant. The plant must operate successfully for many years to produce sufficient income to pay for all plant operations and to repay the costs
ch01.qxd9/11/2002Chapter 111:40 AMPage 13Diagrams for Understanding Chemical Processes13associated with designing and building the plant. During this operating period,many unforeseen changes are likely to take place. The quality of the raw materialsused by the plant may change, product specifications may be raised, productionrates may need to be increased, the equipment performance will decrease becauseof wear, the development of new and better catalysts will occur, the costs of utilities will change, new environmental regulations may be introduced, or improvedequipment may appear on the market.As a result of these unplanned changes, plant operations must be modified.Although the operating information on the original process diagrams remains informative, the actual performance taken from the operating plant will be different. The current operating conditions will appear on updated versions of thevarious process diagrams, which will act as a primary basis for understandingthe changes taking place in the plant. These process diagrams are essential to anengineer who has been asked to diagnose operating problems, to solve problemsin operations, to debottleneck systems for increased capacity, and to predict theeffects of making changes in operating conditions. All these activities are essential in order to maintain profitable plant operation.In this chapter, we concentrate on three diagrams that are important tochemical engineers: block flow, process flow, and piping and instrumentationdiagrams. Of these three diagrams, we will find that the most useful to chemicalengineers is the PFD. The understanding of the PFD represents a central goal ofthis textbook.1.1BLOCK FLOW DIAGRAMS (BFDs)The block flow diagram is introduced early in the education of chemical engineers. In the first courses in material and energy balances, often the initial stepwas to convert a word problem into a simple visual block flow diagram. This diagram was a series of blocks connected with input and output flow streams. Itincluded operating conditions (temperature and pressure) and other importantinformation such as conversion and recovery, given in the problem statement. Itdid not provide details regarding what was involved within the blocks, but concentrated on the main flow of streams through the process.The block flow diagram can take one of two forms. First, a block flow diagram may be drawn for a single process. Alternatively, a block flow diagram maybe drawn for a complete chemical complex involving many different chemicalprocesses. We differentiate between these two types of diagram by calling thefirst a block flow process diagram and the second a block flow plant diagram.1.1.1Block Flow Process DiagramAn example of a block flow process diagram is shown in Figure 1.1, and theprocess illustrated is described below.
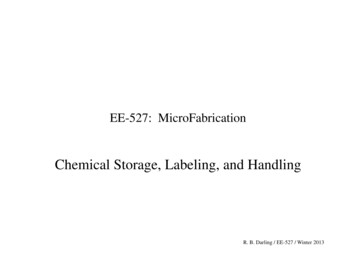
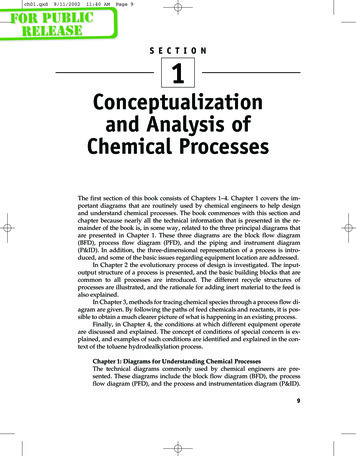
ch01.qxd9/11/200211:40 AMPage 1414Section 1Conceptualization and Analysis of Chemical ProcessesMixed Gas(2,610 kg/h)Toluene(10,000 kg/h)ReactorGasSeparatorBenzene(8,210 kg/h)Hydrogen(820 kg/h)Conversion75% TolueneMixed LiquidsStillTolueneReaction : C 7 H8 H 2 C 6 H6 C H4Figure 1.1 Block Flow Process Diagram for the Production of BenzeneToluene and hydrogen are converted in a reactor to produce benzene and methane. Thereaction does not go to completion, and excess toluene is required. The noncondensablegases are separated and discharged. The benzene product and the unreacted toluene arethen separated by distillation. The toluene is then recycled back to the reactor and thebenzene removed in the product stream.This block flow diagram gives a clear overview of the production of benzene, unobstructed by the many details related to the process. Each block in thediagram represents a process function and may, in reality, consist of severalpieces of equipment. The general format and conventions used in preparingblock flow process diagrams are presented in Table 1.1.Although much information is missing from Figure 1.1, it is clear that such adiagram is very useful for “getting a feel” for the process. Block flow process diagrams often form the starting point for developing a PFD. They are also veryhelpful in conceptualizing new processes and explaining the main features of theprocess without getting bogged down in the details.1.1.2Block Flow Plant DiagramsAn example of a block flow plant diagram for a complete chemical complex is illustrated in Figure 1.2. This block flow plant diagram is for a coal to higher alcohol fuels plant. Clearly, this is a complicated process in which there are a numberof alcohol fuel products produced from a feedstock of coal. Each block in this dia-
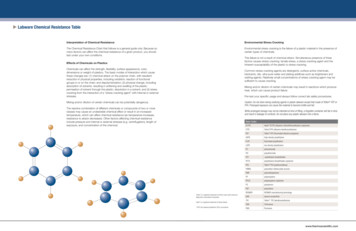
ch01.qxd9/11/2002Chapter 111:40 AMPage 15Diagrams for Understanding Chemical Processes15Table 1.1 Conventions and Format Recommended for Laying Out a Block FlowProcess Diagram1. Operations shown by blocks2. Major flow lines shown with arrows giving direction of flow3. Flow goes from left to right whenever possible4. Light stream (gases) toward top with heavy stream (liquids and solids) towardbottom5. Critical information unique to process supplied6. If lines cross, then the horizontal line is continuous and the vertical line is broken.(hierarchy for all drawings in this book)7. Simplified material balance providedgram represents a complete chemical process (compressors and turbines are alsoshown as trapezoids), and we could, if we wished, draw a block flow process diagram for each block in Figure 1.2. The advantage of a diagram such as Figure 1.2is that it allows us to get a complete picture of what this plant does and how allthe different processes interact. On the other hand, in order to keep the diagramrelatively uncluttered, only limited information is available about each processunit. The conventions for drawing block flow plant diagrams are essentially thesame as given in Table 1.1.Both types of block flow diagrams are useful for explaining the overall operation of chemical plants. For example, consider that you have just joined a largechemical manufacturing company that produces a wide range of chemical products from the site to which you have been assigned. You would most likely begiven a block flow plant diagram to orient you to the products and important areasof operation. Once assigned to one of these areas, you would again likely be provided with a block flow process diagram describing the operations in your particulararea.In addition to the orientation function described earlier, block flow diagrams are used to sketch out and screen potential process alternatives. Thus, theyare used to convey information necessary to make early comparisons and eliminate competing alternatives without having to make detailed and costly comparisons.1.2Process Flow Diagram (PFD)The process flow diagram (PFD) represents a quantum step up from the BFD interms of the amount of information that it contains. The PFD contains the bulk ofthe chemical engineering data necessary for the design of a chemical process. Forall of the diagrams discussed in this chapter, there are no universally acceptedstandards. The PFD from one company will probably contain slightly different
161Aair3412watercoal11cryogenicO2 1446waterpurgesyn. gasheat rge56B28377056Aalcoholsynthesis46Clausplantgas syn gascombust’nbfw nt tosulfurwater to sws50 atmosphere75co2 purgewwwater CO2argonnitrogensteam to scslag productexhaust gases5763mixed alcohols64co2 n2co2 rich stream51BeavonplantFigure 1.2 Block Flow Plant Diagram of a Coal to Higher Alcohol Fuels Process2coalpreparation112water make-uplimestone101918394711:40 AMwaterSour GasShift489/11/2002methanolmake upairwaterch01.qxdPage 16
ch01.qxd9/11/2002Chapter 111:40 AMPage 17Diagrams for Understanding Chemical Processes17information than the PFD for the same process from another company. Havingmade this point, it is fair to say that most PFDs convey very similar information.A typical commercial PFD will contain the following information:1. All the major pieces of equipment in the process will be represented on thediagram along with a description of the equipment. Each piece of equipment will have assigned a unique equipment number and a descriptivename.2. All process flow streams will be shown and identified by a number. A description of the process conditions and chemical composition of each streamwill be included. These data will be displayed either directly on the PFD orincluded in an accompanying flow summary table.3. All utility streams supplied to major equipment that provides a processfunction will be shown.4. Basic control loops, illustrating the control strategy used to operate theprocess during normal operations, will be shown.It is clear that the PFD is a complex diagram that requires a substantial effort to prepare. It is essential that to avoid errors in presentation and interpretation it should remain uncluttered and be easy to follow. Often PFDs are drawn onlarge sheets of paper (Size D: 24” 36”), and several connected sheets may be required for a complex process. Because of the page size limitations associated withthis text, complete PFDs cannot be presented here. Consequently, certain libertieshave been taken in the presentation of the PFDs in this text. Specifically, certaininformation will be presented in accompanying tables and only the essentialprocess information will be included on the PFD. The resulting PFDs will retainclarity of presentation, but the reader must refer to the flow summary and equipment summary tables in order to extract all the required information about theprocess.Before we discuss the various aspects of the PFD, it should be noted that thePFD and the process that we describe in this chapter will be used throughout thebook. The process is the hydrodealkylation of toluene to produce benzene. This isa well-studied and well-understood commercial process that is still used today.The PFD that we present in this chapter for this process is technically feasible butis in no way optimized. In fact, there are many improvements to the process technology and economic performance that can be made. Many of these improvements will become evident when the appropriate material is presented. This allows the techniques provided throughout this text to be applied to identify bothtechnical and economic problems in the process and to make the necessaryprocess improvements. Therefore, as we proceed through the text, we will identify weak spots in the design, make improvements, and move toward an optimized process flow diagram.
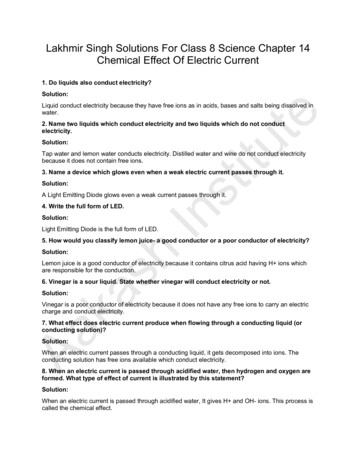
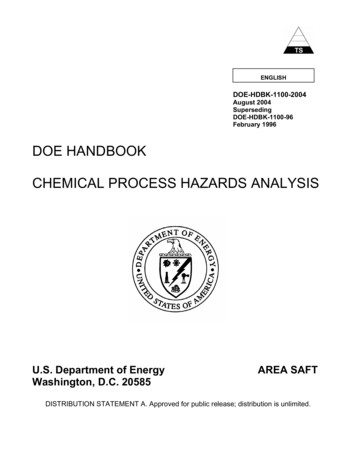
ch01.qxd9/11/20021811:40 AMPage 18Section 1Conceptualization and Analysis of Chemical ProcessesThe basic information provided by a PFD can be categorized into one of thefollowing:1. Process topology2. Stream information3. Equipment informationWe will look at each aspect of the PFD separately. After we have addressedeach of the three topics, we will bring all the information together and present thePFD for the benzene process.1.2.1 Process TopologyFigure 1.3 is a skeleton process flow diagram for the production of benzene (seealso the block flow process diagram in Figure 1.1). This skeleton diagram illustrates the location of the major pieces of equipment and the connections that theprocess streams make between equipment. The location of and interaction between equipment and process streams is referred to as the process topology.Equipment is represented symbolically by “icons” that identify specific unitoperations. Although the American Society of Mechanical Engineers (ASME) [2]publishes a set of symbols to use in preparing flowsheets, it is not uncommon forcompanies to use in-house symbols. A comprehensive set of symbols is also givenby Austin [3]. Whatever set of symbols is used, there is seldom a problem in identifying the operation represented by each icon. Figure 1.4 contains a list of thesymbols used in process diagrams presented in this text. This list covers over 90%of those needed in fluid (gas or liquid) processes.Figure 1.3 shows that each major piece of process equipment is identified bya number on the diagram. A list of the equipment numbers along with a brief descriptive name for the equipment is printed along the top of the diagram. The location of these equipment numbers and names roughly corresponds to the horizontal location of the corresponding piece of equipment. The convention forformatting and identifying the process equipment is given in Table 1.2.Table 1.2 provides the information necessary for the identification of theprocess equipment icons shown in a PFD. As an example of how to use this information, consider the unit operation P-101A/B and what each number or lettermeans.P-101A/B identifies the equipment as a pumpP-101A/B indicates that the pump is located in area 100 of the plantP-101A/B indicates that this specific pump is number 01 in unit 100.P-101A/B indicates that a back-up pump is installed. Thus, there are twoidentical pumps P-101A and P-101B. One pump will be operating while theother is idle.
104cw14E-104Figure 1.3 Skeleton Process Flow Diagram (PFD) for the Production of Benzene via the Hydrodealkylation of Toluene3Hydrogen1Toluene1611:40 AMcw9/11/2002fuel gasE-103 E-106T-101E-104E-102V-103V-104 P-102A/B E-105V-101 P-101A/BV-102E-101H-101 R-101 C-101A/BProductToluene TolueneFeedFeed Reactor RecycleGas Reactor HighPres. Low Pres. Tower Benzene Benzene Benzene Reflux RefluxCoolerStorage Feed Pumps Preheater HeaterCompressor Effluent Phase Sep. Phase Sep. Feed Reboiler Column Condenser Drum PumpsHeaterCoolerDrumch01.qxdPage 1919
ch01.qxd9/11/200211:40 AMPage 2020Section 1Conceptualization and Analysis of Chemical ProcessesHEAT EXCHANGERSTOWERSFIRED HEATERVESSELSSTORAGE TANKSREACTORSPUMPS, TURBINES,COMPRESSORSPROCESS INPUTVALVEPROCESS OUTPUTSTREAM NUMBERCONTROL VALVEINSTRUMENT FLAGGLOBE VALVE (MANUAL CONTROL)Figure 1.4 Symbols for Drawing Process Flow DiagramsThe 100 area designation will be used for the benzene process throughoutthis text. Other processes presented in the text will carry other area designations.Along the top of the PFD, each piece of process equipment is assigned a descriptive name. From Figure 1.3 it can be seen that Pump P-101 is called the “toluenefeed pump.” This name will be commonly used in discussions about the processand is synonymous with P-101.During the life of the plant, many modifications will be made to the process;often it will be necessary to replace or eliminate process equipment. When a pieceof equipment wears out and is replaced by a new unit that provides essentiallythe same process function as the old unit, then it is not uncommon for the newpiece of equipment to inherit the old equipment’s name and number (often an additional letter suffix will be used, e.g., H-101 might become H-101A). On the otherhand, if a significant process modification takes place, then it is usual to use newequipment numbers and names. The following example, taken from Figure 1.3, illustrates this concept.
ch01.qxd9/11/200211:40 AMPage 21Chapter 1Diagrams for Understanding Chemical ProcessesTable 1.2Conventions Used for Identifying Process EquipmentProcess Equipment21General Format XX-YZZ A/BXX are the identification letters for the equipment classificationC - Compressor or TurbineE - Heat ExchangerH - Fired HeaterP - PumpR - ReactorT - TowerTK - Storage TankV - VesselY designates an area within the plantZZ is the number designation for each item in an equipment classA/B identifies parallel units or backup units not shown on a PFDSupplemental InformationAdditional description of equipment given on top of PFDExample 1.1Operators report frequent problems with E-102, which are to be investigated. The PFD forthe plant’s 100 area is reviewed, and E-102 is identified as the “Reactor Effluent Cooler.”The process stream entering the cooler is a mixture of condensable and non-condensablegases at 654 C that are partially condensed to form a two-phase mixture. The coolant iswater at 30 C. These conditions characterize a complex heat transfer problem. In addition,operators have noticed that the pressure drop across E-102 fluctuates wildly at certaintimes, making control of the process difficult. Because of the frequent problems with thisexchanger, it is recommended that E-102 be replaced by two separate heat exchangers. Thefirst exchanger cools the effluent gas and generates steam needed in the plant. The secondexchanger uses cooling water to reach the desired exit temperature of 38 C. These exchangers are to be designated as E-107 (reactor effluent boiler) and E-108 (reactor effluentcondenser).The E-102 designation is retired and not reassigned to the new equipment. Therecan be no mistake that E-107 and E-108 are new units in this process and thatE-102 no longer exists.Referring back to Figure 1.3, it can be seen that each of the process streamsis identified by a number in a diamond box located on the stream. The directionof the stream is identified by one or more arrowheads. The process stream numbers are used to identify streams on the PFD, and the type of information that istypically given for each stream is discussed in the next section.
ch01.qxd9/11/200211:40 AMPage 2222Section 1Conceptualization and Analysis of Chemical ProcessesAlso identified in Figure 1.3 are utility streams. Utilities are needed servicesthat are available at the plant. Chemical plants are provided with a range of central utilities that include electricity, compressed air, cooling water, refrigeratedwater, steam, condensate return, inert gas for blanketing, chemical sewer, wastewater treatment, and flares. A list of the common services is given in Table 1.3,which also provides a guide for the identification of process streams.Each utility is identified by the initials provided in Table 1.3. As an example,let us locate E-102 in Figure 1.3. The notation, cw, associated with the nonprocessstream flowing into E-102 indicates that cooling water is used as a coolant.Electricity used to power motors and generators is an additional utility thatis not identified directly on the PFD or in Table 1.3 but is treated separately. Mostof the utilities shown are related to equipment that add or remove heat within theTable 1.3Conventions for Identifying Process and Utility StreamsProcess StreamsAll conventions shown in Table 1.1 apply.Diamond symbol located in flow lines.Numerical identification (unique for that stream) inserted in diamond.Flow direction shown by arrows on flow lines.Utility StreamslpsLow-pressure Steam: 3–5 barg (sat) ‡mpsMedium-pressure Steam: 10–15 barg (sat) ‡hpsHigh-pressure Steam: 40–50 barg (sat) ‡htmHeat Transfer Media (Organic): to 400 CcwCooling Water: From cooling tower 30 C returned at less than 45 C†wrRiver Water: From river 25 C returned at less than 35 CrwRefrigerated Water: In at 5 C returned at less than 15 CrbRefrigerated Brine: In at 45 C returned at less than 0 CcsChemical Waste Water with high CODssSanitary Waste Water with high BOD, etc.elElectric Heat (specify 220, 440, 660V service)ngNatural GasfgFuel GasfoFuel OilfwFire Water‡These pressures are set during the preliminary design stages and typical values vary within theranges shown.†Above 45 C, significant scaling occurs.
ch01.qxd9/11/2002Chapter 111:40 AMPage 23Diagrams for Understanding Chemical Processes23process in order to control temperatures. This is common for most chemicalprocesses.1.2.2Stream InformationFrom the process flow diagram, Figure 1.3, the identification of the processstreams is clear. For small diagrams containing only a few operations, the characteristics of the streams such as temperatures, pressures, compositions, andflowrates can be shown directly on the figure, adjacent to the stream. This is notpractical for a more complex diagram. In this case, only the stream number isprovided on the diagram. This indexes the stream to information on a flow summary or stream table, which is often provided below the process flow diagram. Inthis text the flow summary table is provided as a separate attachment to the PFD.The stream information that is normally given in a flow summary table isgiven in Table 1.4. It is divided into two groups—required information and optional information—th
(BFD), process flow diagram (PFD), and the piping and instrument diagram (P&ID). In addition, the three-dimensional representation of a process is intro-duced, and some of the basic issues regarding equipment location are addressed. In Chapter 2 the evolutionary process