Transcription
Loeffelbein et al. BMC Cancer 2014, 6RESEARCH ARTICLEOpen AccessDiagnostic value of retrospective PET-MRI fusionin head-and-neck cancerDenys J Loeffelbein1*†, Michael Souvatzoglou2†, Veronika Wankerl1, Julia Dinges2, Lucas M Ritschl1,Thomas Mücke1, Anja Pickhard3, Matthias Eiber2, Markus Schwaiger2 and Ambros J Beer2AbstractBackground: To assess the diagnostic value of retrospective PET-MRI fusion and to compare the results withside-by-side analysis and single modality use of PET and of MRI alone for locoregional tumour and nodal staging ofhead-and-neck cancer.Methods: Thirty-three patients with head-and-neck cancer underwent preoperative contrast-enhanced MRI and PET/CT for staging. The diagnostic data of MRI, PET, side-by-side analysis of MRI and PET images and retrospective PET-MRIfusion were systematically analysed for tumour and lymph node staging using receiver operating characteristic (ROC)analysis. The results were correlated to the histopathological evaluation.Results: The overall sensitivity/specificity for tumour staging for MRI, PET, side-by-side analysis and retrospectivePET-MRI fusion was 79%/66%, 82%/100%, 86%/100% and 89%/100%, respectively. The overall sensitivity/specificity fornodal staging on a patient basis for MRI, PET, side-by-side analysis and PET-MRI fusion was 94%/64%, 94%/91%, 94%/82% and 94%/82%, respectively. MRI, PET, side-by-side analysis and retrospective image fusion were associated withcorrect diagnosis/over-staging/under-staging of N-staging in 70.4%/18.5%/11.1%, 81.5%/7.4%/11.1%, 81.5%/11.1%/7.4%and 81.5%/11.1%/7.4%, respectively.ROC analysis showed no significant differences in tumor detection between the investigated methods. The Area Underthe Curve (AUC) for MRI, PET, side-by-side analysis and retrospective PET-MRI fusion were 0.667/0.667/0.702/0.708(p 0.05). The most reliable technique in detection of cervical lymph node metastases was PET imaging (AUC: 0.95),followed by side-by-side analysis and retrospective image fusion technique (AUC: 0.941), which however, was notsignificantly better then the MRI (AUC 0.935; p 0.05).Conclusions: We found a beneficial use of multimodal imaging, compared with MRI or PET imaging alone, particularin individual cases of recurrent tumour disease. Side-by-side analysis and retrospective image fusion analysis did notperform significantly differently.Keywords: Multimodal imaging, PET-MRI fusion, Retrospective image fusion, Side-by-side analysis, Head-and-neckcancer, StagingBackgroundClinical examination and imaging is routinely performedfor the staging of head-and-neck cancer (HNC) in orderto establish the tumour extent and size, to assess nodalinvolvement, to evaluate detailed tumour spread, e.g.bone infiltration and perineural infiltration, and to identify distant metastasis [1]. Accurate imaging is essential* Correspondence: loeffelbein@mkg.med.tum.de†Equal contributors1Department of Oral and Maxillofacial Surgery, Technische UniversitätMünchen, Ismaningerstr. 22, D-82675 München, GermanyFull list of author information is available at the end of the articlefor staging, treatment planning and follow-up, since surgical intervention and neo- or adjuvant therapy modalities depend on the outcome of the diagnostic results[2]. For head-and-neck tumours, magnetic resonanceimaging (MRI) and computed tomography (CT) provideaccurate anatomical information with good resolutionbut have well-known limitations, especially in the stagingof the nodal involvement of the neck [3,4] and recurrentdisease [5,6]. Furthermore, the differentiation betweenmalignant bone infiltration and infectious bone reactionis also of poor accuracy [7]. An advantage of MRI is that 2014 Loeffelbein et al.; licensee BioMed Central Ltd. This is an Open Access article distributed under the terms of theCreative Commons Attribution License (http://creativecommons.org/licenses/by/4.0), which permits unrestricted use,distribution, and reproduction in any medium, provided the original work is properly credited. The Creative Commons PublicDomain Dedication waiver ) applies to the data made available in thisarticle, unless otherwise stated.
Loeffelbein et al. BMC Cancer 2014, 6Page 2 of 10fewer artefacts occur from (dental) metallic implants,which often interfere with CT interpretation [8].Nowadays multimodal imaging by using positron emission tomography/computed tomography (PET/CT) hasgained a wide acceptance as a powerful imaging tool,especially in recurrent tumour disease. The combinationof morphological and functional imaging (multimodal imaging) has been shown to reduce false positive or falsenegative results [9,10]. Driven by the success of PET/CTin HNC treatment [11,12], hybrid PET/MRI scanners arenow available to combine the high soft-tissue contrastof MRI with the molecular and/or metabolic information ofPET. Previous reports have described the development ofreliable PET/MR imaging protocols [10,13-15] for HNCstaging. However, to date, only a few sequential or fullyintegrated PET/MRI scanners are in clinical use. Mostdepartments can still only offer the use of the twomodalities (PET/CT and MRI) each as a single device.The separately gained images can be additionally analysed in two different ways: 1) side-by-side analysis and2) retrospective software-based image fusion. The lattercan be performed manually by shifting and rotating theimages by using landmarks as reference [16,17] or fullyautomatically [18]. Retrospective image fusion is, because of its complexity, time-consuming, hardwareand software-dependent and thus problematic in clinicalroutine. Furthermore, differences in the patient’s positionduring each imaging process limit the accuracy of theretrospective fusion. On the other hand, this method hasbeen shown to lead to a more precise evaluation and treatment of HNC in complex cases [14,19].The purpose of this retrospective study was to assessthe clinical value of retrospective PET-MRI fusion and tocompare the diagnostic accuracy with side-by-side analysisMRI and 18F-FDG PET alone.The suspicious lesions/tumours were localised in theoropharynx (n 5), tongue (n 5), floor of the mouth(n 4), hypopharnyx (n 4), buccal mucosa (n 2), valleculla (n 1), tonsil (n 1) and salivary gland (n 1).The recurrent tumours were localised in the floor ofthe mouth (n 2), tongue (n 1), parotid gland (n 1),tonsil (n 1) and oropharynx (n 1) (Table 1).Surgical treatment included the resection of thetumour and uni- or bilateral neck dissection in 28 cases.In five cases with recurrent tumour disease, only thetumour was resected.MethodsMR imagingEthics statementPatients underwent MRI in a Magnetom Verio 3 TeslaMRI Scanner (Siemens Medical Solutions, Erlangen,Germany). We obtained unenhanced axial T1-weightedimages, enhanced axial T1-weighted and coronal T1weighted fat-saturated images after gadolinium DTPAinjection (Gadolinium-DTPA 0,1 mmol/kg body weight)and T2-weighted fat-suppressed fast-spin-echo (T2-STIRsequence) images in axial, sagittal and coronal planes inall patients.The study has been performed in accordance with theDeclaration of Helsinki and has been approved from anethical and legal point of view by the ethical committeeof the medical faculty of the Technische UniversitätMünchen (registration number: 366/14).Patient populationThirty-three patients (21 men and 12 women; age range27–72 years; mean age 57 years) with primary malignantneoplasm (n 23), recurrent tumour disease (n 6) andlymph node metastasis in the framework of CUP (cancerof unknown primary) (n 4) in the head-and-neck regionwere included in the study. All patients underwent clinically indicated preoperative contrast-enhanced MR imagingand 18F-FDG PET/CT imaging within 14 days (mean threedays).18F-FDG PET/CT imagingPET/CT imaging was performed by using a SiemensBiograph Sensation 64 PET/CT scanner (SiemensHealthcare, Erlangen, Germany) equipped with lutetiumoxy-orthosilicate (LSO) crystals. The spatial resolutionwas 4.4 mm at 1 cm and 5.0 mm at 10 cm from the centreof the transverse FOV (field of view) and the sensitivitywas 8.1 kcps/MBq at the centre of the FOV. After at leastfour hours of fasting, the patients received a weightdependent intravenous injection of 350–500 MBq of 18FFDG. Blood glucose levels were checked in all patients,before injection, to be below 150 mg/dl. For attenuationcorrection purposes and anatomical correlation, a lowdose CT scan (120 keV, 20 mAs, no i.v.-contrast) wasacquired in shallow expiration. When clinically indicated,a diagnostic CT (120 kV, 240 mAs, 0.5 s per rotation,5 mm slice thickness, portal venous phase 80 s after theinjection of 80–120 ml i.v. contrast agent [Imeron 300])was performed. In patients with a diagnostic CT scan, thisscan was used for attenuation correction.PET scan was performed immediately after CT, with a3-min acquisition per bed position (6–8), by using athree-dimensional acquisition mode.Data processing and retrospective PET-MR image fusionAll attenuation-corrected PET and enhanced T1-weightedMRI series were retrospectively fused by using a commercially available software program (3D Fusion, SiemensMedical Solutions, Erlangen, Germany) on a separateSiemens Workstation (Syngo MMWP, Siemens MedicalSolutions, Erlangen, Germany). The software allows
Loeffelbein et al. BMC Cancer 2014, 6Page 3 of 10Table 1 Demographic data of the thirty-three enrolled patients, information concerning tumour location andstudy-relevant information as an overviewCaseLocation of tumour siteTime between MRT and PET (d)IndicationHistopathological resultTNM classification1Tonsil7Primary stagingSCCpT2 pN2b pMx2CUP/Tonsil7Primary stagingSCCpT1 pN1 pMx3Oropharynx1Recurrent tumourChronic inflammation-4CUP3Primary stagingSCCcTx pN2b pMx5Tongue0Primary stagingSCCpT2 pN2c pMx6Parotid Gland8Primary stagingSCCpT3 pN2c pMx7Oropharynx14Primary stagingSCCpT2 pN0 pMx8Oropharynx6Primary stagingSCCpT4b pN2b pMx9Buccal mucosa2Primary stagingSCCpT1 pN2b pMx10Hypopharynx6Primary stagingSCCpT1 pN1 pMx11Tongue14Recurrent tumourSCCrpT2 pNx pMx12Parotid Gland1Recurrent tumourAdenoid cystic CarcinomarpT1 pNx pMx13Floor of the mouth1Primary stagingSCCpT1 pN0 pMx14Tongue0Primary stagingSCCpT1 pN0 pMx15Oropharynx1Primary stagingSCCpT1 pN2a pMx16Oropharynx0Primary stagingSCCpT3 pN2b pMx17Tongue0Primary stagingSCCpT3 pN2b pMx18Hypopharynx0Primary stagingSCCpT3 pN2a pMx19Tongue0Primary stagingSCCpT1 pN0 pMx20Floor of the mouth0Primary stagingSCCpT1 pN0 pMx21Floor of the mouth0Primary stagingSCCpT1 pN0 pMx22Floor of the mouth0Primary stagingSCCpT2 pN0 pMx23Hypopharynx0Primary stagingSCCpT2 pN2b pMx24Oropharynx0Primary stagingSCCpT3 pN2b pMx25Buccal mucosa1Primary stagingFibroxanthoma-26Floor of the mouth6Metachronous tumourSCCpT2 pN0 pMx27Floor of the mouth6Recurrent tumourSCCrpT2 pNx pMx28CUP5Primary stagingSCCcTx pN2b pMx29Tongue0Primary stagingSCCpT2 pN0 pMx30CUP8Primary stagingSCCcTx pN2b pMx31Tonsil1Recurrent tumourFibrosis-32Hypopharynx3Primary stagingSCCpT2 pN2b pMx33Vallecula6Primary stagingSCCpT1 pN0 pMxAbbreviations: M: man; W: woman; CUP: cancer of unknown primary; SCC: squamous cell carcinoma; TNM: tumour classification according to Weber et al.retrospective interactive fusion of two different tomographical imaging modalities (datasets) acquired at differenttime points. After initial loading of the MR dataset in the3D card, the PET dataset was included using the fusiontool. Hereby, a first initial orientation manual alignmenthas to be performed in order to roughly match prominentanatomical landmarks (cerebellum, spine tonsils) of thetwo datasets. After that, the software automatically alignsthe two datasets (MR and PET) based on mutual information using the anatomical contours of the loaded datasets(e.g. head, neck etc.). Lastly, fused images were examinedand - if necessary - manually fine adjusted for correctalignment by using landmarks such as the cerebellum, thetonsils, the vocal cords and the spine.Image analysisTwo observers, namely an experienced head-and-neck imaging radiologist and an experienced nuclear medicinephysician, retrospectively reviewed all 33 image sets of theenrolled patients independently. According to a structured
Loeffelbein et al. BMC Cancer 2014, 6protocol, they evaluated the images for whether atumour was benign or malignant, tumour localisation,bone infiltration (T-staging) and metastases to cervicallymph nodes (N-staging) by using a five-point-scalingsystem: 1 most likely benign, 2 probably benign,3 equivocal/indeterminate, 4 probably malignant and5 most likely malignant.Metastases to locoregional lymph nodes were analysedseparately with regard to the ipsi- or contralateral sideand the presence of metastases was recorded accordingto the classification described by Robins et al. [20]. In anattempt to imitate a normal clinical set-up, none of theobservers was aware of the histopathological findings orfollow-up but was fully informed of the clinical historyand actual clinical findings of the patients.In the analysis of MRI, the primary tumour was assessedfor loss of symmetry, tissue shifting, abnormal tissue enhancement, inhomogeneity in tissue architecture, bony infiltration or other infiltration of neighbouring structuresand abnormal focal-contrast enhancement (T-staging). Alymph node was considered as positive for metastasis ifthe short-axis axial diameter was 10 mm. If lymph nodeswere smaller than 10 mm but showed signs of central necrosis and rim contrast enhancement, extra-capsular extension or obliteration of surrounding fat planes, theywere also counted as positive neck nodes (N-staging).The analysis of the PET images was performed visually. The corresponding CT images were only used foranatomical orientation and were not analysed separatelyor as PET/CT. For the visual analysis all PET imageswere scaled at a SUV (standardised uptake value) of five.All non-physiological focally increased 18F-FDG uptakein the head-and-neck region were analysed in detail, according to the five-point-scaling system (see above).After the separate analysis of PET and MR images,both observers reviewed the imaging data concurrentlyin a side-by-side fashion on two adjacent screens. Bothobservers had to agree to a mutual score with regard toT-staging (including bone infiltration) and N-staging according to the five-point-scaling system.In the third assessment round, both observers analysedthe fused PET-MR images and had to again agree to a mutual score regarding the T-staging (including bone infiltration) and N-staging according to the five-point-scalingsystem.Page 4 of 10presented by Weber et al. [22]. All patients were rated asMx as the M-status had no influence on the study designand analysis. Bony infiltration was analysed by directhistological evaluation of the resected bone. If no boneresection was performed and/or the soft tissue specimennext to the tumour was rated as R0, the adjacent bonystructures next to the tumour were also rated as beingnot infiltrated.Statistical analysisThe results of the histopathological evaluation were correlated with the diagnostic graduation of MRI, PET, side-byside analysis and retrospective PET-MR image fusion byusing receiver operating characteristic (ROC) curve incombination with Area Under the Curve (AUC). For thisanalysis the scores of the five-point-scaling system werebinary-coded (1–3 were rated as benign and 4–5 wererated as malignant). The binary score of the different imaging techniques and the histopathological analysis of specimen were used as variables.The Youden-Index was used to determine the cut-offpoint at which both tumor and lymph node involvementscores had the highest correlation with the histopathological specimen.Correct positive, false positive, correct negative and falsenegative rates were calculated and the sensitivity and specificity were determined for T-staging and N-staging. Withregard to N-staging, differentiation between positive (N )and negative (N0) cervical lymph nodes was performed atthe patient level. Because of the low patient count, wecould not differentiate between primary or recurrenttumour diseases or between CUP syndromes.The data was analyzed with the “Statistical Package forthe Social Sciences” (SPSS for Windows, release 21.0.0.2013, SPSS Inc). The figures were generated with SPSS.ResultsTechnique of image fusionThe semi-automatically image registration with manuallyadjustment for correct alignment took about 10–20 minutes per case before the analysis started. PET-MRI fusions could be performed in all cases with no obviouslimitations, even though fine manual readjustments hadto be done in some cases after automatic fusion wascompleted.Histopathological referenceThe type and extent of surgical resection of the tumourand the type of the neck dissection was determined byour head-and-neck surgical team on the basis of stagingresults and estimated risk of occult metastases [21]. Anexperienced anatomical pathologist performed the histopathological evaluation of the resected tissue. The assessment was based on the TNM-classification systemResults of T-stagingThirty-one (n 31) suspected tumour lesions were considered for analysis, since, in one patient of the four CUPsyndrome cases, a primary tumour had been detected inthe tonsil (case 2). In case 26, an additional metachronoustumour became evident in the analysis and was alsoaccounted for the following analysis. Malignant tumours
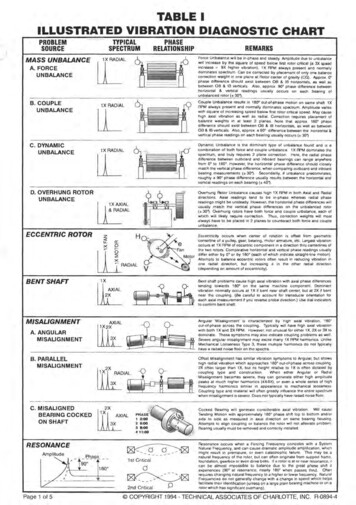
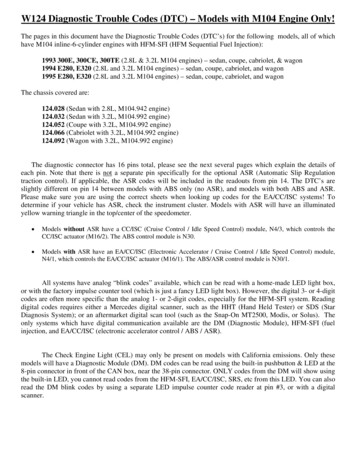
Loeffelbein et al. BMC Cancer 2014, 6Page 5 of 10were detected in 28 tissue sections and three were benignin nature.The overall sensitivity and specificity of T-staging forMRI, PET, side-by-side analysis and PET-MRI fusion arepresented in Table 2.Out of the seven falsely rated MRI analyses, one benign lesion was falsely rated as malignant and six malignant lesions were falsely rated as benign. Therefore, MRIalone was associated with a positive predictive value of96% and a negative predictive value of 25%.In the analysis of PET alone, five actually malignant lesions were falsely rated as benign. Out of these, three lesions had not been detected and two moderately increasedup-takes were rated as nonspecific activity. Therefore,PET alone was associated with a positive predictive valueof 100% and a negative predictive value of 38%.In the simultaneous analysis of MRI and PET in aside-by-side fashion, two additional malignant lesionsthan in MRI alone were detected and one suspicion ofmalignancy was rejected. Side-by-side analysis was associated with a positive predictive value of 100% and anegative predictive value of 43%.The analysis of retrospectively fused PET-MR imagesdetected one additional malignancy in a case after tonguereconstruction. Because of the altered anatomical structures, MRI alone was rated as “indeterminate”, whereas inthe side-by-side analysis, it was rated as probably benign,with only the evaluation of the fused images confirmingthe malignancy of the suspicious lesion. RetrospectivePET-MRI fusion was associated with a positive predictivevalue of 100% and a negative predictive value of 50%.However, three malignant tumours remained undetected in all evaluation rounds. One small tumour ofthe oropharynx (pT1) and one tumour of the buccal mucosa (pT1) were not seen at all. One carcinoma in situof the left tonsil was rated as 2 probably benign inMRI and as 1 most likely benign in PET/CT and inside-by-side analysis and image fusion. Biopsy by panendoscopy revealed these three tumours histologically.As a summary statistic the ROC-curve is illustrated inFigure 1. The cut-off point for the different methods investigating tumor evidence was at a score of 3.5 in allmethods described. Retrospective image fusion techniqueTable 2 Diagnostic results of tumour staging (T-staging)in thirty-one ivepredictivevalueNegativepredictivevalueMRI79% (22/28)66% (2/3)96% (22/23)25% (2/8)PET82% (23/28)100% (3/3)100% (23/23)38% (3/8)side-by-side86% (24/28)100% (3/3)100% (24/24)43% (3/7)PET-MRI Fusion 89% (25/28)100% (3/3)100% (25/25)50% (3/6)(AUC: 0.708, Youden-Index: 0.524) was the most reliabletechnique, followed by side-by-side analysis (AUC: 0.702,Youden-Index: 0.488) and both the MRI and PET imaging(AUC: 0.667, Youden-Index: 0.453). There were no significant differences in tumor detection between the investigated methods (p 0.05).The analysis of mandibular bone infiltration was impaired in single case because of susceptibility artefacts inMRI (n 2) or because of motion artefacts (n 1). InPET/CT imaging, the analysis of potentially involvedbone was complicated by beam-hardening artefacts infour cases (n 4), caused by metallic implants. In twoout of 28 malignant tumour resections, bony infiltrationwas established in histological work-up. MRI and PETanalysis alone were each able to detect these bone infiltrations but were also associated with one false positive diagnosis each in other cases. Finally, the PET-MRI fusion wasable to exclude bone infiltration by matching the suspicious tracer uptake of the PET-scan to the soft tissuetumour site next to the bone and not to the probably periodontal inflamed mandible. In the side-by-side analysis,this case was also rated as “probably infiltrated” because ofinsufficient virtual matching of the two modalities.Results of N-stagingIn total, twenty-seven cases (27/33) were analysed forlymph node metastases to the neck (N-staging). No neckdissection had been performed in five cases of recurrenttumour disease and in one case of fibroxanthoma. Histopathological specimens showed metastases to the cervicallymph nodes (N ) in 16 patients, whereas eleven caseswere free of metastases to cervical lymph nodes (N0).The overall sensitivity and specificity of N-staging on a“per patient” basis for MRI, PET, side-by-side analysisand PET-MRI fusion is represented in Table 3.In the analysis of MRI or PET data alone, 15 out of 16cases were correctly diagnosed with metastatic spread tothe cervical lymph nodes. MRI analysis alone detectedseven N0 necks (7/11) correctly; PET detected ten N0necks (10/11) correctly. Therefore, MRI and PET analysisalone were associated with a positive predictive value of79% and 94% and a negative predictive value of 88% and91%, respectively.In side-by-side analysis of MRI and PET data, twomore N0 necks were detected than in MRI alone. In thefirst case, a missing increased up-take of 18F-FDG inMRI-diagnosed enlarged lymph nodes led to the correctdiagnosis. In another case, an “unsure increased uptake” of 18F-FDG led to the wrong PET-diagnosis butcould be overruled by a clear MRI diagnosis of nonpathological lymph nodes. The side-by-side analysis detected nine N0 necks (9/11) correctly and was associatedwith a positive and negative predictive value of 88% and90%.
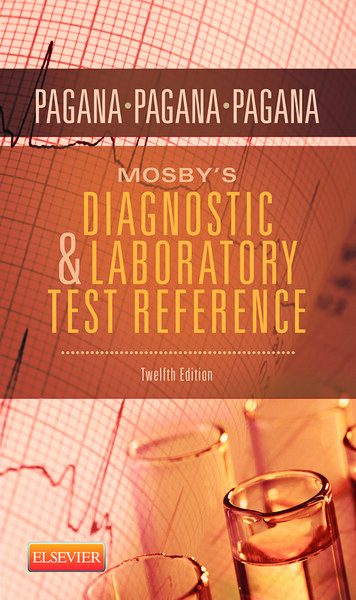
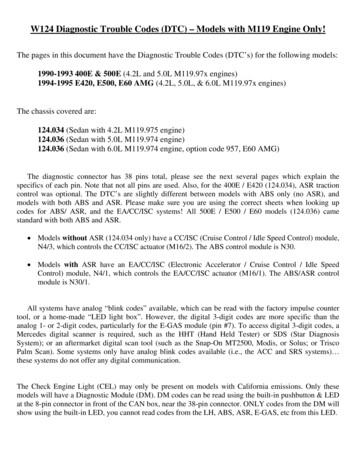
Loeffelbein et al. BMC Cancer 2014, 6Page 6 of 10Figure 1 ROC-curves to compare the accuracy of the different techniques for detection of malignant lesions.Retrospective PET-MRI fusion achieved the same results as the side-by-side analysis.On an N-staging basis, MRI, PET, side-by-side analysisand retrospective image fusion were associated withthe displayed correct diagnosis/over-staging/under-stagingrates in Table 4. All pathological malign lymph nodes thatwere not detected by imaging had a maximal diametersmaller than 10 mm.The ROC-curve is illustrating the performance of all imaging modalities in detection of lymph node metastases tothe neck as a summary statistic (Figure 2). The cut-off pointfor the different methods investigating lymph node evidence was at a score of 4.5 in all methods described. Themost reliable technique was PET imaging (Youden-Index:0.882, AUC: 0.95), directly followed by side-by-side analysisand retrospective image fusion technique (Youden-IndexTable 3 Diagnostic results of nodal staging of the neck(N-staging) in twenty-seven patients on a “per patient”basis (positive vs. negative neck; N vs. edictivevalueNegativepredictivevalueMRI94% (15/16)64% (7/11)79% (15/19)88% (7/8)PET94% (15/16)91% (10/11)94% (15/16)91% (10/11)Side by Side94% (15/16)82% (9/11)88% (15/17)90% (9/10)Fusion94% (15/16)82% (9/11)88% (15/17)90% (9/10)each: 0.882, AUC: 0.941), which however, were not significantly better then the MRI (Youden-Index each: 0.882,AUC 0.935; p 0.05).DiscussionIn order to determine the clinical benefit of PET-MRI fusion in HNC, we have analysed the value of retrospectivePET-MRI fusion and compared the results with side-byside analysis and PET or MRI alone. Although in oursmall patient population no statistically significant differences in the performance of each technique could be determined for local tumour assessment or lymph nodestaging, there was a trend towards a better performance ofmultimodal imaging (side by side analysis or retrospectiveimage fusion) especially in the diagnosis of recurrentHNC and inconclusive findings in the single modality.Based on these data, this finding now has to be confirmedin larger prospective studies.To our knowledge, no previous study has compared thevalue between retrospective image fusion and side-by-sideanalysis up to now. A diagnostic benefit has to be provenfor multimodal imaging, since morphological imaging byusing MRI or CT alone has nowadays reached a high accuracy in patient follow-up and even allows the detailedanalysis of structures such as mucosal invasion [3,23]. Accurate assessment of the local tumour extent is importantfor the surgeon, as the imaging results will determine the
Loeffelbein et al. BMC Cancer 2014, 6Page 7 of 10Table 4 Diagnostic results of nodal staging of the neck (N-staging) in twenty-seven patients by using MRI, PET/CT,side-by-side analysis and retrospective PET-MRI fusion as clinical N-staging with imaging (cN) and correlation to thehistopathological results e/PET-MRI 00002pN2c00002Correct staging: 70.4%Correct staging: 81.5%Correct staging: 81.5%Over-staging: 18.5%Over-staging: 7.4%Over-staging: 11.1%Under-staging: 11.1%Under-staging: 11.1%Under-staging: 7.4%extent of tumour resection, the type of reconstruction andthe adjuvant therapy.In several studies, the beneficial use of PET data inprimary T-staging has been reported [24,25] and has ledto the assumption that PET and MRI analysis furthercomplement each other [6,15]. In our study, one falsenegative and one false positive rating in MRI could bechanged to the correct diagnosis through side-by-sideanalysis and elevated the sensitivity/specificity to 85%/100%. Retrospective image fusion had the highest sensitivity/specificity rates in T-staging of 89%/100%. It wasshown to be of evident value in a suspected recurrenttumour (Figure 3). As is well-known, morphological imaging alone (MRI or CT) in previously operated regions ischallenging due to sometimes difficult differentiation between non-neoplastic and neoplastic change. The reasonsare scar tissue, loss of symmetry, side shift and unspecificcontrast enhancement [5]. PET has gained wide acceptance in staging of suspected recurrent tumour disease, because of its high negative predictive values of up to 95%.On the other hand, it is also associated with false positivefindings shortly after operation and should therefore beFigure 2 ROC-curves to compare the accuracy of the different techniques for detection of cervical lymph node metastases.
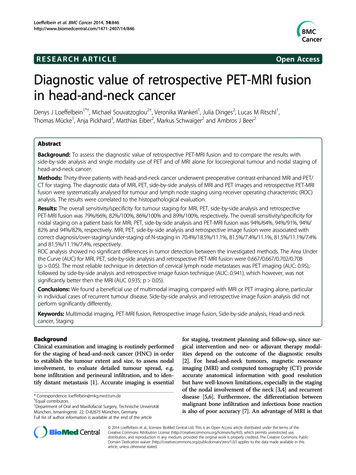
Loeffelbein et al. BMC Cancer 2014, 6Page 8 of 10Figure 3 Beneficial use of retrospective image fusion in a case of recurrent tumour disease. The presented case (no. 27, rpT2 pNx pMx)has suspected recurrent disease after resection of a squamous cell carcinoma of the floor of the mouth and tongue and reconstruction with amicrovascular radial forearm flap and adjuvant radiation. A: The tissue by MRI alone was rated as probably malign, attributable to the abnormalcontrast enhancement in the right posterior site of the floor of the mouth (red arrow). The region near the midline of the residual tongue (whitearrow) was interpreted as an anatomical alteration after surgery and irradiation. B: PET alone showed a moderate increase of tracer up-take nearthe midline and both PET alone and the side-by-side analysis were rated as “probably benign”. C: Retrospective image fusion provided the correctdiagnosis of recurrent tumour disease through the correct alignment of morphological and functional imaging data; however, the disease waspresent not in the dorso-lateral region (histology: scar fibrosis) but near the midline in the residual tongue (histology: SCC recurrent disease).combined with CT or MRI and should be performed at atime interval of 10–12 weeks after surgery [26-28].In our analysis, retrospective PET-MRI fusion in initialtumour staging of primary lesions was of minor advantage compared with a single modality or to the side-byside analysis with regard to T-staging. No significantbenefit of retrospective image fusion was seen comparedwith side-by-side analysis. However, multimodal imaging(fusion and side-by-side analysis) had a tendency forhigher sensitivity compared to MRI or PET alone, although the difference was not significant.Another important aspect of HNC staging is the recognition of tumour invasion of neighbouring structures,such as maxilla or mandible. As described earlier, additional PET data might be beneficial in
ities depend on the outcome of the diagnostic results [2]. For head-and-neck tumours, magnetic resonance imaging (MRI) and computed tomography (CT) provide accurate anatomical information with good resolution but have well-known limitations, especially in the staging of the nodal involvement of the