Transcription
Get more Forex trading strategies and techniques: click hereForex Trading Strategies:Basics 101.March 20111 Sign Up Now to Upshots forex trade signals
Get more Forex trading strategies and techniques: click heredisclaimerThe information provided in this report is for educational purposes only. It is not a recommendation to buy or sell nor should it be considered investment advice. You are responsible for your own tradingdecisions. Past performance is not indicative of future results, as returns may vary according to market conditions.Trading in foreign exchange is speculative and may involve the loss of principal; therefore,assets placed in any type of forex account should be risk capital funds that if lost will not significantlyaffect one's personal financial well being.This is not a solicitation to invest, and you should carefully consider the suitability of yourfinancial situation prior to making any investment or entering into any transaction.Trading foreign exchange on margin carries a high level of risk, and may not be suitable for all investors.The high degree of leverage can work against you as well as for you.Before deciding to invest in foreign exchange you should carefully consider your investment objective,level of experience and risk appetite.The possibility exists that you could sustain a loss of some or all of your initial investmentand therefore you should not invest money that you cannot afford to lose.You should be aware of all the risks associated with foreign exchange trading and seekadvice from an independent financial adviser if you have any doubts.By Federal Mandate, Foreign Currency Traders Must Read This First:Before deciding to trade real money in the Retail Forex market, you should carefully consider whetherthis is the right choice for you. Things to consider are your investment objectives,level of experience and risk appetite. Most importantly, do not invest money you cannot affordto lose, i.e., don't trade forex with money you need to survive.There is considerable exposure to risk in any off-exchange foreign exchange transaction,including, but not limited to, leverage, creditworthiness, limited regulatory protectionand market volatility that may substantially affect the price, or liquidity of a currency or currency pair.Furthermore, the leveraged nature of forex trading means that any market movement willhave an equally proportional effect on your deposited funds. This may work against you as well as for you.The possibility exists that you could sustain a total loss of initial margin fundsand be required to deposit additional funds to maintain your position. If you failto meet any margin requirement, your position may be liquidated and you will be responsiblefor any resulting losses. To manage exposure, employ risk-reducing strategies suchas 'stop-loss' or 'limit' orders.Limitation of Liability:You understand and agree that under no circumstances will Upshot trade signals/ fxsignalsystem.com,it's owners, staff, or members be held liable for any direct, indirect, consequential, incidental,special or exemplary damages for any use of this site or any linked contents,even if we are advised of the possibility of such damages.Your only remedy is to discontinue use of this site.You waive the rights of lawsuit for any damage happened in our site.Information on any/all subjects and matters on this site is subject to change at any time.Upshot trade signals/ fxsignalsystem.com does not guarantee the accuracy of the information providedby it's owner's, staff, or members.Upshot trade signals/ fxsignalsystem.com, it's owners and staff do not provide tradeinformation and advice, nor does it guarantee the accuracy of "signals" or trade advice of any ofits members.-Upshot Trade Signals2 Sign Up Now to Upshots forex trade signals
Get more Forex trading strategies and techniques: click hereBefore I begin I would like to stress that this report will only cover some of the basics.While it might seem a boring subject to those who have been trading for sometime, but having the right understanding of thebasic principals and technical rules are necessary to create a consistent income as a trader.And we must not make the mistake of becoming lazy when working on a chart.The slightest mistake will cause a loss of money.In this report we will review how to properly draw a trend line and how to identify consolidation, specifically(support and resistance).And then we will move into trading strategies and techniques.The strategies can be used on just about any currency pair and are mostly technical set ups in nature however we will reviewhow to apply economic announcements to the signals when they develop.So let's get right to it.3 Sign Up Now to Upshots forex trade signals
Get more Forex trading strategies and techniques: click hereDrawing a trend line.In order to draw a trend line we have to find a place to start. Often times that means looking back in time and perhaps moretime than you can fit on your chart in one window.If the trend has continued for some time, you should switch to a time frame higher.The first example, the chart below is the EUR/USD one hour.You will see several different trend lines as the trend continues.One of the first things a trader will do with a trend line is to quickly identify the most obvious trend line. If the trend line isn'tbroken, then it is easy to assume that the trend is still in tact and for the most part it could continue.Another reason to draw trend lines is to determine when the trend is changing.Below you will notice how simple the trend line looks in the first chart picture below.There are at least two points that touch the trend line to confirm it.Something that most traders will do, is to count the number of times the price has touched and held at the trend line. This helpsto determine the significance of the trend line. Typically, the larger time frames will produce trend lines that have been touchedseveral times and are quite significant.Another useful tip when trying to locate the most significant trend line that could cause a reaction in price is to use theA,B,C,D price swing method. (See more about this technique below)4 Sign Up Now to Upshots forex trade signals
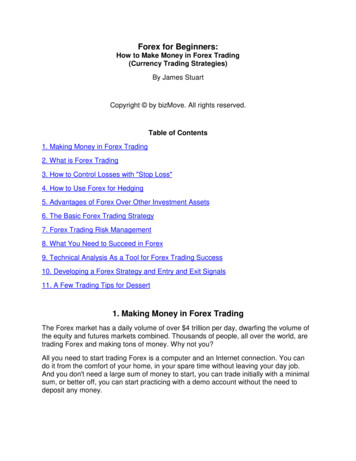
Get more Forex trading strategies and techniques: click hereEUR/USD one hour chart 15 Sign Up Now to Upshots forex trade signals
Get more Forex trading strategies and techniques: click hereThe chart above is pretty easy to read and the trend line shows at least two locations where price touched the trend line fromthe beginning.But lets take a step back and see where this up trend in price actually began. It is important to find the true trend line to see justhow far price has to move through a trend line to confirm a change in price direction.EUR/USD chart 2The chart above is the same time frame as chart 1 but I added much more data and found another trend line.Why is this important?6 Sign Up Now to Upshots forex trade signals
Get more Forex trading strategies and techniques: click hereBecause if you begin to focus on a small area of current price action, you could easy allow yourself to think that a price trend ischanging. If you think right away that a trend in direction is changing just because the trend line has been broke you can make aserious mistake and lose money. There is much more work that needs to be done to confirm that price is definitely changingdirection.Looking at the first chart 1.Price would not have to move too far down, (perhaps 40 or 60 pips in price) to cut through the most recent up trend line.If this happens to the inexperienced, they begin to immediately short this pair. The trouble is that this is not true confirmation(yet) of the trend change.If you begin shorting immediately when price crosses a short term trend line like the one in chart 1, you will could lose as pricefinds some support on the other side of the trend line.Support such as Fibonacci retracement levels or an old resistance level could “become” support. The reason is again, that thefirst chart doesn't show the true measure of the trend itself, where it began, how long it has been trending and where it is likelyto stop and find some resistance.Chart 2 (above) shows a much better idea of where the true trend line runs, but is that one correct?Let's step back further.Below is a third chart using the same currency pair and the same time frame.The candles are getting harder to see but I am trying to illustrate the necessity to take a step back and look at where price hascome from and also to identify support and resistance.7 Sign Up Now to Upshots forex trade signals
Get more Forex trading strategies and techniques: click hereEUR/USD chart 3.In this chart you will now see the original trend line from chart one in the top right corner. Notice how sharp and steep the trendline looks in this chart. That is not a trend line that I would use to identify a reversal in price. It's much too steep and looks like itcould keep moving higher. If price cut through the first up trend line, taking into consideration the information we now see in thisthird chart, I could expect price to find some support and bounce back up, meaning that I would most likely not take any short or“Sell” positions here.8 Sign Up Now to Upshots forex trade signals
Get more Forex trading strategies and techniques: click hereNow the same information can be found by using a time frame higher. Lets look at the 4 hour chart below for the EUR/USD.The chart below shows us just about the same information without having to squeeze in so much data that we can't see thecandle patterns. You will notice that the only trend line I have on this chart is the last one as in chart 3.EUR/USD chart 49 Sign Up Now to Upshots forex trade signals
Get more Forex trading strategies and techniques: click hereNow another way to find out where the trend has changed and shifted directions is to continue looking back in time until you seewhere the trend crossed. In chart 4 which is the four hour chart above, we still don't know for sure if the bottom left where thetrend line began is the actual low or start of the trend.Lets have a look.the next chart below is the same 4 hour chart of the EUR/USD but I squeezed more data into the chart so wecould see back further.EUR/USD chart 5At this point we will leave it here but you can see the importance of finding the source of the trend on the chart and how toidentify the strength based on the angle of the trend.10 Sign Up Now to Upshots forex trade signals
Get more Forex trading strategies and techniques: click hereNow that we have ways of finding the trend lets see how to draw trend lines correctly.In the example below we will be looking at the GBP/USD 4 hour chart.We will start at the present time and identify the trend lines and then analyze the possibilities and the mistakes that can bemade when drawing a trend line.GBP/USD chart 6Please notice at the top right of the chart, there is a white arrow pointing down. I put that there to show how price has foundsome resistance at the bottom side of the up trend line. This is important from a technical perspective! You must draw yourtrend lines correctly and do not become lazy about updating them.In the chart below I will show you the same GBP/USD 4 hour chart but I will show you how the trend lines might have looked afew days back.11 Sign Up Now to Upshots forex trade signals
Get more Forex trading strategies and techniques: click hereGBP/USD chart 7In this chart please look at the bottom left and notice where the trend line started and follow it up to the next arrow. At one time,this is where we had a our trend line and it was the proper placement but as time moves on and price made a new high, wemust go back and adjust the trend line when necessary.The first thing to do when considering whether to adjust the trend line is to confirm a new high or low. We all know the rule.“Two to the left and right must be lower to confirm a high” and the opposite is the rule for confirm a low.12 Sign Up Now to Upshots forex trade signals
Get more Forex trading strategies and techniques: click hereGBP/USD chart 8In the chart above we can see when price made new highs. This is the time to make the change to the up trend line.13 Sign Up Now to Upshots forex trade signals
Get more Forex trading strategies and techniques: click hereGBP/USD chart 9In the chart above, I have made the proper adjustment and again, notice how it shows up in the top right area of chart. Thisagain would be a technical resistance level that would help me determine whether or not I should exercise caution at theselevels.Notice the low I used to draw the up trend line at the arrow pointing up.This is the last price swing before the last spike high. It is the proper place to draw this trend line. If I was lazy about makingadjustments to the trend line and left it in the position I had it before on the chart above, then I might not have had theopportunity to see the potential resistance when price reached the bottom of the up trend line (where price is currently)These rules apply regardless of the time frame used.14 Sign Up Now to Upshots forex trade signals
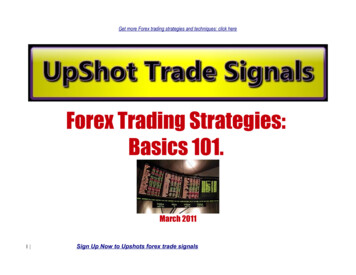
Get more Forex trading strategies and techniques: click hereNow let's talk about support and resistance. Let's take the example above in the GBP/USD chart 9.As you can see there are many levels that could act as support or resistance.Lets strip away some of the unnecessary lines on the chart and start fresh below.We will still use the GBP/USD 4 hour chart.This one is pretty easy. I placed the arrow at the proper support and the lowest level of the consolidation range.Now it might appear obvious to me because I have been doing this a long time but there are a few basic rules that are constantthroughout technical analysis and regardless of the time frames.Chart 1015 Sign Up Now to Upshots forex trade signals
Get more
Forex Trading Strategies: Basics 101. March 2011 1 Sign Up Now to Upshots forex trade signals. Get more Forex trading strategies and techniques: click here disclaimer The information provided in this report is for educational purposes only. It is not a recommendation to buy or sell nor should it be considered investment advice. You are responsible for your own trading decisions. Past .