Transcription
Betel et al. Genome Biology 2010, Open AccessComprehensive modeling of microRNA targetspredicts functional non-conserved andnon-canonical sitesDoron Betel1, Anjali Koppal2, Phaedra Agius1, Chris Sander1, Christina Leslie1*AbstractmirSVR is a new machine learning method for ranking microRNA target sites by a down-regulation score. The algorithm trains a regression model on sequence and contextual features extracted from miRanda-predicted targetsites. In a large-scale evaluation, miRanda-mirSVR is competitive with other target prediction methods in identifyingtarget genes and predicting the extent of their downregulation at the mRNA or protein levels. Importantly, themethod identifies a significant number of experimentally determined non-canonical and non-conserved sites.BackgroundmicroRNAs are a class of small regulatory RNAs thatare involved in post-transcriptional gene silencing.These small (approximately 22 nucleotide) single-strandRNAs guide a gene silencing complex to an mRNA bycomplementary base pairing, mostly at the 3′ untranslated region (3′ UTR). The association of the RNAinduced silencing complex (RISC) to the conjugatemRNA results in silencing the gene either by translational repression or by degradation of the mRNA [1].Reliable microRNA target prediction is an importantand still unsolved computational challenge, hamperedboth by insufficient knowledge of microRNA biology aswell as the limited number of experimentally validatedtargets.Early studies of target recognition revealed that nearperfect complementarity at the 5′ end of the microRNA,the so-called “seed region” at positions 2 to 7, is a primary determinant of target specificity [2]. However, aperfect seed match by itself is a poor predictor formicroRNA regulation due to the large number of random occurrences of any given hexamer in 3′ UTRs.Conversely, a number of studies have shown thatsome target sites with a mismatch or a G:U wobble inthe seed region confer a noticeable regulatory effect[3-5], and a recent study using a cross-linking and* Correspondence: cleslie@cbio.mskcc.org1Computational Biology Program, Memorial Sloan-Kettering Cancer Center,1275 York Avenue, New York, 10065, NY, USAFull list of author information is available at the end of the articleimmunoprecipitation (CLIP) method to study in vivomicroRNA targets found a significant number of noncanonical sites [6,7]. Therefore, perfect seed complementarity is neither necessary nor sufficient for microRNA regulation.Most computational methods require sites to haveperfect seed complementarity ("canonical” sites) [8-10],with only a few methods allowing for G:U wobbles ormismatches in the seed region [11,12] ("non-canonical”sites). Other approaches consider predicted mRNA secondary structure and require energetically favorablehybridization between microRNA and target mRNA[13-15]. However, for the most part, all these target prediction methods generate a large number of predictions,many of which are presumed to be false. To address thisproblem, virtually all computational methods filter predictions by conservation, which eliminates poorly conserved candidate sites from consideration.Several studies have used genome-wide mRNA expression changes following microRNA transfection to elucidate microRNA target specificity rules [8,9,16]. Grimsonet al. defined a four-class hierarchy of canonical seedtypes of differing efficiencies and identified additional“context” features of target sites that correlate (but onlyweakly) with reduced expression levels, in particular theAU content flanking the target site. Using univariateregression between feature scores and expressionchange, they developed a seed-class-dependent scoringsystem called “context score”, which has been incorporated into the TargetScan prediction program. Nielsen 2010 Betel et al; licensee BioMed Central Ltd. This is an open access article distributed under the terms of the Creative CommonsAttribution License (http://creativecommons.org/licenses/by/2.0), which permits unrestricted use, distribution, and reproduction inany medium, provided the original work is properly cited.
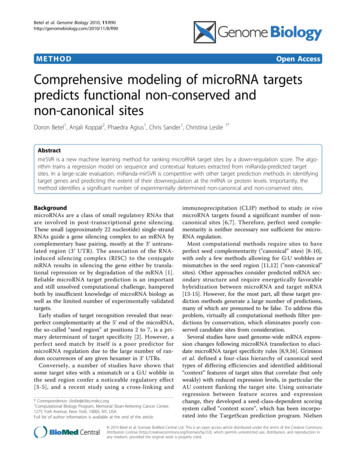
Betel et al. Genome Biology 2010, 11:R90http://genomebiology.com/2010/11/8/R90et al. assessed the significance of similar features by theshift in the cumulative distribution of log expressionratios using the same four-class seed hierarchy. Recently,proteomics studies of protein expression changes inresponse to microRNA transfection and knockdown[17,18] corroborated a number of these specificity features. Importantly, these studies showed that most targets with significantly reduced protein levels alsoexperienced detectable reduction in mRNA levels, indicating that changes in mRNA expression are reasonableindicators for microRNA regulation.Here we present a new algorithm called mirSVR forscoring and ranking the efficiency of miRanda-predictedmicroRNA target sites by using supervised learning onmRNA expression changes following microRNA transfections. mirSVR incorporates target site informationand contextual features into a single integrated model,without the need to define seed subclasses. We use support vector regression (SVR) to train on a wide range offeatures, including secondary structure accessibility ofthe site and conservation.We first compared mirSVR against a number of existing target prediction algorithms using a large panel ofindependent microRNA transfection and inhibitionexperiments as test data. For a fair comparison, we limited consideration to sites with canonical seed pairing inthis analysis. mirSVR performs as well as, and often better than, existing methods for the task of predicting theextent of downregulation of genes at the mRNA or protein level. The miRanda-mirSVR approach effectivelybroadens target prediction beyond the standard notionof seed hierarchy and strict conservation without introducing a large number of spurious predictions. In particular, we found that the mirSVR scoring modelcorrectly identified functional but poorly conserved target sites, and that imposing a conversation filter resultsin a reduced rate of detection of true targets.mirSVR downregulation scores are calibrated to correlate linearly with the extent of downregulation andtherefore enable accurate scoring of genes with multipletarget sites by simple addition of the individual targetscores. Furthermore, the scores can be interpreted as anempirical probability of downregulation, which providesa meaningful guide for selecting a score cutoff. Wefound that the model can correctly identify genes thatare regulated by multiple endogenous microRNAs rather than transfected microRNAs whose concentrations are above physiological levels - by analyzing targetsbound to human Argonaute (AGO) proteins as identified by AGO immunoprecipitation [19]. We also revisited the idea of the seed hierarchy, and found thatdifferent seed types had wide and overlapping ranges ofefficiencies. Finally, we tested the usefulness of includingnon-canonical sites in the model by evaluatingPage 2 of 14performance on biochemically determined sites fromrecent Photo Activatable Ribonucleoside enhanced CLIPexperiments (PAR-CLIP). In this data set approximately7% of the detected sites do not contain perfect microRNA seed match to the expressed microRNAs [7]. Wefound that miRanda-mirSVR indeed correctly identifieda significant number of these experimentally verifiednon-canonical sites. miRanda target sites and mirSVRscores are available at http://www.microRNA.org.Results and discussionmirSVR performance: efficiency of canonical sites and therole of conservationTraining the mirSVR scoring modelThe mirSVR algorithm learns to predict target site efficiency by training on mRNA expression data from apanel of microRNA transfection experiments. Trainingexamples consist of genes containing a single candidatetarget site for the transfected microRNA in the 3′ UTR.Target sites are represented by a set of binary featuresof the predicted miRNA::site duplex as well as local andglobal contextual features (Figure 1), together with itsoutput label, given by the log expression change aftermicroRNA transfection. The local contextual featuresinclude the AU content flanking the target site and predicted secondary structure accessibility at positionsflanking the site, while global contextual features includethe relative position in the 3′ UTR, UTR length, andconservation (see Methods). Different seed types, including non-canonical sites, are therefore represented in aunified manner, and conservation is used as a featurerather than a filter. mirSVR learns the features weightsusing the support vector regression (SVR) algorithm, avariant of the well-known SVM algorithm [20] that usesreal-valued outputs rather than discrete class labels.For all results reported below, we trained mirSVR on aset of nine microRNA transfection experiments performed on HeLa cells from Grimson et al. [8]. We evaluated two different training modes for our model: (1)training only on genes containing a single canonical sitein the 3′ UTR, called the “canonical-only” model; (2)training on genes containing a single canonical or noncanonical site in the 3′ UTR, where we allow non-canonical sites with exactly one G:U wobble or mismatch inthe 6-mer seed region, called the “all-sites” model. Thefirst mode produces a model that is readily comparedwith most existing target prediction methods, which largely assume at least a 6-mer seed match, while the second mode allows us to assess whether we can achievestatistically significant prediction results on non-canonical sites. Consistent with previous studies [8,9], the mostsignificant features are base-pairings at the seed regionand the sequence composition flanking to the seedregion (Additional file 1, Figure S1). Additional features
Betel et al. Genome Biology 2010, 11:R90http://genomebiology.com/2010/11/8/R90Page 3 of 14Figure 1 Features used in the mirSVR model. mirSVR uses features derived from the miRanda-predicted miRNA::site duplex, the local contextof the candidate site, and the global context of the site in the 3’ UTR. Duplex features include a bit representation of base-pairing at the seedregion and the extent of 3’ binding. Local features include AU composition flanking the target site and secondary structure accessibility score.Global features include length of UTR, relative position of target site from UTR ends, and conservation level of the block containing the targetsite.such as conservation, position in the UTR, and UTRlength are weakly correlated with the extent ofdownregulation.mirSVR scores improve ranking of canonical sites overexisting target prediction methodsWe first tested the canonical-only mirSVR predictionmodel, where we restricted consideration to genes withsingle canonical target sites, that is, sites with perfectcomplementarity to positions 2 to 7 of the microRNA.The test data consists of 17 independent microRNAtransfection experiments followed by mRNA expressionprofiling from Linsley et al. [21], five microRNA transfection experiments followed by protein expression measurements from Selbach et al. [17], and threemicroRNA inhibition experiments followed by mRNAexpression profiling [21-23].We compared the performance of the mirSVR modelagainst well-known existing target prediction methodsthat were representative of the different methodologies,namely: TargetScan’s context score [8], which incorporates contextual feature scores estimated from expressiondata from transfection experiments and, like mirSVR,was optimized to predict the expression changes of thetarget genes; miRanda’s alignment score [11,24], whichwas designed to score the quality of the miRNA::siteduplex using dynamic programming and was the firstmethod to incorporate binding at the 3′ end of themicroRNA; and PITA’s energy score [15], derived from asecondary structure based method which computes thedifference between the free energy of the predictedmicroRNA-target duplex and the energetic cost ofunpairing the local secondary structure of the target site.For a general performance measure, we computed theSpearman rank correlation between the observed logexpression change and the prediction score, which givesa general measure of the overall ranking performance ofthe algorithm. It is important to note that for this analysis, we did not filter the potential canonical target sitesfor conservation: mirSVR and comparison methods wererequired to rank all sites with seed matches, whether ornot the sites are conserved. In this sense, we are not performing a typical method comparison of existing targetprediction programs as they are implemented throughvarious web servers. Instead, we are assessing the intrinsic value of different target site scoring systems to predictthe extent of microRNA regulation.Our results show that when trained on canonical seedsites and using our full feature set, mirSVR strongly outperforms the alignment-based (miRanda) and energybased (PITA) scores for the task of ranking single-site
Betel et al. Genome Biology 2010, 11:R90http://genomebiology.com/2010/11/8/R90Page 4 of 14Figure 2 Comparison of mirSVR to other methods. (a) Spearman rank correlation (vertical bars) between prediction and observation forcanonical seed targets as ranked by mirSVR score, context score, alignment score from miRanda and energy score from PITA. Rank correlationswere computed between prediction scores and observed log expression changes for 17 test sets measuring mRNA expression changesfollowing microRNA transfection in different cell lines and genetic backgrounds [21] (brown), five test sets measuring protein expression changesfollowing microRNA transfection [17] (red), and three test sets measuring mRNA expression changes following microRNA inhibition [21,23,41](orange). Ranking by mirSVR scores outperforms that by context scores in 21 out of the 25 test sets. (b) ROC curves (receiver operatingcharacteristic) for mirSVR score versus context score for ranking the top 20% most downregulated targets (defined as true positives) and 20% ofleast downregulated targets (defined as true negatives) for the miR-192 transfection [21]. Shown here are the ROC curves up to 30% falsepositive detection. In this example, in the range shown, for a given false positive rate, mirSVR ranking yields an advantage of up to 10percentage points in the rate of true positive prediction. (c) A summary of this ROC analysis over the 25 test sets, computing the area under theROC curve (AUC) for mirSVR and context score and reporting the difference in performance (mirSVR AUC - context score AUC) for each test set.Overall, mirSVR score shows a statistically significant improvement over context score with a mean AUC of 0.80 as compared to 0.78 andoutperforming context score in 19 (bars above the zero line) out of the 25 test sets (P-value 0.006, signed rank test).
Betel et al. Genome Biology 2010, 11:R90http://genomebiology.com/2010/11/8/R90genes by their downregulation (upregulation) inresponse to microRNA transfection (inhibition), asshown in Figure 2a. We note that the miRanda andPITA alignment scoring systems were not trained ongenome-wide expression data and in particular were notoptimized for the task of ranking expression changes, asassessed here. Therefore, we would not expect thesemethods to perform as well as supervised approachessuch as mirSVR. The context score method is the onlyother approach in our main comparison that exploitstraining data from microRNA transfection experiments.mirSVR performs better than context score in 21 out ofthe 25 test sets, which constitutes a statistically significant improvement (P 0.002, signed rank test). Theinclusion of a conservation measure into the mirSVRmodel does not account for the entire performancegain. After removing the conservation feature, mirSVRstill outperforms context score in 18 out of the 25 testcases, suggesting that the learning algorithm - not justthe inclusion of additional features - contributes to theperformance gain.In addition to the Spearman rank correlation, we compared the performance of mirSVR and context score byan ROC analysis where the true positive and true negative sets are defined as the top and bottom 20% of candidate target genes based on their expression changesfollowing microRNA transfection (or inhibition) (Figure2b). Consistent with the rank correlation results,mirSVR has a larger AUC (area under the ROC curve)than context score in 19 out of the 25 test cases (P 0.006, Figure 2c). The results from both the rank correlation and ROC analysis indicate that mirSVR improvestarget ranking over the context score method for bothreduction of mRNA levels and reduction of proteinlevels.We also did a more limited comparison of mirSVRagainst context score, miRanda, PITA and two additional methods for which we could obtain published target site predictions but had no access to source code:PicTar [10] and Diana-microT [25]. In contrast to ourmain method comparison (Figure 2), here we wererestricted to a limited number of target sites that werepredicted by both additional algorithms, and in particular all sites were required to pass the conservation filterimposed by PicTar. For statistically meaningful results,we considered only experiments for which 50 targetswere scored by all methods. Even when limited to asmall set of conserved targets, mirSVR improves over allother methods in 8 out of 11 experiments in the Linsleyet al. data set when evaluated in terms of rank correlation with extent of downregulation (Additional file 1,Figure S2a); for the other test sets, no experiments contained enough scored targets to make a comparison.Moreover, when assessing the mean log expressionPage 5 of 14change of the top 50 predictions of each method,mirSVR’s top predictions exhibit greater downregulationthan those of any other method (Additional file 1, Figure S2b).mirSVR detects genes with effective but non-conserved sitesPrevious reports have shown that the most downregulated microRNA targets in transfection experiments areenriched for conserved target sites and more generallythat target site conservation correlates with the extentof downregulation [8,9,26]. Many target predictionmethods therefore use a conservation filter to removewhat are assumed to be spurious predictions. We alsofound that increased conservation of the target site iscorrelated with increased suppression of the targetgenes by observing (i) a downward shift in the cumulative distribution of the log expression changes of moreconserved targets (Figure 3a) and (ii) a negative weightfor the conservation feature in the mirSVR model(Additional file 1, Figure S1).However, for the task of detecting the most downregulated targets with single canonical sites in the Linsleyet al. and Selbach et al. test sets, we found that thedetection rate as a function of the number of predictionsdid not improve at any point by imposing a more stringent conservation filter (Figure 3b). If it were a goodidea to filter mirSVR results for conservation, we wouldexpect to see the detection curve for more conservedsites to climb more steeply than the detection curve forless conserved sites; instead, the detection curves forconservation filters all initially climb at the same rate.Eventually, as we run out of conserved sites that are inthe 5% most downregulated set, the more conserveddetection curves plateau at a lower detection rate, showing that a substantial number of downregulated targetsare missed. We note that this effect is not restricted toour particular choice of conservation measure or evento the mirSVR scoring system. We repeated the analysiswith context scores downloaded from TargetScan andusing their associated conservation scores (P CT ) [26]and similarly found no improvement in detection ratesof the most downregulated targets with increased PCTthreshold (Additional file 1, Figure S3). These results,which are consistent with previous work [14], suggestthat conservation should be used in combination withother informative features to score target sites and notas hard filter, which leads to a substantial loss of bonafide targets.A unified scoring model for microRNA target sitesInterpreting mirSVR scores in terms of downregulationThe analysis so far has focused on genes with singlecanonical microRNA target sites for a straightforwardcomparison to existing methods. To obtain a unifiedmodel for a wider range of sites, we retrained mirSVR on
Betel et al. Genome Biology 2010, 11:R90http://genomebiology.com/2010/11/8/R90Page 6 of 14Figure 3 Role of conservation in target prediction. (a) Empirical cumulative distribution of log expression changes of genes with singlecanonical sites for miR-15a, filtered by increasing conservation thresholds. Distributions of more conserved sites display a subtle shift towardsnegative values indicating a slight increase in downregulation of target genes. (b) Detection rate of miR-15a targets defined as genes with asingle canonical miR-15a site that are in the top 5% most downregulated genes (443 genes). Under increasing conservation thresholds, thedetection rate of the most downregulated miR-15a targets drops substantially, showing loss of detection of genes with effective but nonconserved sites. Detection rates were scaled by the maximum number of miR-15a targets identified in the top 5% most downregulated geneswithout conservation filtering (red line).all genes in the Grimson et al. data set containing eithera single canonical target site or a single non-canonicalsite with at most a single G:U wobble or mismatch in theseed region. We confirmed that the “all-sites” mirSVRmodel performed similarly to our “canonical-only”mirSVR model for the task of predicting downregulationof canonical target genes (Additional file 1, Figure S4).We then scored genes in the test data with either single canonical or non-canonical sites and assessed thecorrespondence between mirSVR scores and observedlog expression changes over mirSVR score percentiles.The correlation between the mirSVR scores and theobserved log expression change is non-linear (Figure4a): a small improvement in score corresponds to alarge increase in actual inhibition near the top of themirSVR score range but little change near the bottom ofthe score range. This non-linearity is problematic formodeling genes with multiple candidate sites: in orderto score multi-site genes by summing target site scores,individual site scores must contribute additively to targetinhibition, which will only hold if individual scores correlate linearly with downregulation (Additional file 1,Figure S5). To correct for this effect, we fit a sigmoidtransfer function between mirSVR scores and observedlog expression changes (see Methods) that results intransformed scores that are linearly correlated with logexpression change on both training and test data(Figure 4b) and thus can serve as a proxy for the extentof target downregulation. To better understand the correspondence between mirSVR scores and the efficiencyof downregulation, we used the Linsley data set to estimate a gene’s empirical probability of downregulation,which provides an estimate of the amount of downregulation given a mirSVR score. More precisely, for a given(Z-transformed) log expression reduction a 0 andmirSVR score threshold S, we compute the empiricalprobability that a gene’s expression change y is below orequal to a given that its score f(x) is smaller than orequal to S (Figure 5a). For example, genes that have ascore of -1.0 or lower, corresponding to the top 7% ofpredictions, have more than a 35% probability of havinga (Z-transformed) log expression change of at least -1(downregulation by at least a standard deviation interms of log expression changes) and better than 50%probability of a log expression change of at least -0.5(Figure 5a green and blue curves). Thus, mirSVR scorescan be converted to a probability of downregulation,which can be used as guide for selecting a meaningfulcutoff for reporting target sites. The empirical distributions suggest an intuitive score cutoff of -0.1 or lower,since for scores closer to zero the probability ofmeaningful downregulation drops while the number ofpredictions rises sharply.Seed classes have broad ranges of efficienciesPrevious reports identified four seed types that roughlycorrelate with extent of downregulation (8 mer 7(m8)
Betel et al. Genome Biology 2010, 11:R90http://genomebiology.com/2010/11/8/R90Page 7 of 14Figure 4 Correlation of mirSVR scores with log expression change for genes with single canonical (green) and non-canonical sites(blue). mirSVR scores are divided into equal size bins (percentile) and the mean and standard deviation of the corresponding log expressionchanges are plotted for each bin. (a) Before sigmoid transformation, the mirSVR scores have non-linear correlation with the mean (Ztransformed) observed log expression change of the genes. Canonical target sites are generally more effective sites than non-canonical sites asshown by their more negative mirSVR scores and corresponding log expression change. Where scores for non-canonical sites fall in the samerange as canonical sites, the corresponding mean expression change also fall in the same range, indicating that non-canonical and canonicalsites with comparable scores inhibit their targets with similar efficiency. (b) After transforming with a sigmoid transfer function (fitted on thetraining data), mirSVR scores correlate linearly with log expression change and therefore can be used for analysis of target site efficiency;moreover, transformed site scores can be added to score genes with multiple sites. 7(A1) 6 mer) [27]. After rescaling mirSVR scores tocorrelate linearly with downregulation, we reexaminedthe notion of seed hierarchy in terms of mirSVR scores.Consistent with previous observations, we found thatthe mean mirSVR score by seed type generally agreedwith the reported class hierarchy, namely, that longerseed matches correlate with extent of downregulation.However, each seed type had a broad distribution ofscores, with considerable overlap between the differentseed types (Figure 5b). In particular, there is a largeoverlap between score ranges for 8-mer sites and the 7(m8) sites and only a subtle difference between the 7(A1) and 6-mer distributions. Therefore, the distinctionbetween seed classes and the subsequent rules used torank their efficiency do not correctly capture the rangeof regulatory effect, and the assumption that longercomplementarity in the seed region gives stronger inhibition does not always hold. We propose that our scorebased method, which is independent of seed classification, provides a more meaningful ranking of target sitesefficiency.Predicting the targets of endogenous microRNAsmirSVR correctly extends to genes regulated by multipleendogenous microRNAsSo far we have measured mirSVR performance usingexpression data from microRNA transfectionexperiments. However, overexpression of microRNAs bytransfection experiments may lead to stronger or morewidespread downregulation than observed under physiological conditions and also appears to perturb endogenous microRNA regulation in the cell by out-competingthe endogenous microRNAs for the silencing machinery[28]. In addition, the majority of cells express multiplemicroRNAs at significant levels [29] and most 3′ UTRshave multiple predicted target sites for different microRNAs. It is therefore likely that under physiological conditions many genes are subjected to concurrentregulation by multiple microRNAs, and several targetprediction methods model regulation by multiple microRNA sites [10,25]. To test the performance of themirSVR all-site model on more physiological relevanttargets, we generated another test set from publishedmicroarray data from AGO IP experiments [19]. RNAextracted from AGO1-4 immunoprecipitation was analyzed on a microarray platform and compared to RNAextracted from the washed lysate. The endogenousmicroRNA targets are identified as the set of genes thatare enriched in the AGO-IP relative to the cleared lysateand contained a predicted microRNA target site for theendogenously expressed microRNAs.We included in our prediction set genes with targetsites for any or all of the top six endogenously expressedmicroRNAs (miR-16, miR-19b, miR-30e-5p, miR-32,
Betel et al. Genome Biology 2010, 11:R90http://genomebiology.com/2010/11/8/R90Page 8 of 14Figure 5 Probability of downregulation and seed class distributions derived from mirSVR score analysis. (a) Empirical probabilities ofmicroRNA-mediated downregulation for different mirSVR scores. Using mirSVR prediction scores on the Linsley et al. data, we compute theempirical probability that a gene’s Z-transformed log expression change is below a (a -0.1, -0.5, -1.0, -1.5), conditioned that its (sigmoidtransformed) mirSVR score is less than a threshold S (x-axis). Points on the plot represent mirSVR score cutoffs S and their correspondingprobability P(y a x S). The black curve represents the fraction of predictions with scores equal to or less than the cutoff scores. For example,10% of predicted targets have a score of -0.8 and their expected probability of observing a log expression change of -0.5 is approximately40%. (b) The proportion of the four seed classes: 8-mers, 7m8, 7A1 and 6-mer in equal-size mirSVR score bins. The canonical sites from Linsley etal. were divided into equal size bins and the proportion of the four seed classes is shown by color. As expected the score distribution correlateswith seed type hierarchy (for example, 8-mers have generally more negative mirSVR scores than 7m8 sites). However, inspection of the top 30%predicted target sites (mirSVR score -0.1) highlights the broad overlapping distributions of the four seed types, suggesting that theclassification of target sites to seed
Nov 08, 2010 · METHOD Open Access Comprehensive modeling of microRNA targets predicts functional non-conserved and non-canonical sites Doron Betel1, Anjali Koppal2, Phaedra Agius1, Chris Sander1, Christina Leslie 1* Abstract mirSVR is a new machine learning method for