Transcription
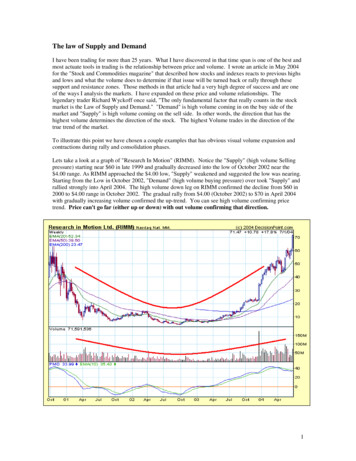
The law of Supply and DemandI have been trading for more than 25 years. What I have discovered in that time span is one of the best andmost actuate tools in trading is the relationship between price and volume. I wrote an article in May 2004for the "Stock and Commodities magazine" that described how stocks and indexes reacts to previous highsand lows and what the volume does to determine if that issue will be turned back or rally through thesesupport and resistance zones. Those methods in that article had a very high degree of success and are oneof the ways I analysis the markets. I have expanded on these price and volume relationships. Thelegendary trader Richard Wyckoff once said, "The only fundamental factor that really counts in the stockmarket is the Law of Supply and Demand." "Demand" is high volume coming in on the buy side of themarket and "Supply" is high volume coming on the sell side. In other words, the direction that has thehighest volume determines the direction of the stock. The highest Volume trades in the direction of thetrue trend of the market.To illustrate this point we have chosen a couple examples that has obvious visual volume expansion andcontractions during rally and consolidation phases.Lets take a look at a graph of "Research In Motion" (RIMM). Notice the "Supply" (high volume Sellingpressure) starting near 60 in late 1999 and gradually decreased into the low of October 2002 near the 4.00 range. As RIMM approached the 4.00 low, "Supply" weakened and suggested the low was nearing.Starting from the Low in October 2002, "Demand" (high volume buying pressure) over took "Supply" andrallied strongly into April 2004. The high volume down leg on RIMM confirmed the decline from 60 in2000 to 4.00 range in October 2002. The gradual rally from 4.00 (October 2002) to 70 in April 2004with gradually increasing volume confirmed the up-trend. You can see high volume confirming pricetrend. Price can't go far (either up or down) with out volume confirming that direction.1
Bema Gold (BGO).BGO is a good example of visual supply and demand. You can see how price increases as volume expands(Red Line) and price declines with volume decreasing (Blue line). The Red lines are "Demand" and theBlue lines are "Supply". If volume is increasing as price is advancing and price is decreasing and volume iscontracting then everything is fine and the trend is in a bull mode. With that in mind one can come to theconclusion that Stocks trend in the direction of the highest volume. Stocks correct or consolidate on lightervolume. By measuring the volume between the swings and compare it to previous swings, one can "See"the force of a particular move developing in the stock. In an uptrend the stock should have higher volumeon the rally phase then the correction phase. In a downtrend the stock should have higher volume on thedeclining phase then the up correction phase. (A "Swing" is a high or low in an issue where it changesdirection.)2
The Nasdaq Composite weekly index ( Compq).Supply and Demand characteristics on the Nasdaq helped to pick out the 2000 top. Notice the low range inAugust of 1999 to the high range in March 2000 and how the volume expanded as prices rallied. Sincevolume expanded as prices rallied, this condition confirmed the up-trend. An interesting developmenthappened on the decline from the late March 2000 high to the April 2000 low and that was that volumeexpanded on that decline. Remember that volume goes in the direction of the true trend. This high volumedecline suggested that the energy (force) had switched from up to down and implied the bull market hadended. After the April 2000 bottom, the Nasdaq made two feeble attempts to rally but both rallies hadweak volume and suggested the rally was not going far. Another decline started in September of 2000 andyou can see volume expanding as the decline progressed and confirmed the downtrend. It's takes practiceto "Eye ball" the rally phases and decline phases and match them with volume expansions and contractionsto determine what direction the markets are really heading.A method I use to identify trends in the market is that I pick out the swings (either Stock or Index) and thenmeasure the force between the swings. The force is the amount of average volume between the swings.By measuring the average volume between the swings and compare it to previous swings, one can "See"the force of a particular move developing in that issue. In an uptrend the stock should have higher force onthe rally phase then the correction phase. In a downtrend the stock should have higher force on thedeclining phase then the up correction phase.3
A trader can add up the volume between the swing high and low and divide by the number of days in thatswing to determine the average daily volume in that swing to determine the force in that swing. Then onewould have to repeat that process with other swings and make a comparience to the other swings todetermine which way the force is pushing, which can get tedious.To measure this force, I developed a software program that does exactly that; it measures the averagevolume between swings. Now with a click of a mouse, I can see the force behind a stock and which waythat force is pushing.After further study, I developed rules for buy and sell signals that have worked very well using this methodof volume analysis.To pick the strongest stock (in up-trend), average daily volume should shrink near 50% on correction phasecompared to the rally phase.To pick the weakest stocks (in downtrend) average daily volume should shrink near 50% on up phasecompared to the declining phase.Definition of a "Swing". A "Swing" is a price high or low where the stock changes direction.Definition of "Ord-Volume". "Ord-volume" measures the average volume between "Swings".A buy signal is triggered when a stock closes above a previous important low, where the current "OrdVolume" low shrinks near 50% or greater against the first important low. An "important Low" is whenthat low marks a bottom where the equity starts a sideways consolidation.A sell signal is triggered when a stock closes below a previous important high where the current "OrdVolume" high shrinks near 50% or greater against the Important High. An Important High" is when thathigh marks a top where the equity starts a sideways consolidation.Target price Projections:An upside target for a buy signal will be the previous "Swing High". If volume is equal or great on the testof the previous high then the next higher swing high will be the target and so on.A downside target after a sell signal will be the previous "Swing Low". If volume is equal or greater thenthe previous "Swing Low" then the next lower swing will be the target and so on.We have included several examples for illustration purposes.4
"Ord-Volume" patterns that lead to buy signals.The first example of a buy signal is BGOPicking a bullish setup for BGO.Starting at price low at 2.14 (Marked "A") and compared it to price low of 2.11 (marked "B"), you willnotice that volume shrank by nearly 50% and shows the down force was weakening. Also notice that "D"leg average volume decline compared to the "C" leg average volume rally shrank by over 50% and showedthe force to the downside was very weak. The rally from "B" to 2.43 had near double the volume and thedecline from 2.43 down to the final low of 1.97 had 1/2 the volume of the previous rally. The Buy signalcomes at a close above the previous low of 2.11.5
The setup for a buy signal is the same. The final leg down to new lows to the 1.32 level was accompaniedby over a 50% reduction in volume. The buy signal came on a close above the previous swing low above1.58. Notice the volume surge of over 500% on the rally after the buy signal and confirmed the bottom.Notice that "Eght" Jumped above the previous highs of mid June with higher volume and implies that high(2.06) should now act as support.6
"Ord-Volume" patterns that lead to sell signals.On YHOO, notice the decline-leg form the 500.13 level had over 300% increase in volume compared to therally-leg into the 500.13. The new increased force to the downside implied the rally phase had come to anend. The rally from the 361 low to the 451.25 high had near 1/2 the volume of the previous leg down tothe 361 level and showed that the force on the rally phase was near 1/2 of the decline phase. The sellsignal comes on a close below the previous low of 361.7
RYL had near 1/2 the volume on the rally going into the 93.47 high compared to the volume coming downfrom the 92.74 high. This condition showed the force had switched from up to down. The sell signalcomes on a close below the previous swing high of 92.74. The first downside target would be the previouslow at 70.35. Interestingly, on the test of the 70.35 low, "Ord-Volume" shrinks in 1/2 and a buy signal istriggered on a close above the previous low of 70.35. Upside target is again the previous high in the 94range.As you can see from the examples above that Volume is a very important ingredient to determine directionof an issue. I hope you find this article useful in your future analysis of stocks and indexes.All the Best,Tim OrdThe Ord Oraclewww.ord-oracle.com (402-486-0362)8
for the "Stock and Commodities magazine" that described how stocks and indexes reacts to previous highs and lows and what the volume does to determine if that issue will be turned back or rally through these support and resistance zones. Those methods in that article had a very high degree o