Transcription
Power System Reliability Analysis with Distributed GeneratorsbyDan ZhuThesis submitted to the faculty ofVirginia Polytechnic Institute and State Universityin partial fulfillment of the requirements for the degree ofMaster of ScienceInElectrical EngineeringApproved:Dr. Robert P. Broadwater, ChairmanDr. Ira JacobsDr. Timothy PrattMay, 2003Blacksburg, VAKeywords: power system reliability, distributed generator, set, segment,circuit traces.
Power System Reliability Analysis with Distributed GeneratorsbyDan ZhuCommittee Chairman: Dr. Robert P. Broadwater,Electrical EngineeringAbstractReliability is a key aspect of power system design and planning. In thisresearch we present a reliability analysis algorithm for large scale, radiallyoperated (with respect to substation), reconfigurable, electrical distributionsystems. The algorithm takes into account equipment power handling constraintsand converges in a matter of seconds on systems containing thousands ofcomponents.Linked lists of segments are employed in obtaining the rapidconvergence. A power flow calculation is used to check the power handlingconstraints. The application of distributed generators for electrical distributionsystems is a new technology. The placement of distributed generation and itseffects on reliability is investigated. Previous reliability calculations have beenperformed for static load models and inherently make the assumption that systemreliability is independent of load. The study presented here evaluates improvementin reliability over a time varying load curve. Reliability indices for load points andthe overall system have been developed. A new reliability index is proposed. Thenew index makes it easier to locate areas where reliability needs to be improved.The usefulness of this new index is demonstrated with numerical examples.
AcknowledgementsI would like to acknowledge the invaluable guidance, concern and supportof my advisor, Dr. Robert Broadwater. During this research, he always acceptedmy ideas with an open mind and gave me the maximum opportunity to contributeto the program. His advice really helped me to refine the application.I would like to thank Electric Distribution Design (EDD) Inc. for providingfacilities to finish this research work, and Electric Power Research Institute (EPRI)Distribution Engineering Workstation (DEW) for benchmark analysis of the powerflow calculations.Thanks are also due to Dr. Jacobs and Dr. Pratt for serving on mycommittee. They both helped to review my thesis paper.My husband, Max, deserves special thanks. His unselfish support andencouragement has allowed me to keep my perspective during this time.iii
Table of Contents1. Introduction . 11.1. Introduction . 11.2. Objective of the Research 11.3. Distributed Generators . 21.4. Literature Review . 31.5. Definition of Power System Reliability 41.6. Reliability Assessment Techniques . 52. Measuring Service Quality . 72.1. Definitions of Performance Indices . 73. Comparison of Different System Designs . 93.1. Simple Radial Distribution System 93.2. Alternative Feed Distribution Arrangement .103.3. Alternative Feed Arrangement with DR . 104. Switching Operations . 125. Reliability Analysis Sets . 145.1. Segment . 145.2. Reliability Analysis Sets . 156. Pointer and Circuit Traces . 216.1. Workstation Circuit Model .216.2. Pointers . 226.3. Circuit Traces . 247. Computer Algorithm . 287.1 Introduction . 287.2 Algorithm .28iv
7.3 Power Flow Calculation . 367.4 Software Design . 388. Reliability Indices .428.1. Functional Characterization . 428.2. Reliability Indices Calculation . 438.3. Relative Reliability Index . 459. Distributed Generator Placement . 4810. Case Studies . 4910.1. Introduction . 4910.2. Case Study One . 4910.3. Case Study Two . 5810.4. Case Study Three 6111. Conclusions and Further Research . 6511.1. Conclusions 6511.2. Further Research . 6612. References . 67Appendix A . 69Vita . 80v
List of FiguresFigure 1.1 Subdivision of System Reliability .5Figure 3.1 Simple Radial Distribution System .9Figure 3.2 Alternative Feed Distribution Arrangement .10Figure 3.3 Alternative Feed Arrangement with DR .11Figure 4.1 Sample Circuit . .13Figure 5.1. Sample segment . .15Figure 5.2. Reliability Analysis Sets . .16Figure 6.1 Sample Circuit . .25Figure 7.1 Illustrating Selection of Alternative Feed .34Figure 7.2 Reliability Analysis Algorithm Sequence Diagram 39Figure 8.1 Example Circuit for Relative CAIDI .46Figure 10.1 System 1 for Case Study One .50Figure 10.2 System 2 for Case Study One: Adding an Alternative Feed .53Figure 10.3 System 3 for Case Study One: Adding a DistributedGenerator . . .56Figure 10.4 System for Case Study Two . 58Figure 10.5 Addition of Substation and DG to System Shownin Figure 10.4 . . 59Figure 10.6 DG at the End of Circuit . .60Figure 10.7 Circuit for Case Study Three .62Figure 10.8 Down Time Variation with Varying Load of L C32 . 63Figure 10.9 Down Time with Varying Load of L C32 .64vi
List of TablesTable 6.1 DEW Component Trace Structure Element 23Table 7.1 Summary of Traces Used to Develop the RA Sets .36Table 7.2 Summary of Messages in the RA Sequence Diagram .40Table 10.1 Equipment Index Table . 51Table 10.2 Improvement of Reliability . .55Table 10.3 Comparison of Reliability Improvements .57Table 10.4 System Reliability Improvement for Case Study Two . 61vii
1. Introduction1.1. IntroductionThe economic and social effects of loss of electric service havesignificant impacts on both the utility supplying electric energy and the endusers of electric service. The cost of a major power outage confined to onestate can be on the order of tens of millions of dollars. If a major poweroutage affects multiple states, then the cost can exceed 100 million dollars.The power system is vulnerable[1]to system abnormalities such as controlfailures, protection or communication system failures, and disturbances,such as lightning, and human operational errors. Therefore, maintaining areliable power supply is a very important issue for power systems design andoperation.This thesis presents the research efforts and the softwareimplementation of a reliability analysis algorithm for electrical powerdistribution systems. This algorithm is used to study reliabilityimprovements due to the addition of distributed generators. This algorithmalso takes into account system reconfigurations.1.2. Objective of the ResearchOne objective of this research is to evaluate power system reliabilityanalysis improvements with distributed generators while satisfyingequipment power handling constraints. In this research, a computeralgorithm involving pointers and linked list[2] is developed to analyze the1
power system reliability. This algorithm needs to converge rapidly as it is tobe used for systems containing thousands of components. So an efficient“object-oriented” computer software design and implementation isinvestigated.This algorithm is also used to explore the placement of distributedgenerators and how the different placements affect system reliability, whichhas not been done in previous research. This exploration makes possible thecomparison of alternative system designs to discover systems yieldingdesired reliability properties.In this paper, variation of power system reliability with the varyingloads is also investigated. Other publications of distribution systemreliability analysis associated with time varying loads have not been found.1.3. Distributed GeneratorsDistributed generators (also known as Distributed Resources) come inmany forms including gas turbine driven synchronous generators, windpowered induction generators, fuel cells with inverter circuitry, and others.The use of distributed resource generation is projected to grow. This growthis due to cost reductions available with distributed generators. The costreductions may be the result of released system capacity or reductions ingeneration costs at peak conditions.2
1. 4. Literature ReviewPrior to the 1960’s, the reliability of proposed power systems wasoften estimated by extrapolating the experience obtained from existingsystems and using rule-of-thumb methods to forecast the reliability of newsystems[3].During the 1960’s considerable work was performed in the field ofpower system reliability and some excellent papers were published. Themost significant publications were two company papers by a group ofWestinghouse Electric Corporation and Public Service and Gas Companyauthors[3],[4]. These papers introduced the concept of a fluctuationenvironment to describe the failure rate of transmission system components.The techniques presented in these papers were approximations whichprovided results within a few percent of those obtained using moretheoretical techniques, such as Markov processes. The application ofMarkov Chains in the power system reliability field was illustrated inReference [5]. The Markov approach is limited in application because ofcomputer storage requirements and the rounding errors which occur in thesolution of large systems.Most previous publications have focused on transmission systemreliability. This research focuses on distribution system reliability. This workextends previous research[5], which demonstrated sets used in describingpower system reliability calculations. Reference [6] presented the firstapplication to apply linked lists and pointer concepts to reliability analysis. It3
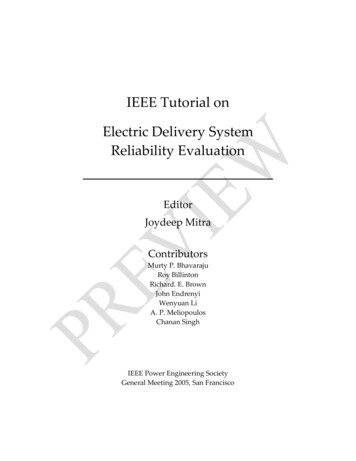
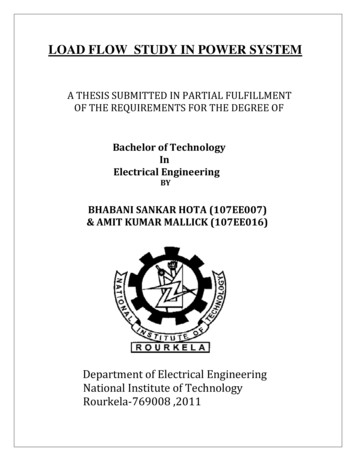
took into account constraints associated with switching operations, but it wasrelatively slow due to running numerous power flow calculations.One aspect investigated h ere is the effect of Distributed Generators(DG) on power system reliability. Standards for connecting DGs intodistribution systems are just being developed. Reference [7] deals withissues related to existing DG interconnection practices. An investigation ofeleven utilities and industry interconnection standards was performed toidentify the key requirements for a DG connection. The results of thisinvestigation led to the development of a unified approach for determininginterconnection requirements. Reference [8] considers many aspects of DGsin distribution systems, including protection, harmonics, transients, voltageand frequency control. A Power flow calculation based on the positivesequence model of the distribution circuits was presented.1.5. Definition of Power System ReliabilityThe function of an electric power system is to satisfy the system loadrequirement with a reasonable assurance of continuity and quality. Theability of the system to provide an adequate supply of electrical energy isusually designated by the term of reliability. The concept of power-systemreliability is extremely broad and covers all aspects of the ability of thesystem to satisfy the customer requirements. There is a reasonablesubdivision of the concern designated as “system reliability”, which isshown in Figure 1.4
Figure 1.1 Subdivision of System ReliabilityFigure 1 represents two basic aspects of a power system: systemadequacy and security. Adequacy relates to the existence of sufficientfacilities within the system to satisfy the consumer load demand. Theseinclude the facilities necessary to generate sufficient energy and theassociated transmission and distribution facilities required to transport theenergy to the actual consumer load points. Security relates to the ability ofthe system to respond to disturbances arising within that system. Security istherefore associated with the response of the system to perturbations[9]. Mostof the probabilistic techniques presently available for power-systemreliability evaluation are in the domain of adequacy assessment. Thetechniques presented in this paper are also in this domain.1.6 Reliability Assessment TechniquesReliability analysis has a wide range of applications in the engineeringfield. Many of these uses can be implemented with either qualitative orquantitative techniques. Qualitative techniques imply that reliabilityassessment must depend solely upon engineering experience and judgment.5
oreinforceengineering judgments. Quantitative techniques describe the historicalperformance of existing systems and utilize the historical performance topredict the effects of changing conditions on system performance. In thisresearch, quantitative techniques combined with theoretical methods areused to predict the performance of designated configurations. The systemsconsidered in this research are radially operated[10] with respect tosubstations, but are reconfigurable.6
2. Measuring Service Quality – Performance IndicesA basic problem in distribution reliability assessment is measuring theefficacy of past service. A common solution consists of condensing theeffects of service interruptions into indices of system performance. TheEdison Electric Institute (EEI), the Institute of Electrical and ElectronicsEngineers (IEEE), and the Canadian Electric Association (CEA) havesuggested a wide range of performance indices[11]. These indices aregenerally yearly averages of interruption frequency or duration. Theyattempt to capture the magnitude of disturbances by load lost during eachinterruption.2.1. Definitions of Performance IndicesSAIDI (system average interruption duration index) is the averageinterruption duration per customer served. It is determined by dividing thesum of all customer interruption durations during a year by the number ofcustomers served.SAIDI sum of customer interruption durationstotal number of customers7
CAIDI (customer average interruption duration index) is the averageinterruption duration for those customers interrupted during a year. It isdetermined by dividing the sum of all customer interruption durations by thenumber of customers experiencing one or more interruptions over a one-yearperiod.CAIDI sum of customer interruption durationstotal number of customer interruptionsThese two performance indices express interruption statistics in terms ofsystem customers. A customer here can be an individual, firm, ororganization who purchases electric services at one location under one rateclassification, contract or schedule. If service is supplied to a customer atmore than one location, each location shall be counted as a separatecustomer.8
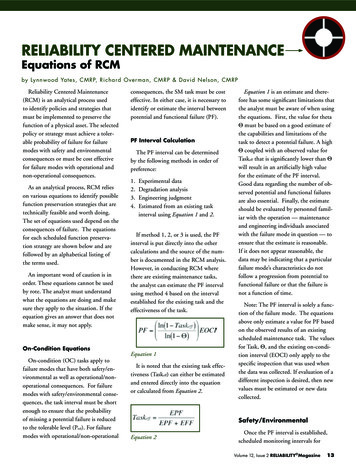
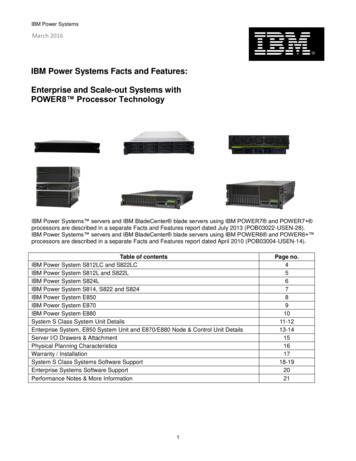
3. Comparison of Different System DesignsOf paramount interest in any reliability study is ensuring a goodquality of service to customers defined as a combination of availability ofthe energy supply and the quality of the energy available to the customers(Medjoudj, 1994). In the following sections we will discuss the reliability ofthe power supply for three kinds of situations. We will show howreconfiguration and alternative sources improve the reliability of the powersystem.3.1. Radial Distribution SystemFigure 3.1 shows a simple Radial Distribution System. In this systema single incoming power service is received and distributes power to thefacility.Figure 3.1 Simple Radial Distribution SystemThere is no duplication of equipment and little spare capacity istypically included. Failure of any one component in the series path betweenthe source and the load will result in a power interruption to at least all loadsdownstream of the failed component.9
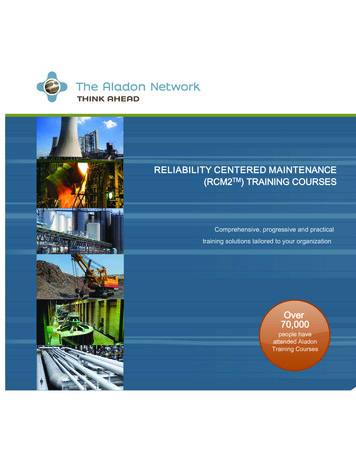
3.2. Alternative Feed Distribution ArrangementA second distribution arrangement is used for facilities requiring morereliable power. Figure 3.2 is a diagram representing this system arrangement.Part of the load is connected to one source and the other part of the load isconnected to a second power source.Figure 3.2 Alternative Feed Distribution ArrangementThe circuits (one circuit fed by S0 and the other fed by S1) are tiedtogether through a normally open tie-switch, with both power sourcesenergized. The electrical equipment is designed to accommodate 100% ofthe facility load. For instance, when a failure occurs in source S0, after thefailure is isolated by opening the circuit breaker, the tie-switch is closedallowing the complete load to be served from a single source until theproblem is corrected. Most customers can be restored immediately and don’thave to wait until S0 is repaired.3.3. Alternative Feed Arrangement with DRWe can improve the reliability further by adding a distributed resource(DR) into the circuit, as indicated in Figure 3.3. In case the failure occurs on10
the left hand side of SW0, we can open SW0 and close SW3, so that the DRcan pick up the rest of the circuit, which was originally fed by S0. Withoutthe DR, we have to draw the power from S1. Such operation might violatesystem constraints or degrade the quality of the power supply, especiallywhen the customer load reaches a peak value.Figure 3.3 Alternative Feed Arrangement with DR11
4. Switching OperationsReliability analysis for a power system also leads to more reliable andcost-effective operation, since power restoration analysis is a subset of thecalculations performed for reliability analysis. Here we assume switchoperation time is less than repair time, so loads that have lost power may berestored faster by appropriate switching operations, or reconfiguration of thesystem.There are two kinds of switching operations of interest. One isisolating the failure point so that a load point of interest which has lostpower may be re-supplied from the original source. The other is to againisolate the failure point and to feed a load point of interest from an alternatesource, if an alternate source is available. For example, in Figure 4.1, if afault happens in component 5, we can open switch SW4 to isolatecomponent 5 from the rest of the system. The original source S0 can stillsupply power to all the customers, except those on the downstream of switchSW4.12
Figure 4.1 Sample CircuitThe second kind of switching operation isolates the failure point andinterrupts the original power supply to the load point of interest. In this casewe need an alternate feed to restore power to the load point of interest. Forinstance, if component 2 in the example circuit has a permanent fault, thefault can be isolated by opening B1 and SW14. In case there is no alternatesource, all the segments downstream of the failed zone can only be restoredafter the fault is repaired. Since we have an alternate source S1 (assuming S1can supply the power and the alternative feed path can carry the power),downstream of SW14 can be restored by closing SW25. The restoration timefor this part of the system is shorter with switching operations than with therepair operation.13
5. Reliability Analysis Sets5.1. SegmentIn essence, there are two configurations in a distribution system. Oneconsists of lines, transformers, and other components that are directlyresponsible for transmitting power from the distribution substation tocustomers. The second one consists of fuses, reclosers, circuit breakers, etc.This interrelated network is designed to detect unusual conditions on thepower delivery system and isolate the portions of system that are responsiblefor these conditions from the rest of the network. The location of protectionor isolation components on the distribution system and their response tofailures can have an important impact on the reliability indices. We willsectionalize the distribution system into segments by these protection andisolation components. In the following pages, the power system is notmodeled in terms of components but segments. A segment is a group ofcomponents whose entry component is a switch or a protective device. Thissectionalizing device isolates groups of components into indivisible sections.Each segment has one and only one switch or protective device.In Figure 5.1, the only protection on the feeder is the station breaker.The failure of any of the components in this segment can cause aninterruption at load point 1. It is the same for the other load points (2, 3, 4,and 5). No temporary restoration is possible. For this configuration, thereliability of all the load points (1, 2, 3, 4, and 5) is identical.14
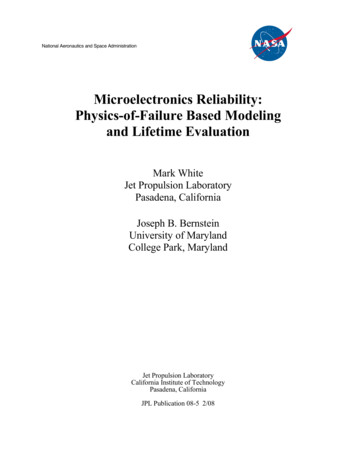
Figure 5.1. Sample segmentA segment’s name is the same as that of its sectionalizing device. InFigure 5.1, there is only one segment, which is segment B. Breaker B andcomponents 1, 2, 3, 4 and 5 all belong to segment B.Modeling the power system in terms of segments speeds up thereliability index calculations. The algorithm can be programmed to run fastersince only the sectionalizing devices are processed without processing theintermediate components.5.2. Reliability Analysis SetsIn order to analyze the reliability of distribution systems, the ElectricPower Research Institute (EPRI) defined sets[11]needed for calculating thereliability of a given load point. Figure 5.2 illustrates the relation amongthese sets.15
Figure 5.2. Reliability Analysis SetsIn reliability analysis, the failure of all elements that can cause a lossof service to a particular load point must be considered. (This load point willbe presented in terms of a segment, which is the segment of interest S.) Allsystem components are either located on the continuous path between thesource and the segment of interest, or not located on the path. The failure ofall continuous path components can cause an interruption at the load point.And the failure of components not in the path can also cause an interruptionat the load point, unless the component is separated from the path by aprotective device that responds automatically to the component failure. Theeffects of nonseries elements and temporary restoration are now consideredin the sets shown in Figure 5.2, as will now be explained.16
The L set shown in Figure 5.2 contains all segments within a circuitwhose failure can cause loss of power to the segment of interest S. This L setincludes all segments that are not separated from the continuous pathbetween the source (substation, generator, etc.) and the segment of interest Sby an automatic protection device.Now we partition the L set into the sets SSL and NSSL: The SSL set consists of the segments that may be isolated from thecontinuous path between S and the original source The NSSL set consists of the segments that cannot be switched awayfrom the continuous path between S and the original source.The SSL set contains any segments separated from the continuouspath by manually operated switches. If any element of this set fails, thesegment of interest S can be temporarily restored from the original sourcebefore the failed component is repaired or replaced.Examining those segments that cannot be separated from thecontinuous path, we can further partition the set NSSL into SL and NSL: The SL set consists of the segments that can be switched away fromthe segment of interest S, so that if the failure occurs in the SL set, Smay be fed by an alternate source17
The NSL set consists of the segments that cannot be switched awayfrom the segment of interest S. That is the segment of interest itself,so this set only contains the element {S}.If any thing fails in the NSL set, all the components within thatsegment have to experience the full repair or replacement time of the failedcomponent. Temporary restoration is not possible.Considering the SL set, we can divide it into SAF and NSAF: For the SAF set, if the failed component lies in these segments, it ispossible to restore power to S by an alternate source For the NSAF set, if the failed segment belongs to this set, thesegment of interest S cannot be temporarily restored from an alternatefeed.The set SAF contains the segments that can be isolated from both thesegment of interest S and the alternative source, which make the temporaryrestoration topologically possible. Sometimes, system constraints may limitthe restoration options; the alternate source might not have the capacity tosupport the particular load point that of interest. So the set SAF is partitionedinto SF and NSF: The SF set consists of all segments that can be isolated from S and analternative source, allowing power to be restored to S from the18
alternative source (for segments in this set, system constraintviolations do not occur during the restoration) The NSF set consists of all segments which may be isolated from Sand an alternative source, but for which it is not possible to restorepower to S because of violating system constraints.The set L, including all the segments for calculating the reliability indices, isdecomposed into a number of sets as given byL SSL NSSL;(5.1)NSSL SL {S};(5.2)SL SAF NSAF;(5.3)SAF SF NSF(5.4)Equation (5.1), (5.2), (5.3) and (5.4) yieldL SSL SF {S} NSAF NSF(5.5)To sum up, if the failed component from the L set is placed in the SSLset, it is possible to restore power to the load point of interest S from theoriginal source. If the failure occurs in the SF set, the power can be restoredto S from an alternative source without violating system constrains. But if19
the failed component locates in either {s}, NSAF or NSF sets, then the failedcomponent must be completely repaired before power can be restored to S.We use several additional reliability analysis (RA) sets to calculate thesets of Equation (5.5), as given bySIC a set of all the segments in the circuitSW a set of all the sectionalizing devices in the circuitAF a set of available alternate sourcesIS a set of sectionalizing devices that will isolate the segment of interest Sfrom the original sourcesNIS a set of switches that do not isolate the original source from thesegment of interestEC a set of ending components for the circuitPD a set of protective devices in the circuit that isolate a load point ofinterest from its source.20
6. Pointer and Circuit Traces6.1. Workstation Circuit nEngineeringWorkstation, DEWorkstation, provides an engineering environment that isfocused on the design and analysis of electric distribution systems[12].DEWorkstation is used in the research here.Reliability analysis is complicated by a number of factors. One ofthese is the size of distribution systems. Large metropolitan areas maycontain thousands of devices with several separate circuits supplied bydifferent substations. Calculation of reliability for a system is an extensivelogistical problem. Fundamental to reliability improvement is manipulationof large amounts of interrelated data. This data includes distribution systemconfiguration, system fault protection, customer density, failure rate andrepair time. The methods with which this data is stored, displayed andmodeled determine the effectiveness of the computerized method. InDEWorkstation, information about the distribution system under study ispermanently stored in data base tables. Initialization of the environmentresults in the most commonly used circuit model data being loaded into theworkstation active memory[13]. This data is immediately available to andshared by application modules, such as the reliability analysis application. Inthis way, the number of accesses to the relational database is minimized. Themost commonly used application modules run entirely in high speedmemory and do not have to access the hard disk. This approach providesrapid graphical display operations and engineering analysis computation.21
6.2. PointersWith large amounts of data in active memory, data structuremanipulation is a primary concern. A feature of the C language which has asignificant impact on this problem is the pointer. The pointer is a variablethat holds the address of a data element. Pointers permit the construction oflinked lists of data elements in computer memory [14]. In DEWorkstation,pointers are used for all data objects. Applications share circuit informationvia pointers, and also use pointers to manipulate data objects hidden insidethe applications.In distribution systems, a single circuit model may contain over 5000components, and an entire system model consisting of hundreds of circuitsmay contain over a million components. With such large systems, modelingmethods have a direct impact on the ability to perform engineering analysis.Use of pointers in linked lists allows system interconnects and equipmentparameters to be directly available for analysis without repetitive searchalgorithms. Intrinsic in the graphical creation of the circuits is the creation oflinked lists. The DEWorkstation memory model links together sources andcomponents of each circuit[15]. In this way, it is possible to trace from circuitto circuit, through an individual circuit, or through a particular branch of acircuit.Application programmers work with DEWorkstation defined objects.These objects are manipulated and accessed via poin
Power System Reliability Analysis with Distributed Generators by Dan Zhu Committee Chairman: Dr. Robert P. Broadwater, Electrical Engineering Abstract Reliability is a key aspect of power system design and planning. In this research we present a