Transcription
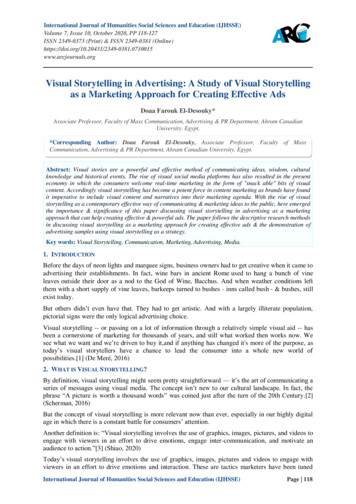
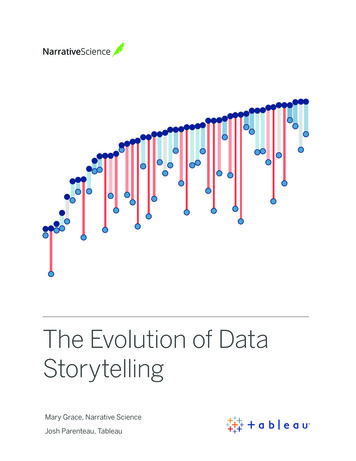
The Evolution of DataStorytellingMary Grace, Narrative ScienceJosh Parenteau, Tableau
“Whenever I speak with successful analytics people—and I do that all the time—it’s usually not long beforethey mention the phrase ‘telling a story with data.'”—TOM DAVENPORT, THE DISTINGUISHED PROFESSOR,AUTHOR, AND THOUGHT LEADER ON DATA AND ANALYTICSIntroductionThese days, data storytelling is top of mind for data explorers of all types. These includebusiness users looking for intuitive analytics, analysts sharing findings with non-technicalusers, and even vendors who claim their platform tells data stories best. Yet the definition andtechniques used to create stories have varied substantially. They’ve also matured over time inboth level of sophistication and automation.In fact, data storytelling has evolved alongside the development of better data analytics tools. Inthe beginning, people manually extracted their data and published analysis. Then came the eraof annotated, interactive storyboards and contextual insights. And today, we are advancing yetagain with the rise of automated generation of narrative insights and reports.Here’s a look at how our data-storytelling capabilities have grown over the years.Traditional Reporting: Where's the Story?People have always told stories with data. In World War II, human "computers" stationed in theUS would crunch numbers regarding temperature and air density. They would manually compilethe analysis into tables, then publish and send the results for use in the battlefields. Thisinformation helped soldiers understand how certain conditions affected their artillery.Soon after came the transformation of the analog to the digital, ushering in the birth of themainframe. Data became more available and advances in computational power allowed us tobetter understand it. Fast-forward to the beginning of this century, to a time of heavily-stacked,IT-authored reporting systems. The resulting reports informed employees about the driversimpacting their business.2
Throughout the past few decades, the objective has not changed: Find answers to the questionsplaguing the people who need to be informed or make decisions: What is at risk and why? Howis my team performing? How can we increase revenue while decreasing costs?But it took too many resources to find these answers. "Human computers" equated to hundredsof people. Massive data infrastructures required significant investment. And traditionalreporting systems demanded specialized skillsets to get up and running. This left the majorityof employees who were asking critical questions beholden to report authors. And those authors,buried under countless requests and equipped with inflexible tools, couldn’t meet those requestsin a timely manner.When those requests were met, answers came in a data table, a cube, a report, or a staticdashboard. None conveyed a story on its own, leaving the consumer to wonder, “What am Ilooking at, exactly, and what action am I supposed to take here?” The means of communicationplaced much of the burden on each individual to interpret the data. As a result, each user’sinterpretation of the report led to inconsistent results. Or the story remained hidden in the databecause the end user was reluctant to perform the manual work necessary to understand it.Abysmal, stagnant adoption rates of traditional reporting systems prompted the question: Isn’tthere a better way to disseminate and consume information? Where’s the story?Data Visualization & Discovery: The Rise of DataStorytellingThings have improved drastically in the last decade with the arrival of interactive datadiscovery capabilities and dynamic visualizations. These tools meet the demands of businesspeople seeking greater control over their analysis and better access to consumable content. Allusers, regardless of skillset, have become empowered to ask and answer their own questionsand limit their reliance on IT.With the pervasiveness of the cloud, these employees can now get started quickly without asubstantial investment. Power users have also greatly benefitted from self-service offerings.They can now blend multiple data sets for more robust analysis. They can leverage advancedanalytics to predict future outcomes. And they can create rich visualizations to highlightinsights that remain hidden when looking at the data or report table alone.Visualizations themselves have become a means to express a vivid story with the data. Staticdashboards and canned reports of the past failed to meet the data-storytelling mark. Thestory was either too simple (and often misleading due to the misrepresentation of measuresand dimensions) or too complicated (and unable to be interpreted by the everyday viewer). Andwhatever the story, it quickly became outdated as it couldn’t be updated in real-time.3
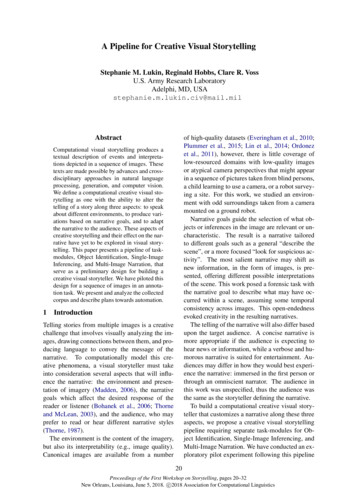
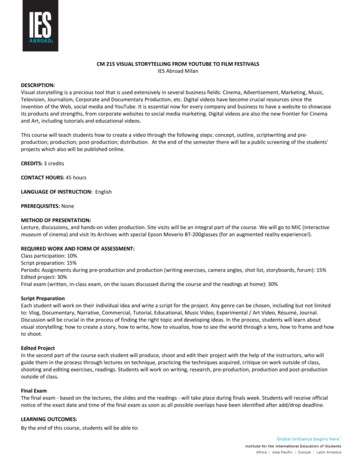
With interactive visualizations, all users can participate in the discovery process and, using theintuitive interface, immediately uncover patterns in the data. The best part? Data storytellingnow contains, well, an actual story. Anyone can share insights by creating storyboards thatprovide further context to the insights contained in the charts and graphs.Tableau's Story Points feature, for example, lets users create compelling and interactive datastories. Users can write annotations to accompany specific visualizations in a sequentialpresentation. This approach provides deeper context and brings the insights to life via anexplanatory narrative.Tableau Story PointsThe use of tools like Story Points to communicate insights is light years beyond the era whenstatic reports ruled the world. But someone must still manually explore the data and discoverthe insights necessary to craft a meaningful story. What if there was a way to introduceartificial intelligence to help the end user uncover new insights and tell a more comprehensiveand consistent story in a scalable way?4
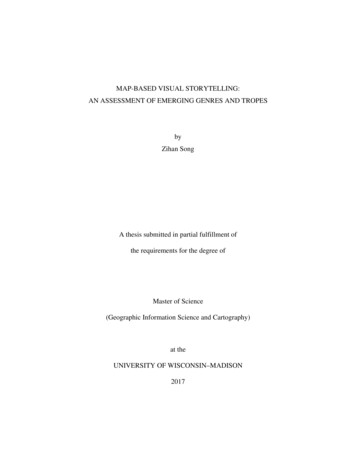
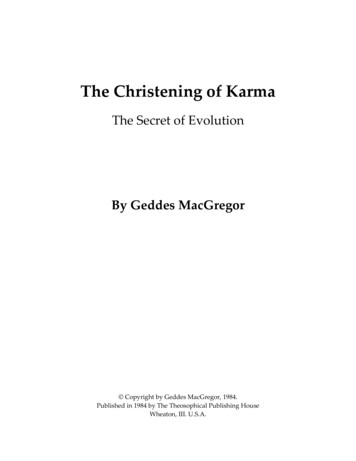
Natural Language Generation: AutomatedData StorytellingThe next chapter in the story is unfolding now: We live in the era of automated data storytelling.Natural language generation (NLG) is a technology that transforms data into narratives. Andit is revolutionizing the data-discovery and visualization process by immediately generatingnatural-language insights to accompany charts and graphs.Tableau has partnered with Narrative Science to bring NLG to Tableau users via a productextension called Narratives for Tableau. Narratives for Tableau generates intelligent insightsthat are fueled by advanced analytics and identify findings that are most interesting andimportant in Tableau visualizations. The insights are then rendered in intuitive, easy-tounderstand language, indistinguishable from what an analyst would write.Narratives for Tableau5
The ability to automate data storytelling expedites time-to-insight for those engaging in thedata discovery process. These data-driven narratives identify and communicate correlations,trends, and anomalies within the data. Novice users can better understand their visualizationswhile expert users can delve deeper faster.The narratives can also be embedded into a web page and published alongside the visualization.That means they also provide a quick mechanism to report findings to others—without the needfor manual annotations to the chart or graph. Government agencies in particular appreciatethe ability to hook up a screen reader to explain the insights within the visualizations as thiscapability satisfies 508 compliance requirements per the American for Disabilities Act.Enterprises such as Deloitte, Credit Suisse, and Franklin Templeton are utilizing NarrativeScience's Advanced NLG platform, Quill, to transform their data into intelligent narratives.For example, Credit Suisse uses Quill to power the narratives within its investment researchplatform, HOLT, which compares and values approximately 20,000 companies. Quillincorporates hundreds of variables from these companies, including asset growth and risk.Quill analyzes those variables, then generates narratives that objectively explain a company'sperformance. These narratives accompany HOLT's existing visualizations so that investors of allskillsets can make better investment decisions.The ability to automatically unlock and convey insights via language has many benefits.It allows people to interact with their data in a fluid and natural way. It also reducesmisinterpretation of data and ensures consistency in data sharing. And last but not least, peoplecan act quickly on their key findings and drive decisions.This is the “next phase in the evolution from standard reporting to storytelling,”according to Gartner.“The combination of NLG with automated pattern detection and self-service data preparationhas the potential to drive the user experience of next-generation smart data discoveryplatforms, and expand the benefits of advanced analytics to a wider audience of business usersand citizen data scientists,” said Gartner in its Hype Cycle for BI and Analytics.As automated data-storytelling rises, more people will be empowered to explore their data,uncover insights, and maximize the impact of their work.6
About TableauTableau Software helps people see and understand data. Offering a revolutionary new approach to businessintelligence, Tableau allows you to quickly connect, visualize, and share data with a seamless experiencefrom the PC to the iPad. Create and publish dashboards and share them with colleagues, partners, orcustomers—no programming skills required. See how Tableau can help your organization by starting yourfree trial at tableau.com/trial.Additional ResourcesDownload Free TrialRelated WhitepapersWhy Business Analytics in the Cloud?5 Best Practices for Creating Effective Campaign DashboardsSee All WhitepapersExplore Other Resources· Product Demo· Training & Tutorials· Community & Support· Customer Stories· SolutionsTableau and Tableau Software are trademarks of Tableau Software, Inc. All other companyand product names may be trademarks of the respective companies with which they are associated.
Tableau has partnered with Narrative Science to bring NLG to Tableau users via a product extension called Narratives for Tableau. Narratives for Tableau generates intelligent insights that are fueled by advanced analytics and identify findings that are most interesting