Transcription
NPTEL - ADVANCED FOUNDATION ENGINEERING-1Module 1GEOTECHNICAL PROPERTIES OF SOIL AND OFREINFORCED SOIL (Lectures 1 to 4)Topics1.1 INTRODUCTION1.2 GRAIN-SIZE DISTRIBUTION Sieve Analysis Hydrometer Analysis1.3 SIZE LIMITS FOR SOILS1.4 WEIGHT-VOLUME RELATIONSHIPS1.5 RELATIVE DENSITY1.6 ATTERBERG LIMITS2.1SOIL CLASSIFICATION SYSTEMS2.2AASHTO System Unified System Examples and Solutions2.3HYDRAULIC CONDUCTIVITY OF SOIL2.4STEADY-STATE SEEPAGE2.5FILTER DESIGN CRITERIA2.6EFFECTIVE STRESS CONCEPT
NPTEL - ADVANCED FOUNDATION ENGINEERING-13.1CAPILLARY RISE IN SOIL3.2CONSOLIDATIONS-GENERAL3.3CONSOLIDATION SETTLEMENT CALCULATION3.4TIME RATE OF CONSOLIDATION4.1 SHEAR STRENGTH Direct Shear Test Triaxial Tests4.24.3UNCONFINED COMPRESSION TESCOMMENTS ON SHEAR STRENGTH PARAMETERS Drained Friction Angle of Granular Soils Drained Friction Angle of Cohesive Soils4.4 SENSITIVITY4.5 SOIL REINFORCEMENT-GENERAL4.6 CONSIDERATIONS FOR SOIL REINFORCEMENT Metal Strips Nonbiodegradable Fabrics GeogridsPROBLEMSREFERENCE
NPTEL - ADVANCED FOUNDATION ENGINEERING-1Module 1Lectures 1GEOTECHNICAL PROPERTIES OF SOIL AND OFREINFORCE SOILTopics1.1INTRODUCTION1.2GRAIN-SIZE DISTRIBUTION Sieve Analysis Hydrometer Analysis1.3 SIZE LIMITS FOR SOILS1.4 WEIGHT-VOLUME RELATIONSHIPS1.5 RELATIVE DENSITY1.6 ATTERBERG LIMITS1.1 INTRODUCTIONThe design of foundations of structures such as buildings, bridges, and dams generallyrequires a knowledge of such factors as (a) the load that will be transmitted by thesuperstructure to the foundation system, (b) the requirements of the local buildingscode, (c) the behavior and stress-related deformability of soils that will support thefoundation system, and d the geological conditions of the under consideration. To afoundation engineer, the last two factors are extremely important because theyconcern soil mechanics.The geotechnical properties of a soil-such as the grain-size distribution, plasticity,compressibility, and shear strength-can are assessed by proper laboratory testing.And, recently, emphasis has been placed on in situ determination of strength anddeformation properties of soil, because this process avoids the sample disturbancesthat occur during field exploration. However, under certain circumstances, all of theneeded parameters cannot be determined or are not determined because of economicor other reasons. In such cases, the engineer must make certain assumptions regarding
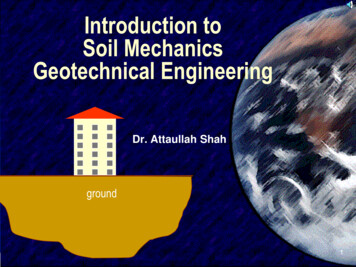
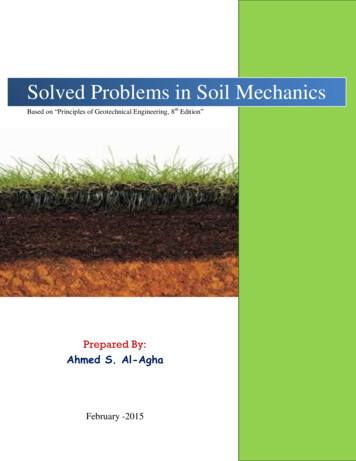
NPTEL - ADVANCED FOUNDATION ENGINEERING-1the properties of the soil. The assessment of the accuracy of soil parameters-whetherthey were determined in the laboratory and the field or were assumed-the engineermust have a good grasp of the basic principles of soil mechanics. At the same time, heor she must realize that the natural soil deposits on which foundation are constructedare not homogeneous is most cases. Thus the engineer must have a thoroughunderstanding of the geology of the are-that is, the origin and nature of soilstratification and also the groundwater conditions. Foundation engineering is a clevercombination of soil mechanics, engineering geology, and proper judgment derivedfrom past experience. To a certain extent, it may be called an “art”.When determining which foundation is the most economical, the engineer mustconsider the superstructure load, the subsoil conditions, and the desired tolerablesettlement. In general, foundations of buildings and bridges may be divided into twomajor categories: (a) shallow foundations and (2) deep foundations. Spread footings,wall footings, and mat foundations are all shallow foundations. In most shallowfoundations, the depth of embedment can be equal to or less than three to four thewidth of the foundation. Pile and drilled shaft foundations are deep foundations.This chapter serves primarily as a review of the basic geotechnical properties of soil.It includes topics such as grain-size distribution, plasticity, and soil classificationeffective stress, consolidation, and shear strength parameters. It is based onassumption that you have already been exposed to these concepts in a basicmechanics course.1.2 GRAIN-SIZE DISTRIBUTIONIn any soil mass, the sizes of various soil grains vary greatly. To classify a properly,you must know its grain-size distribution. The grain-size distribution of coarsegrained soil is generally determined by means of sieve analysis. For a fine grainedsoil, the grain-size distribution can be obtained by means of hydrometer analysis. Thefundamental features of these analyses are presented in this section. For detaileddescriptions, see any soil mechanics laboratory manual (for exam, Das, 1997).1.2.1 Sieve AnalysisA sieve analysis is conducted by taking a measured amount of dry, well-pulverizedsoil and passing it through a stack of progressively finer sieves with a pan at bottom.The amount of soil retained on each sieve is measured, and the cumulative percentageof soil passing through each sieve is determined. This percentage generally referred toas percent finer. Table 1 contains a list of U. S. sieve number and the correspondingsize of their hole openings. These sieves are commonly used for the analysis of soilclassification purposes.The percent finer for each sieve determined by a sieve analysis is plotted semilogarithmic graph paper, as shown in figure1.1Note that the grain diameter D, isplotted on the logarithmic scale, and the percent finer is plotted on the arithmeticscale.
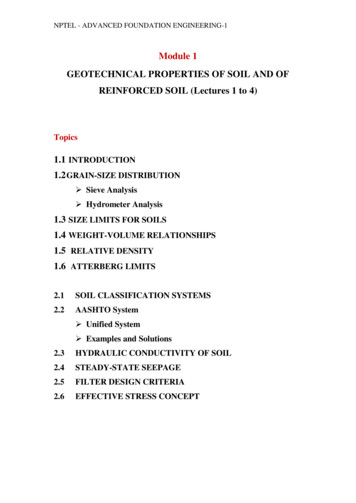
NPTEL - ADVANCED FOUNDATION ENGINEERING-1Figure 1.1 Grain-size distribution curve of a coarse grained soil obtained from sieveanalysisTwo parameters can be determined from the grain-size distribution curves coarsegrained soils: (1) the uniformity coefficient (Cu ) and (2) the coefficient gradation, orcoefficient of curvature (Cz ). These coefficients areTable U. S. Standard Sieve SizesSieve no.4681016203040506080100140170200270DCu D 60Cz D10D 23060 D 10Opening .2500.1800.1500.1060.0880.0750.053[1.1][1.2]
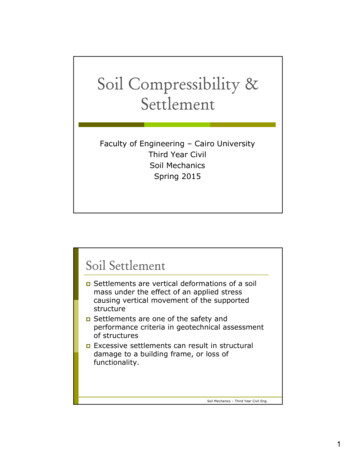
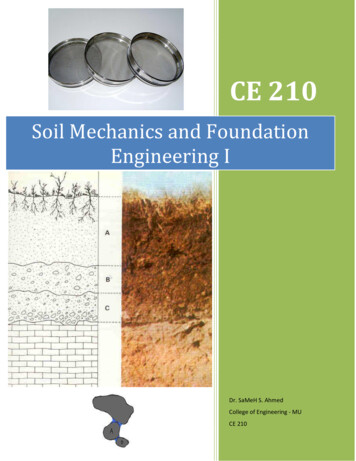
NPTEL - ADVANCED FOUNDATION ENGINEERING-1whereD10 , D30 , and D60 are the diameters corresponding to percents fines the 10, 30,and 60%, respectively.For the grain-size distribution curve shown in figure 1.1,D10 0.08 D30 0.17 mm, and D60 0.57 mm. Thus the values of Cu and Cz areCu Cz 0.57 7.130.080.172 0.63(0.57)(0.08)Parameters Cu and Cz are used in the Unified Soil Classification System, whichdescribed later in this chapter.Hydrometer AnalysisHydrometer analysis is based on the principle of sedimentation of soil particles water.This test involves the use of 50 grams of dry, pulverized soil. A deflocculating agentis always added to the soil. The most common deflocculating agent used thehydrometer is 125 cc of 4% solution of sodium hexametaphosphate. The soil isallowed to soak for at least 16 hours in the deflocculating agent. After the soakingperiod, distilled water is added, and the soil-deflocculating agent mixture isthoroughly agitated. The sample is then transferred to a 1000-m glass cylinder. Moredistilled water is added to the cylinder to fill it to the 1000-ml mark, and the mixtureis again thoroughly agitated. A hydrometer is placed in the cylinder measure-usuallyover a 24-hour period-the specific gravity of the soil-water suspension in the vicinityof its bulb (figure 1.2). Hydrometer are calibrated show the amount of soil that is stillin suspension at any given time, t. the large diameter of the soil particles still insuspension at time t can be determined Stoke’s law:Figure 1.2 Hydrometer analysis
NPTEL - ADVANCED FOUNDATION ENGINEERING-1D (GWhere18ηs 1)γ wL [1.3]tD diameter of the soil particleGs specific gravity of soil solidsη viscosity of waterγw unit weight of water𝐿𝐿 effective length (that is, length measured from the water surface in the cylinder tothe centerof gravity of the hydrometer, see figure 1.2)t timeSoil particles having diameters larger than those calculated by equation (3) wouldhave settled beyond the zone of measurement. In this manner, with hydrometerreadings taken at various times, the soil percent finer than a given diameter D can becalculated, and a grain-size distribution plot can be prepared. The sieve andhydrometer techniques may be combined for a soil having both coarse-grained andfine-grained soil constituents.SIZE LIMITS FOR SOILSSeveral organizations have attempted to develop the size limits for gravel, sand, silt,and clay based on the grain sizes present in soils. Table 2 presents the size limitsrecommended by the American Association of State Highway and TransportationOfficials (AASHTO) and the United Soil Classification systems (Corps of Engineers,Department of the Army, and Bureau of Reclamation): table 2 shows that soil particlesmaller than 0.002 mm have been classified as clay. However, clays by nature arecohesive and can be rolled into a thread when moist. This property is caused by thepresence of clay minerals such as kaolinite, illite, and montmorillon: In contrast, someminerals such as quartz and feldspar may be present in a soil particle sizes as small asclay minerals. But these particles will not have the cohesive property of clay minerals.Hence they are called clay-size particles, not clay particles.Table 2 Soil Separate Size LimitsClassificationGrain size (mm)systemUnifiedGravel: 75 mm to 4.75 mm Sand: 4.75 mm to 0.075 mm Siltand clay (fines): 0.075 mmAASHTOGravel: 75 mm to 2 mm Sand: 2 mm to 0.05 mm Silt: 0.05 mmto 0.002 mm Clay: 0.002 mm
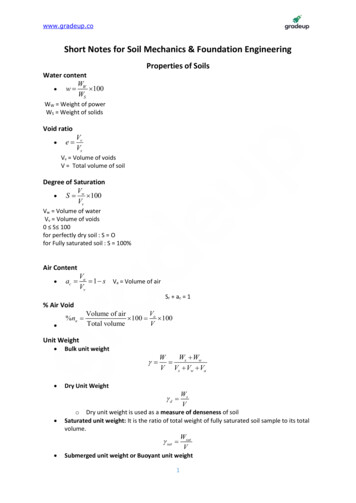
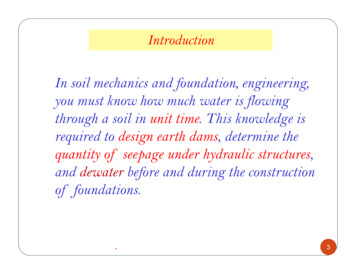
NPTEL - ADVANCED FOUNDATION ENGINEERING-1WEIGHT-VOLUME RELATIONSHIPSIn nature, soils are three-phase systems consisting of solid soil particles, water, an air(or gas). To develop the weight-volume relationships for a soil, the three phases canbe separated as shown in figure 1.3. Based on this separation, the volumerelationships can be defined in the following manner.Figure 1.3 Weight-volume relationshipsVoid ratio, e, is the ratio of the volume of voids to the volume of soil solids a givensoil mass, ore Vv[1.4]VsWhereVv volume of voidsVs volume of soil solidsPorosity, n, is the ratio of the volume of voids to the volume of the soil specimen,n VvV[1.5]
NPTEL - ADVANCED FOUNDATION ENGINEERING-1Where V total volume of soilMoreover,n VvV VVvs V v VvVsVs Vv Vs Vse 1 e[1.6]Degree of saturation, S, is the ratio of the volume of water in the void spaces thevolume of voids, generally expressed as a percentage, orS(%) WhereVwVv 100[1.7]Vw volume of waterNote that, for saturated soils, the degree of saturation is 100%.The weight relationships are moisture content, moist unit weight, dry unit weight, andsaturated unit weight. They can be defined as follows:WhereMoisture content w(%) Ws weight of soil solidsWw weight of waterMoist unit weight γ WVWw 100Ws[1.8][1.9]WhereW total weight of the soil specimen Ws WwThe weight of air, Wa , in the soil mass is assumed to be negligible.Dry unit weight γd WsV[1.10]When a soil mass is completely saturated (that is, all void volume is occur by water),the moist unit weight of a soil [equation (9)] becomes equal to the saturated unitweight (γsat ). so γ γsat if Vv Vw .
NPTEL - ADVANCED FOUNDATION ENGINEERING-1More useful relations can now be developed by considering a representation soilspecimen in which the volume of soil solids is equal to unity, as shown in figure 1.3b.Note that if Vs 1, from equation (4), Vv e and the weight of the soil solids:Ww Gs γwWhereGs specific gravity of soil solidsγw unit weight of water (9.81 kN/m3 , or 62.4 lb/ft 3 )Also, from equation (8), the weight of water Ww wWs . Thus, for the soil specimenunder consideration, Ww wWs wGs γw . Now, for the general relation for mostunit weight given in equation (9),γ WW s W w VV s V v G s γ w (1 w)[1.11]1 eSimilarly, the dry unit weight [equation (10)] isγd WsV VWss V v Gs γw[1.12]1 eFrom equations (11) and (12), note thatγγd 1 w[1.13]If a soil specimen is completely saturated as shown in figure 1.3c,Vv eAlso, for this caseVv ThusWw wGs γw wGsγwγwe wGs (for saturated soil only)[1.14]The saturated unit weight of soil becomesγsat W s W wV s V v G s γ w eγ w1 e[1.15]Relationships similar to equations (11, 12 and 15) in terms of porosity can also beobtained by considering a representative soil specimen with a unit volume.These relationships are
NPTEL - ADVANCED FOUNDATION ENGINEERING-1γ Gs γw (1 n)(1 w)[1.16]γd (1 n)Gs γw[1.17]γsat [(1 n)Gs n]γw[1.18]Table 3 provides several useful relationships for γ, γd , and γsat .Except for peat and highly organic soils, the general range of the values of specificgravity of soil solids (Gs ) found in the nature is rather small. Table 4 gives somerepresentative values. For practical purposes, a reasonable value can be assumed inlieu of running a test.Table 5 presents some representative values for the void ratio, dry unit weight, andmoisture content (in a saturated state) of some naturally occurring soils. Note that inmost cohesionless soils the void ratio varies from about 0.4 to 0.8. The dry unitweight in these soils generally fall within a range of about 90 120 lb/ft 3 (14 19 kN/m3 ).RELATIVE DENSITYIn granular soils, the degree of compaction in the field can be measured according torelative density, Dr ,which is defined asDr (%) ee max emax e min 100[1.19]Whereemax void ratio of the soil in the loosest stateemin void ratio in the densest statee in situ void ratioTable 3 Various Forms of Relationships for 𝛄𝛄, 𝛄𝛄𝐝𝐝 , 𝐚𝐚𝐚𝐚𝐚𝐚 𝛄𝛄𝐰𝐰GivenMoist unit weight, γ Relationship(1 w)Gs γww, Gs , e1 e(Gs Se)γwS, Gs , e1 e(1 w)Gs γww, Gs , Sw, Gs , nS, Gs , nwG1 SsGs γw (1 n)(1 w)
NPTEL - ADVANCED FOUNDATION ENGINEERING-1Gs γw (1 n) nSγwγ, wGs , eDry unit weight (γd )Gs , nGs , w, SwGe, w, Sγsat , nγsat , GsGs , e1 S s eSγw(1 e)wγsat nγw(γsat γw )Gs(Gs 1)Saturated unit weight (γsat )Gs , nGs , Wsate, wsatn, wsatγd , eγd , nγd , Sγd , wsatγ1 wGs γw1 eGs γw (1 n)Gs γwTable 4 Specific Gravities of Some SoilsSoil typeQuartz sandSiltClayChalkLoessPeat(Gs e)γw1 e[(1 n)Gs n]γw1 wsat G γ1 wsat Gs s we1 wsat γwwsat1 e1 wsatn γwwsateγd γ1 e wγd nγw1 1 γd γwGsγd (1 wsat 0-1.9Table 5 Typical Void Ratio, Moisture Content, and Dry Unit Weight for SomeSoilsNaturalDry unit weight, γdmoisture(lb/ft 3 )(kN/m3 )Void ratio contentinType of soilesaturated
NPTEL - ADVANCED FOUNDATION ENGINEERING-1Loose uniform sandDense uniform sandLooseangulargrained silty sandDenseangulargrained silty sandStiff claySoft clayLoessSoft organic clayGlacial till0.80.450.65condition 14.513.56-821The values of emax are determined in the laboratory in accordance with the testprocedures outlined in the American Society for Testing and Materials, ASTMStandards (1997), Test Designation D-4254).The relative density can also be expressed in terms of dry unit weight, orDr (%) γγ d γ d (min )γ d (max ) γdd (max ) γ d (min ) 100[1.20]Whereγd in situ dry unit weightγd(max ) dry unit weight in the densest state; that is, when the void ratio is eminγd (min ) dry unit weight in the loosest state; that is, when the void ratio is emaxThe denseness of a granular soil is sometimes related to its relative density. Table 6gives a general correlation of the denseness and Dr . For naturally occurring sands, themagnitudes of emax and emin v[equation (9)] may vary widely. The main reasons forsuch wide variations are the uniformity coefficient, Cu , and the roundness of theparticles, R. the uniformity coefficient is defined in equation (1). Roundness isdefined asTable 6 Denseness of a Granular SoilRelative density, Dr (%)0-2020-4040-6060-8080-100minimum radius of the particle edgesR inscribedradius of the entire particleDescriptionVery looseLooseMediumDenseVery dense[1.21]
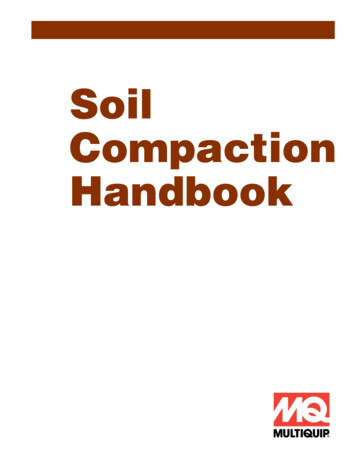
NPTEL - ADVANCED FOUNDATION ENGINEERING-1Measuring R is difficult, but it can be estimated. Figure1.4 shows the general rangeof the magnitude of R with particle roundness. Figure 1.5 shows the variation ofemax and emin with the uniformity coefficient for various values of particle roundness(Youd, 1973). This range is applicable to clean sand with normal to moderate skewedparticle-size distribution.Figure 1.4 General range of the magnitude of RFigure 1.5 Approximate variation of emax and emin with uniformity coefficient (basedon Youd, 1973)
NPTEL - ADVANCED FOUNDATION ENGINEERING-1Example 1A 0.25 ft 3 moist soil weights 30.8 lb. when dried in an oven, this soil weights 28.2 lb.givenGs 2.7. Determine thea.b.c.d.e.f.Moist unit weight, γMoisture content, wDry unit weight, γdVoid ratio, ePorosity, nDegree of saturation, SSolutionPart a. Moist Unit WeightFrom equation (9),Part b. Moisture Contentγ w Part c. Dry Unit WeightW 30.8 123.2 lb/ft 3V 0.25Ww 30.8 28.2 100 9.2%Ws28.2From equation (10),Part d. Void Ratioγd Ws 28.2 112.8 lb/ft 3V0.25From equation (4),e Vs Part e. PorosityVvVsWs28.2 0.169 ft 3Gs γw (2.67)(62.4)e 0.25 0.169 0.4790.169From equation (6),n e0.479 0.3241 e 1 0.479
NPTEL - ADVANCED FOUNDATION ENGINEERING-1Part f. Degree of SaturationFrom equation (7),S(%) Vw 100VvVv V Vs 0.25 0.169 0.081 ft 3Vw Ww 30.8 28.2 0.042 ft 3γw62.4S Example 20.042 100 51.9%0.081A soil has a void ratio of 0.72, moisture content 12%, and Gs 2.72. Determinea. Dry unit weight (kN/m3 )b. Moist unit weight (kN/m3 )c. Weight of water in kN/m3 to be added to make the soil saturatedSolutionPart a. Dry Unit WeightFrom equation (12),γd Gs γw (2.72)(9.81) 15.51 kN/m31 e1 0.72Part b. Moist Unit WeightFrom equation (11),γ Gs γw (1 w) (2.72)(9.81)(1 0.12) 17.38 kN/m31 e1 0.72Part c. Mass of Water to be AddedFrom equation (15),γsat (Gs e)γw (2.72 0.72)(9.81) 19.62 kN/m31 e1 0.72Water to be added γsat γ 19.62 17.38 2.24 kN/m3
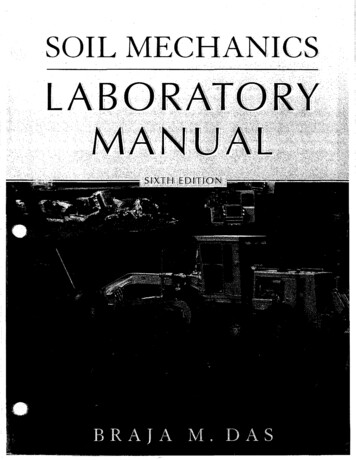
NPTEL - ADVANCED FOUNDATION ENGINEERING-1Example 3The maximum and minimum dry unit weights of a sand are 17.1 kN/m3 and 14.2 kN/m3 , respectively. The sand in the field has a relative density of 70% with a moisturecontent of 8%. Determine the moist unit weight of the sand in the field.SolutionFrom equation (20),Dr γd γd(min )γd(max ) γd(max ) γd(min )γd0.7 γd 14.217.1 17.1 14.2γdγ γd (1 w) 16.11 1 ATTERBERG LIMITS8 17.4 kN/m3100When a clayey soil is mixed with an excessive amount of water, it may flow like asemiliquid. If the soil is gradually dried, it will behave like a plastic, semisolid, orsolid material depending on its moisture content. The moisture content, in percent, atwhich the soil changes from a liquid to a plastic state, is defined as the liquid limit(LL). Similarly, the moisture contents, in percent, at which the soil change from aplastic to a semisolid state and from a semisolid to a solid state are define as theplastic limit (PL) and the shrinkage limit (SL), respectively. These limit a referred toas Atterberg limits (figure 1.6).Figure 1.6 Definition of Atterberg limits The liquid limit of a soil is determined by Casegrande’s liquid device (ASTTesting Designation D-4318) and is defined as the moisture content at which agroove closure of 12in. (12.7 mm) occurs at 25 blows.
NPTEL - ADVANCED FOUNDATION ENGINEERING-1 The plastic limit is defined as the moisture content at which the soil crumblewhen rolled into a thread of 18 in. (3.18 mm) in diameter (ASTM TestingDesignation D-4318). The shrinkage limit is defined as the moisture content at which the does notundergo further volume change with loss of moisture (ASTM TestingDesignation D-427). Figure 1.6 shows this limit.The difference between the liquid limit and the plastic limit of a soil is define asthe plasticity index (PI), orPI LL PL[1.22]Table 7 gives some representative values of liquid limit and plastic limit forseveral clay minerals and soils. However, Atterberg limits for various soils willvariable considerable, depending on the soil’s origin and the nature and amount ofclay minerals in it.Table 7 Typical Liquid and Plastic Limits for Some Clay Minerals and on Blue ClayChicago clayLouisiana clayLondon clayCambridge clayMontana clayMississippi gumboLoessial soils in north andnorthwest ChinaLiquid limit35-10050-100100-8004060756639529525-35Plastic limit25-3530-6050-1002020252721183215-20
NPTEL - ADVANCED FOUNDATION ENGINEERING-1
grained soil is generally determined by means of sieve analysis. For a fine grained soil, the grain-size distribution can be obtained by means of hydrometer analysis. The fundamental features of these analyses are presented in this section. For detailed descriptions, see any soil mechanics laboratory