Transcription
Investing Made EasyBUFFETTwithout The BotherGREENBLATTwithout the Grrrr LYNCHwithout the LegworkNEFFwithout the NonsenseGRAHAMwithout the GrindO’SHAUGNESSYwithout the O’Sh*!FISHERwithout the FussZWEIGwithout the ZweatDREMANwithout the Dreamin’MOTLEY FOOLwithout the Mess
A few quick questions How many of you have heard of factorbased investing strategies?
A few quick questions How many of you want to know whichpopular ratios and metrics, such as P/E,earnings growth rate, ROE, and debt level,etc. are best to use in selecting a stocks?
A few quick questions How many of you have given up on stockpicking and moved most of your portfolio topassive, index funds?
Factor-based Investing Inspired by WallStreet Greats like Lynch & BuffettJohn P. Reese, Founder & CEOEquity ResearchValidea.comAsset ManagementValidea Capital ManagementDigital AdvisoryValidea Legends AdvisorExchange Traded FundsValidea Funds
My Story MIT/Harvard Business SchoolMIT’s Artificial Intelligence Lab set the stageSold successful technology business to GE CapitalIn mid 90’s began extensive research into personal investingFounded Validea.com in late 90sGranted two patents for automated stock analysisBreakthrough—model portfolios developed in 2003Authored two books on guru strategies and systematic based investing—The Market Gurus (2001) & The Guru Investor (2009)Founded Validea Capital (2004) to manage money in this systemLaunched Validea’s first ETF in late 2014 and managed a set of Canadianmutual funds for over 9 years.Launched a new digital advisor, Validea Legends Advisor, for only 0.25%per year advisory and trading fee.
What is Factor-based Investing“Factor”“A factor is a characteristic or set ofcharacteristics that both explainsperformance & provides an abovemarket return”Factors Allow Investors to Think Differently About Diversificationby Larry SwedroeAAII Journal, April 2017
How Big is Factor-based Investing? BlackRock Projects Smart Beta ETF Assets Will Reach 1 Trillion Globally by 2020, and 2.4 Trillion by 2025
Evolution of Factors Many factors have come from academic researchFactors have been developed over time.
Development of Factor InvestingYearResearch or Development1934Graham & Dodd acknowledge quality premium in SecurityAnalysis1964Bill Sharpe defines “alpha” & “beta” in “Capital Asset PricingModel” (CAPM)1981Banz identifies size premium in “The Relationship betweenReturns and Market Value of Common Stocks”1992Fama French three factor model, “The Cross Section ofExpected Stock Returns”1993Jegadees & Titman show momentum premium in “Returns toBuying Winners and Selling Losers”
Development of Factor InvestingYearResearch or Development1997James O'Shaughnessy publishes “What Works on WallStreet” – shows simple quantitative strategies deliver longterm outperformance20032005John Reese publishes multi-factor “guru models” on Web20052014First “Smart beta” products come to market.Arnott & Moore write “Fundamental Indexation” showingfundamentally weighted index provide superior risk adjustedreturns vs. cap-weightedFama French five factor model introduces profitability andinvestment factors
A Factor is a Factor When Factors Allow Investors to Think Differently About Diversificationby Larry SwedroeAAII Journal, April 2017
Five Academic Factors Explain MostPerformance1. Beta: low vol stocks generally outperform2. Size: smaller cap stocks generally outperform3. Value: value stocks generally outperform4. Momentum: strong momentum generallyoutperforms5. Quality/Profitability: profitable firms generallyoutperform
Factor Excess ReturnsFactor TiltExcess Returns from Size (small):Excess Returns from Value(P/B Earnings Yield):Excess Returns from Momentum:Excess Returns from Quality:Excess Returns from Low-Vol:Excess Return0.70%3.50%1.53%1.59%0.83%0.70% to 3.5% might not seem like thatmuch, but when compounded over time An Overview of Factor Investing, Sept. 2016Fidelity Investmentshttps://www.fidelity.com/bin-public/060 www fidelity pdf
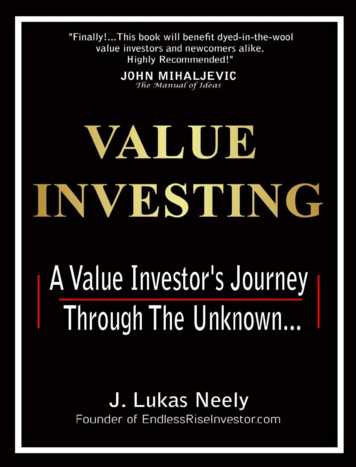
Factors Improve Long Term Returnsover the MarketIt can add up toa much largerinvestmentportfolio chart shows 10K in eachportfolio vs.Russell 1000since 1985.An Overview of Factor Investing, Sept. 2016Fidelity Investmentshttps://www.fidelity.com/bin-public/060 www fidelity pdf
Can You Do Even Better by CombiningMultiple Factors?Yes!
Isolating the Factors of GreatsWarren BuffettKey Factors are“Quality” and“Low-Risk” Quality is companies that areprofitable, growing & wellmanaged; Low-risk are stocks that exhibitlower volatility compared tohigher volatility stocks.Superstar Investors, AQRFourth Quarter 2016https://www.aqr.com/ -investors.pdf
Isolating the Factors of GreatsPeter Lynch KeyFactors are“Momentum” and“Size” Momentum is stock pricemomentum (growth stocks); Size stocks of smaller firms.Superstar Investors, AQRFourth Quarter 2016https://www.aqr.com/ -investors.pdf
Have Great Investors Disclosed theFactors They Look At?Yes!
Validea’s Factor-based Guru ModelsPeter LynchKen FisherJames O'ShaughnessyBen GrahamJoel GreenblattJoseph PiotroskiWarren BuffettJohn NeffMartin ZweigDavid DremanWilliam O’NeilTom & DavidGardner
Why these “Gurus”?3 Key Reasons1Long term market outperformance record2Publicly disclosed techniques–books, academic papers, other sources3Created quantitative methodology–leveraged using a computer program
Key Factors in Buffett ModelBased on the book, BuffettologyWarren BuffettQuality & Low Vol: 10Years of increasing profitsProfitability: 10 Years ofhigh profitabilityValue: can we get 12%annualized return?
Key Factors in Graham ModelBased on the book, The Intelligent InvestorBen GrahamQuality: Long termdebt less than netcurrent assetsValue: Price-to-bookmultiplied by price-toearnings 22
Key Factors in Fisher ModelBased on the book, Super StocksKen FisherValue: Low Price-toSales ratioQuality: long-term profitgrowth, strong free cashflow and consistentprofit margins
Key Factors in Graham ModelBased on the book, Contrarian Investment StrategiesDavid DremanValue: Two out of thefour value criteria (P/E,P/B, P/D or P/CF) need tobe in the lowest 20% ofmarket.Quality: Improvingearnings trend
Key Factors in Greenblatt ModelBased on the book, The Little Book that Beats the MarketJoel GreenblattValue: High EarningsYield (i.e. lowvaluation)Quality: High Returnon Capital
Key Factors in Neff ModelBased on the book, John Neff on InvestingJohn NeffValue: Price-to-Earningsneeds to be at least 40%below market.Quality: EPS Persistence
Key Factors in O’Neil ModelBased on the book, How to Make Money in StocksWilliam O’NeilMomentum: Stock andindustry momentum(i.e. relative strength)Quality: Earningsgrowth andconsistency
Key Factors in O'Shaughnessy ModelBased on the book, What Works on Wall StreetO’ShaughnessySize/Momentum (small caps)Price Momentum & EarningsPersistence (incr. earnings forlast 5 years)Value/Low Vol/Quality: (largecaps) Cash flow per sharegreater than market and highdividends (top 50)
Key Factors in Zweig ModelBased on the book, Winning on Wall StreetZweigQuality: Growing sales,Positive earningsgrowth andpersistence overquarters and years
Key Factors in The Motley Fool ModelBased on the book, The Motley Fool Investment GuideThe GardnerBrothersValue: PEG Ratio needs tobe attractive – blendsvalue and growth.Momentum: Price strengthan important indicatorSize: Rewards smallerfirms
Key Factors in Lynch ModelBased on the book, One Up On Wall StreetPeter LynchValue: PEG Ratio needsto be attractive – blendsvalue and growth.Quality: Earningsgrowth, positive freecash flow
Stepping into the Lynch Model
Lynch: The Star “GARP” ManagerDetermining the Classification1. EPS growth 10%2. EPS growth 10% to 20%3. EPS growth 20%Slow-growerStalwartFast-growerSTEP 2: P/E/G Ratio (i.e. Fast Grower)1. 0 and 0.52. 0.5 and 13. 1Pass—Best casePassFail
Lynch Methodology ExampleChange in Inventory-to-Sales1. If a financial or service company N/A2. Change in inventory/sales is negativePass—Best case3. Change in inventory/sales 0 Pass4. Change in inventory/sales is positive but 5%Pass—Minimum5. Change in inventory/sales is positiveand 5 percentage pointsFail
Lynch Methodology ExampleTotal Debt to Equity1. If a financial or service company2.3.4.5.6.N/A (See below for financial firms)D/ED/ED/ED/ED/E 30%Pass—Best case30% and 50%Pass—Normal50% and 80%Pass—Mediocre80%, and firm is a utilityPass80%, and firm is not a utilityFailNote: if financial firm use Equity-to-Assets & ROA
Lynch Methodology ExampleP/E Ratio (i.e. Fast Grower)1. Sales 1 billion and PE 402. Sales 1 billion and PE 403. Sales 1 billion N/APassFailEPS Growth rate (i.e. Fast Grower)1. 20% and 25%2. 25% and 50%3. 50%Pass—Best casePassFail
Lynch Methodology Example7. Free Cash Flow Per Share to Current Price8. Net Cash per Share-to-Current Price
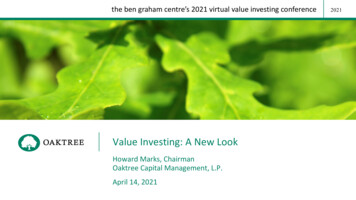
Lynch Factor-based Model up 12.1%annually vs. 6.5% for S&P 500 since 2003
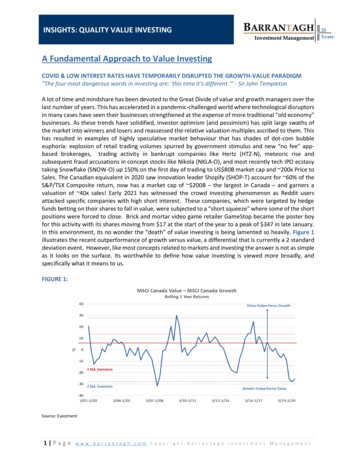
Top Lynch-rated Stocks on Validea
How Have the GuruModels Performed?
Guru Portfolios:Outperforming the MarketStrategySmall CapGrowth InvestorPrice/Sales InvestorBasedOnTotalReturnS&PReturnAnnualReturnS&P Ann.ReturnMotley 0%6.5%10 stocks rebal monthlyFisher10 stocks rebal tum InvestorLynch20 stocks rebal monthlyZweig20 stocks rebal quarterlyGraham10 stocks rebal annualO’Neil20 stocks rebal quarterlyPerformance figures as of May 5th, 2017 closing pricesInception Dates on most portfolios as of July 2003Based on Optimal Portfolios on Validea
Guru Portfolios:Outperforming the urnS&P 40%8.7%6.5%Patient 109%7.0%5.8%129%115%6.4%5.9%110%139%5.5%6.1%20 stocks rebal monthly10 stock rebal monthlyEarnings iLow P/E InvestorNeff10 stocks rebal quarterly20 stocks rebal annually20 stocks rebal quarterlyContrarianInvestorDreman20 stock rebal monthlyPerformance figures as of May 5th, 2017 closing pricesInception Dates on most portfolios as of July 2003Based on Optimal Portfolios on Validea
Validea’sKeys toSUCCESSFULInvesting
Always, Always Think Long Term Short term: very risky and uncertain 50% declines 4 times in last century Long term: odds are in your favor Today’s 65 year old needs20-25 years portfolio growth
The Probabilities of Returns – Longis ing-the-probabilities
Variability of Returns High Year toYear
Emotions Hurt Performance Emotions & Biases cost investors4% annually on average over last 20 yearsInvestor Returns S&P 50030 Year3.79%11.06%20 Year5.19%9.85%10 Year5.26%7.67%5 Year10.19%15.45%3 Year14.82%20.41%Source: DALBAR's 2015 Quantitative Analysis of Investor Behavior
Understanding MarketVolatility and Risk Tolerance All good stock strategies can experience largedeclines All highly active strategies can underperform The loss isn’t permanent unless you sell If you can’t handle a 40% decline, don’t fullyinvest in stocks
Stick To The Strategy,Even After Down YearsSeminal Study by Joel Greenblatt:The Little Book That Beats the Market (2006)1-Year Period2-Year Period3-Year %17%95%of the timeof the timeof the time
Even factor strategies can have longperiods of time where they don’t workFactors Allow Investors to Think Differently About Diversificationby Larry SwedroeAAII Journal, April cation
Stick to the Fundamentals Avoid investing based onthe current headlines David Dreman study of 11 major post-WWII crises:market up on average by 25.8% a year after the crisis Following the September 11th, 2001 terrorist attacks,it took just one month for the S&P 500 to equalpre-September 11th levels Kenneth Fisher study: Only once in historyhas a war/conflict stopped a bull market (1938)\ Tetlock Study on analyzing the accuracy ofexperts (studied over 80,000 predictions)
Buffett on Emotions & Discipline“Investing is not a game where the guy with the 160 IQbeats the guy with the 130 IQ Once you have ordinaryintelligence, what you need is the temperament to controlthe urges that get other people into trouble in investing.”“ To invest successfully does not require a stratosphericIQ, unusual business insights, or inside information.What's needed is a sound intellectual frameworkfor making decisions and the ability to keep emotionsfrom corroding the framework.”— Warren BuffettChairman, Berkshire Hathaway
Putting It Into Practice: Investment ResearchValidea.com: Stock Research, IdeaGeneration & Model PortfoliosStock Screens, Detailed Stock Analysis, Model Portfolios, TradeAlerts, Hot List NewsletterAAII Special: Two Years for Price of One!(offer valid for the next 3 days)https://www.validea.com/presentation
Putting It Into Practice: ETFsMulti-Model Guru Based ETF Blend of multiple factor-based stock picking modelsTax efficiency and transparency of ETF wrapperAvailable on all major brokerage platformsNo minimum investmenthttp://www.valideafunds.com
Putting It Into Practice: Robo AdvisorValidea Legends Advisor Factor-based stock selection using guru strategiesUncorrelated assets and downside protection to limit riskCustomized portfolio for each investor 25,000 minimum and low 0.25% management feehttp://www.valideacapital.com
Sep 11, 2001 · Investing Made Easy BUFFETT without The Bother LYNCH. without the Legwork. GRAHAM without the Grind. FISHER without the Fuss. DREMAN without the Dreamin’ GREENBLATT without the Grrrr NEFF without the Nonsense. O’SHAUGNESSY. without the O’Sh*