Transcription
Page University of Southern QueenslandFaculty of Engineering and SurveyingImprovements to the Calibration of ElectronicDistance Measurement Equipment (EDME)A Dissertation Submitted byMr Rhys Daniel Wayne PescodIn Fulfilment of the requirement ofCourse ENG4111 and ENG 4112 Research ProjectTowards the degree ofBachelor of Spatial Science (Surveying)Submitted: 28th October, 2015
Page IABSTRACTAs Electronic Distance Measurement Equipment (EDME) technology significantlyadvances, so too must the way instruments are calibrated.Valuable time andresources are committed to ensuring EDME is calibrated to ensure national standardsare met. As such, it is vital that the methods employed for calibration are the mostappropriate for the instruments used.In order to assist the profession in this regard, this paper investigates the currentEDME calibration baseline designs used in Queensland and analyses the suitabilityof each in order to devise an alternative baseline design. The methodology used wasto identify key characteristics of an existing baseline design and select the mostaccurate of those to construct a new design. This process was then applied overmultiple designs and the results analysed and compared to determine the viability ofthe alternative design.
P a g e IIUniversity of Southern QueenslandFaculty of Health, Engineering and SciencesENG4111/ENG4112 Research ProjectLimitations of UseThe Council of the University of Southern Queensland, its Faculty of Health,Engineering & Sciences, and the staff of the University of Southern Queensland, donot accept any responsibility for the truth, accuracy or completeness of materialcontained within or associated with this dissertation.Persons using all or any part of this material do so at their own risk, and not at therisk of the Council of the University of Southern Queensland, its Faculty of Health,Engineering & Sciences or the staff of the University of Southern Queensland.This dissertation reports an educational exercise and has no purpose or validitybeyond this exercise. The sole purpose of the course pair entitled “Research Project”is to contribute to the overall education within the student’s chosen degree program.This document, the associated hardware, software, drawings, and other material setout in the associated appendices should not be used for any other purpose: if they areso used, it is entirely at the risk of the user.
P a g e IIIUniversity of Southern QueenslandFaculty of Health, Engineering and SciencesENG4111/ENG4112 Research ProjectCertification of DissertationI certify that the ideas, designs and experimental work, results, analyses andconclusions set out in this dissertation are entirely my own effort, except whereotherwise indicated and acknowledged.I further certify that the work is original and has not been previously submitted forassessment in any other course or institution, except where specifically stated.Rhys Daniel Wayne PescodU1006119
P a g e IVAcknowledgements:This research project was carried out under the guidance and supervision of MrGregory Williams, Cadastral Surveyor of Moreton Bay Regional Council.I would like to thank Dr Glenn Campbell who has supervised the completion of thisresearch project. This project would not have been achieved without his guidanceand support.I wish to specifically thank Colin Moorhead who provided the required software forthis project and assisted my understanding of its application. Further thanks to IsaacStiller of DNRM who has provided valuable advice throughout this research project.Finally, I would also like to thank my wife Shannon for her ongoing and unwaveringsupport and understanding throughout this research project, without whom I wouldnot have been able to achieve a completed project.
Table of ContentsABSTRACT. ILimitations of Use . IICertification of Dissertation . IIIAcknowledgements:. IVLIST OF FIGURES . VLIST OF TABLES . VICHAPTER 1 - Introduction . 11.1Project Topic Description . 11.2Project aim and Objectives . 11.3Project Background . 21.4 Conclusion . 4CHAPTER 2 - Literature Review . 52.1 Introduction . 52.2 History of EDME . 52.3 Principles of EDME . 62.3 Legal traceability . 72.4 Calibration of EDME . 82.4.1 Constant Error . 92.4.2 Scale Error . 92.4.3 Cyclic Error . 102.5 Methods of Calibration . 112.5.1 HEERBRUGG/SCHWENDENER. . 122.5.2 AARAU DESIGN. 132.5.3 HOBART/SPRENT ZWART . 132.5.4 BASELINE DESIGN IN AUSTRALIA . 132.6 Alternative Calibration Methods . 142.6.1 GNSS Calibration . 152.6.2 Compact Laboratory Calibration . 15
CHAPTER 3: Methodology . 163.1 Introduction to Project Methodology . 163.2 Caboolture EDM Baseline . 173.3 Alternative Baseline Designs . 193.4 Observations . 203.4.1 Instruments . 203.4.2 Observation Sequences . 213.5 Reduction . 233.6 Legal Traceability . 24Chapter 4: Analysis of Data and Results . 254.1 Introduction . 254.2 Baseline Design combinations . 254.3 Reduction and Results. 274.4 Adjustments to 5 Pillar Design. . 33Chapter 5 – Discussion and Conclusions . 365.1 Introduction . 36Chapter 6 – Future Work . 38Bibliography . 39List of Appendices . 42
Page VLIST OF FIGURESFigure 1.1 – EDME sinusoidal wavelengths: (n λ p)Figure 3.1 – Aerial Photograph of Caboolture EDM BaselineFigure 3.2 – Distance modulo of Unit Length of the Caboolture range (10m)Figure 3.3 – Forward Run Sequence PatternFigure 3.4 – Distance modulo of Unit Length of the Caboolture range (1m)Figure 3.5 – Forward Run Sequence PatternFigure 4.1 – Index Constant Uncertainty (95%)Figure 4.2 – Scale Factor Uncertainty (95%)
P a g e VILIST OF TABLESTable 1.1 – Qld EDME Calibration Baselines (DNRM)Table 4.1 – 4 Pillar CombinationsTable 4.2 – 5 Pillar CombinationsTable 4.3 – 6 Pillar CombinationsTable 4.4 – Results of the Topcon ES 103Table 4.5– Results of the Nikon NPR-362Table 4.6 – Results of the Leica TS-15Table 4.7 – Comparison between old and new 5 pillar designs.Table 4.8 – Topcon comparisons between old and new 5 pillar designs.Table 4.9 – Nikon comparisons between old and new 5 pillar designs.Table 4.10 – Leica comparisons between old and new 5 pillar designs.
Page 1CHAPTER 1 - Introduction1.1 Project Topic DescriptionThe reliability and accuracy of Electronic Distance Measurement Equipment(EDME), like any equipment, is critical. To ascertain this, EDME is calibrated ongovernment maintained baselines. The calibration process identifies any existingerrors of the instrument so that adjustments may be made to account for those errors.The design of a calibration baseline is largely determined by the need to eliminatespecific types of error.This project dissertation will investigate the different EDME calibration designs andparticularly focus on the current design format used in Queensland and the errorsthey address. It is theorised that an alternate calibration baseline design is possible astechnological advances in EDME means that some types of errors (particularly‘cyclic error’) may no longer be as prominent in modern day instruments, andtherefore there may be scope to redesign the current baseline used in Queensland.The possibility of an alternative legally traceable calibration baseline will thereforebe explored.1.2 Project aim and ObjectivesThe aim of this project is to investigate the current baseline designs used for thecalibration of EDME, undertake an analysis of these current designs and researchalternative methods that have been previously proposed and offer a fresh alternativeEDME baseline design.
Page 2The objective of an alternative EDME calibration baseline design is to ensure thatthe types of errors that current calibration baselines address are still relevant andrequired to be corrected when using modern day instruments. The alternative designwill focus on the fact that cyclic error may not need to be considered in the designdue to advances in technology. In this respect, a more efficient calibration baseline,both economically and physically, is possible.1.3 Project BackgroundThe Department of Natural Resource and Mines (DNRM) is the authority appointedfor the verification of (and re-verification) of “length”. In order to perform theirobligations as a verifying authority, DNRM provide and maintain EDME Baselinesthroughout the state of Queensland for the purpose of calibrating surveyingequipment.There are currently 16 certified EDME Baselines in Queensland. Table 1.1 identifiesthe length and locations of each baseline.
Page 3LocationAloomba: Along railwayLength730mline.LocationMaroochy: Within airportLength1004mgroundsBundaberg: Within airport1021mMaryborough1021m1148mMica .Caboolture: Alongrailway line.Cooktown: Within airportgrounds.Gold Coast: Withinsewage treatment burn: Within scientific1082mWalkamin: Within scientific1083mreservereserve.880mMackayTable 1.1: Qld EDME Calibration Baselines (DNRM)Perusal of the Regulation 13 Certificates of each baseline reveals that all Queenslandcalibration baselines consist of seven pillars and span, on average, approximatelyone kilometre of unobscured land. As demonstrated in Table 1, baselines are oftensituated in an area with restricted access, such as within airports or along railwaylines. These places provide an open, unobscured area large enough to accommodatethe seven pillar method.In addition to modern instruments potentially outgrowing current calibrationmethods, there are two further issues with the current baselines:1. There are a limited number of certified baselines, affecting availability andaccessibility for surveyors.2. There are difficulties in finding suitable land given the distance required forseven pillar baselines especially in high populated areas.
Page 41.4 ConclusionThe need to undertake this dissertation derives from the lack of suitable EDMEbaselines in highly populated areas such as Brisbane. In addition to the lack ofEDME baselines, there is a need to investigate whether the current 7 pillar design isnow required to calibrate modern day instruments. This hasn’t yet been investigatedto ascertain if the current baselines are changing and adapting with advances intechnology, particularly with the reference to Cyclic error.This project will aim to provide an alternative calibration baseline design. Thealternative baseline design aims to be more efficient in the calibration process whilstensuring legal traceability of the EDME. Further, the alternative baseline seeks toachieve greater economy in maintenance and installation of new baselines as well asbeing more versatile to allow the new baselines to be installed in more suitablelocations.
Page 5CHAPTER 2 - Literature Review2.1 IntroductionThis chapter will provide the intellectual and historical basis for the alternativebaseline design by conducting a review of the literature relevant to the calibration ofEDME.There is a substantial amount of literature in regards to baseline designs. However,very little material specifically investigates the advancements in technology inmodern EDME and the way in which this affects the calibration process. Researchhas indicated that the relationship between the two is yet to be explored.The aim of this chapter is to utilise and review the available literature. The primaryresources for this project were formally published, peer reviewed sources,supplemented by anecdotal evidence of industry professionals.2.2 History of EDMEA number of different surveying instruments have been used over time to measuredistance. By the 1980’s distances were predominantly measured electronically.Early EDME, such as a Geodimeter, utilised light waves and were only able tomeasure long distances at night (Rueger, 1980). Next came instruments that usedradio waves, such as the Tellurometer. The 1960’s saw a shift to Infrared lightsources in instruments. Modern instruments are total stations, utilising a coaxial,visible red laser and are based on the principle of phase measurement.
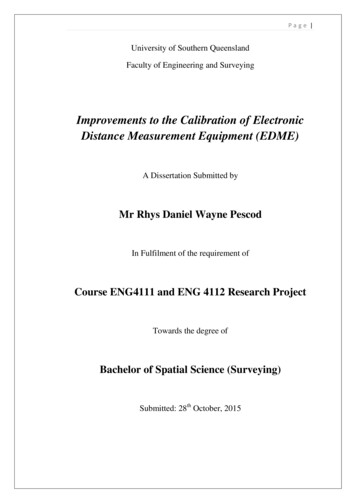
Page 62.3 Principles of EDMEThe electronic measuring of a distance involves the emission of a signal from theinstrument to a reflector which returns the signal to the instrument. The electronicsignal has a sinusoidal wave form. The outgoing and incoming wavelengths arecompared and, rather than measuring the travel time of the signal, the signalstructure is measured to determine the phase lag (Rueger, 1980).As it is emitted by the EDME at a specified frequency, the wavelength (λ) is aknown quantity. The signal leaves the EDME at 0o phase and completes a certainamount (n) of full phases on its way to and from the reflector. The signal then returnsto the EDME at an angle that is between 0o and 360o creating a partial wavelength(p). Therefore, the total distance is (n λ p), as demonstrated in Figure 1.1.Figure 1.1: EDME sinusoidal wavelengths: (n λ p)Modern EDME instruments are based on this principle regardless of light waves,infrared waves or microwaves as carrier waves.
Page 72.3 Legal traceabilityLegal traceability is the linking of the distance measurement to the definitioncontained in the relevant legislation. If a distance, or length, is proven traceable tothe national standard, the validity of the measurement will be strengthened should itbe scrutinised by a court of law.Firstly, Regulation 73 of the National Measurement Regulations 1999 (Cth) providesthat an authority is to be appointed for the verification and re-verification of lengthand the certification of measuring instruments. DNRM is the verifying authority ofQueensland and is therefore charged with providing legal traceability of length forsurveying EDME. To achieve this, DNRM maintain the EDME baselines throughoutQueensland.Further, surveyors have a legal obligation to ensure that their equipment isstandardised. Section 20 Survey and Mapping Infrastructure Regulation 201 (Qld)provides that a cadastral surveyor who carries out, or is responsible for carrying out,a cadastral survey must ensure any survey equipment used for the survey is:a) Standardised; andb) Capable of achieving the accuracy stated in the relevant survey standard forcadastral surveys.This statutory provision of instrument verification/standardisation establishestraceability of the instruments measurements to the national standard.Equipment is standardised (and therefore legally traceable) if:1. The measurements are made by an appropriate EDME instrument that hasbeen tested according to the recommended procedure on an EDME Baseline;
Page 82. At the time of testing, the EDME baseline held a valid and current Regulation13 Certificate issued by DNRM (under the National Measurement Act 1960(Cth);3. That baseline was calibrated according to approved procedures and using thedesignated EDME baseline calibration instrument;4. The calibration instrument and supporting instruments hold a valid andcurrent calibration certificate.The Intergovernmental Committee on Surveying and Mapping – Special Publication1 (SP1) provides that EDME be calibrated once per year. Additionally, they shouldbe calibrated after each repair or maintenance. DNRM are soon to release theupdated Cadastral Survey Requirements (Version 7) which will mirror the provisionsof SP1.To ensure legal traceability occurs as provided above, the Legal Traceability ofLength for EDME (LTOLE) (DNRM, 2012) defines DNRM’s recommendedprocedure for carrying out EDME comparison.2.4 Calibration of EDMEEDM instruments inherently contain errors. To determine the error of an instrumentit must be calibrated over a known distance. Calibration is the process of comparinga measured value to a known value, e.g. by comparison to a standard of the physicalquantity length (Janssen and Watson, 2014). The calibration process will identify thenature and extent of the errors of an instrument.The three primary sources of error that are determined by calibration are: zeroconstant error, scale error and cyclic error (Rueger 1980). Emenike (1982) alsoidentified constant, scale and cyclic errors as the most ‘serious’ of error groups inEDME instruments and states that they should be eliminated. The two that remain
Page 9accepted as sources of error are the zero constant error and scale error. Astechnology has advanced it has been suggested that cyclic error is now aninsignificant consideration (Ellis, 2013). However, cyclic error remains relevant toany discussion regarding EDME calibration as it remains vital to legal traceability.2.4.1 Constant ErrorAlso known as the zero or index error, the constant error is an algebraic constant tobe applied directly to every measurement. It is caused by three factors:1. Electrical delays, geometric detours and eccentricities in the EDMinstrument.2. Differences between the electronic and mechanical centres of the EDMinstrument.3. Differences between the optical and mechanical centres of the reflector.The zero error arises from the distance measuring points of the EDM instrument andof the reflector not being coincident with the vertical axes at either end of themeasured line. This error may vary with a change of reflector, after receivingimpacts, with different instrument mountings and after service (Janssen, 2015).2.4.2 Scale ErrorThe scale error is linearly proportional to the length of the measured line. It is causedby:1. Variations in the modulation frequency of the EDM instrument. This may bedue to ageing or drift of the frequency oscillator used or to temperatureeffects on the oscillator;
P a g e 102. Errors in the measured temperature, atmospheric pressure and humidity,which affect the velocity of the signal propagation;3. Non-homogeneous emission/reception patterns from the emitting andreceiving diodes (phase inhomogeneities).4. Errors in the collection and use of atmospheric data. This includes the use ofuncalibrated thermometers/barometers, not taking atmospheric measurementsin the shade and the incorrect entry of the atmospheric correction into theEDM (Ellis, 2013).The scale factor will generally vary for subsequent calibrations within the accuracyspecification of the instrument because it is dependent on the instrument’smodulation frequency, which may change with variations in the ambienttemperature. To a lesser extent, the scale factor can also change as a result offrequency drift and ageing of the frequency oscillator. Consequently, if the scalefactor falls within the instrument’s specification, it should not be applied as acorrection to measured field distances.If the scale factor falls outside the instrument’s specification, the instrument shouldbe returned to the manufacturer for service. However, it is advisable to repeat thecalibration under different climatic conditions both to confirm the result and toobserve if the scale factor changes with different ambient temperatures. Thethermometers and barometers used in the calibration should also be re-calibratedagainst a certified standard as an error in temperature and pressure readings willcontribute to the scale error of measured distance (Janssen 2015).2.4.3 Cyclic ErrorThe precision of an EDM instrument depends largely on the precision of the internalphase measurement. Phase measurement error can occur due to unwanted feed(electrical and optical interference) through the transmitted signal onto the received
P a g e 11signal (Khalil 2005). Bannister et al. (1998) describes the cyclic error as a functionof the actual phase difference measured by the EDM instrument.It varies across the modulated wavelength and is generally sinusoidal with awavelength equal to the unit length of the EDM device (Couchman 1974). The unitlength is the scale on which the EDM instrument measures the distance and isderived from the fine measuring frequency. The unit length is equal to exactly onehalf of the EDM instruments modulation wavelength (Rüeger, 1996).As the cyclic error repeats itself for every unit length contained within a measureddistance, its sign and magnitude vary depending on the length measured. Cyclic erroris known to increase in magnitude as the instrument’s components age (Janssen,2015).Ollis (2007) identified that early EDME instruments generally contained a cyclicerror of approximately 5 – 10 mm, while modern EDME instruments have a muchsmaller cyclic error in the range of 1 – 2 mm. This small cyclic error has beenlabelled ‘negligible’ (Janssen 2015) and has been said to have an insignificant effect(DNRM, 2012). Consequently, LTOLE states cyclic error is not required to bedetermined in calibration (DNRM, 2012).2.5 Methods of CalibrationEDME is calibrated by measuring a combination of distances on a baseline. A keyfeature of an EDME baseline is to enable the determination of all instrument errorsto an appropriate level of precision (DTPLI, 2014). Ruger (1989 “Baseline DesignParameters”) identifies three key calibration Baseline Designs.‘Heerbrugg’, ‘AARAU’ and ‘Sprent/Zwart’ designs.These are the
P a g e 12The difference between these designs lies in the associated methodology used todetermine cyclic error, and the observation procedures applicable to each one. Putsimply, short distance calibrations aid in determining the zero constant error. Longdistances assist in determining scale error. A design objective is to ensure that theseare determined without any cyclic error contributions.2.5.1 HEERBRUGG/SCHWENDENER.The Schwendener baseline design features an almost equal distribution of thedistances measured in all combinations over the baseline length as well as over theunit length of the distance metre. This design is said to permit the detection of alldistance-dependent errors, including cyclic errors (Schwendener, 1972; Rüeger,1996.) The original design consisted of seven stations, providing 21 observations inall combinations and it happened to be a total length of 1021.5 metres. It is based ona unit length of ten metres.The Schwendener design is based on four input parameters:U unit length of distance metre(s) to be testedA shortest distance on baseline (multiple of U)Co desired total length of baselinen number of baseline stations.A larger number of baseline stations (or pillars) will result in an increased number ofobservations (over various combinations of distances), translating into a higherprecision of the resulting zero constant.
P a g e 132.5.2 AARAU DESIGNAs explained by Rueger (1989) the AARAU baseline design features baselinesections which are exact multiples of the unit length. Assuming that the amplitudesand phases of the cyclic errors do not change over the length of the baseline thecyclic errors will affect each combination measured on the baseline by an equalamount. Any cyclic errors will therefore map into the zero constant error which isderived from the baseline measurements (Rueger, 1989). Cyclic errors must bedetermined separately on special cyclic error test lines and the bias of the zeroconstant error removed.2.5.3 HOBART/SPRENT ZWARTProposed by Sprent & Zwart (1978), the Hobart design has stations spaced at equalintervals over the entire baseline range. It is not based on the measurement of allcombinations of distances like the Heerbrugg and AARAU designs. It requires thatall true baseline distances be known at all times.The additive constant and scale error are able to be determined independent of cyclicerror on Sprent/Zwart baselines because their design has the effect of cancelling outcyclic error (DTPLI, 2104). If pairs of measurements are taken from pillars separatedby half the unit length of the EDM, the cyclic error affecting each pair will be equalin magnitude and opposite in sign. An analysis, which treats the measurements aspairs, can eliminate the effect of cyclic error.2.5.4 BASELINE DESIGN IN AUSTRALIAQueensland EDME calibration baselines conform to current best practice in that theyare all Schwendener design (1972) and consist of seven pillars (as noted on theRegulation 13 Certificate of each baseline).
P a g e 14New South Wales EDME baselines also follow the Schwendener/Heerbrugg model,however have significantly fewer pillars. Many New South Wales baselines consistof only 4 pillars (Janssen 2015; Ellis 2013). It was recommended (Rueger 1992) that4 pillar baselines be upgraded to 5 or 6 pillars. This will increase redundancies whichwill allow for more accurate EDME calibration. As such, New South Wales isseeking to align their EDME baselines with best practice principles and upgrade theEDM infrastructure (Ellis 2013).Victorian EDME baselines consist of Sprent/Zwart (Hob
Table 4.4 – Results of the Topcon ES 103 Table 4.5– Results of the Nikon NPR-362 Table 4.6 – Results of the Leica TS-15 Table 4.7 – Comparison between old and new 5 pillar designs. Table 4.8 – Topcon comparisons between old and new 5 pillar designs. Table 4.9