Transcription
CS229 Section: PythonTutorialMaya SrikanthContent adapted from past CS229 iterations
PythonPython 2.0 released in 2000(Python 2.7 “end-of-life” in2020)Python 3.0 released in 2008(Python 3.6 for CS 229)- High-level object-oriented, ournalpone0088941g001 fig1 260447599
Text editor/IDE options. (don’t settle with notepad) PyCharm (IDE) Visual Studio Code (IDE) Sublime Text (IDE) Atom Notepad /gedit Vim (for Linux)
PyCharm IDEPyCharm Good debugger Project managementFYI, professional version free for students: https://www.jetbrains.com/student/
Visual Studio IDEVisual Studio Code Light weight Wide variety of pluginsto enable support forall languages
Basic Python: Strings, Lists,Dictionaries
String manipulationprint('I love CS229. (upper)'.upper())print('I love CS229. (rjust 20)'.rjust(20))print('we love CS229. (capitalize)'.capitalize())print('I love CS229. (strip)'.strip())FormattingConcatenationprint('I like ' str(cs class code) ' a lot!')print(f'{print} (print a function)')print(f'{type(229)} (print a type)')Formattingprint('Old school formatting: {.2F}'.format(1.358))
Listlist 1 ['one', 'two', 'three’]List creationlist 1.append(4)list 1.insert(0, 'ZERO’)Insertion/extensionList comprehensionSortinglist 2 [1, 2, 3]list 1.extend(list 2)long list [i for i in range(9)]long long list [(i, j) for i in range(3)for j in range(5)]long list list [[i for i in range(3)]for in range(5)]sorted(random list)random list 2 [(3, 'z'), (12, 'r'), (6, 'e’),(8, 'c'), (2, 'g')]sorted(random list 2, key lambda x: x[1])
Dictionary and SetSet(unordered, unique)Dictionary(mapping)Dictionarymy set {i ** 2 for i in range(10)}{0, 1, 64, 4, 36, 9, 16, 49, 81, 25}my dict {(5-i): i ** 2 for i in range(10)}{5: 0, 4: 1, 3: 4, 2: 9, 1: 16, 0: 25, -1:36, -2: 49, -3: 64, -4: 81}dict keys([5, 4, 3, 2, 1, 0, -1, -2, -3, 4])second dict {'a': 10, 'b': 11}updatemy dict.update(second dict)Iterate through itemsfor k, it in my dict.items():print(k, it)
NumPy
What isNumPyand why? Package for scientific computing in Python Vector and matrix manipulationBroadcasting and vectorization (matrix operations)saves time & cleans up code
Convenient math functions, read before use!Python CommandDescriptionnp.linalg.invInverse of matrix (numpy as equivalent)np.linalg.eigGet eigen values & eigen vectors of arrnp.matmulMatrix multiplynp.zerosCreate a matrix filled with zeros (Read on np.ones)np.arangeStart, stop, step size (Read on np.linspace)np.identityCreate an identity matrixnp.vstackVertically stack 2 arrays (Read on np.hstack)
Debugging tools Python CommandDescriptionarray.shapeGet shape of numpy arrayarray.dtypeCheck data type of array (for precision, for weird behavior)type(stuff)Get type of a variableimport pdb; pdb.set trace()Set a breakpoint f’My name is {name}’)Easy way to construct a message
Basic NumPy Usagearray 1d np.array([1, 2, 3, 4])array 1by4 np.array([[1, 2, 3, 4]])large array np.array([i for i in range(400)])large array large array.reshape((20, 20))Initialization from Python listsLists with different types(NumPy auto-casts to higherprecision, but it should bereasonably consistent)from list np.array([1, 2, 3])from list 2d np.array([[1, 2, 3.0], [4, 5, 6]])from list bad type np.array([1, 2, 3, 'a'])print(f'Data type of integer is {from list.dtype}')print(f'Data type of float is {from list 2d.dtype}')NumPy supports many types ofalgebra on an entire arrayarray 1 5array 1 * 5np.sqrt(array 1)np.power(array 1, 2)np.exp(array 1)np.log(array 1)
Dot product and matrix multiplicationA few ways to write dot productMatrix multiplication like Ax2D matrix multiplicationElement-wise multiplicationarray 1 @ array 2array 1.dot(array 2)np.dot(array 1, array 2)weight matrix np.array([1, 2, 3, 4]).reshape(2, 2)sample np.array([[50, 60]]).Tnp.matmul(weight matrix, sample)mat1 np.array([[1, 2], [3, 4]])mat2 np.array([[5, 6], [7, 8]])np.matmul(mat1, mat2)a np.array([i for i in range(10)]).reshape(2, 5)a * anp.multiply(a, a)np.multiply(a, 10)
BroadcastingNumPy compares dimensions of operands, then infers missing/mismatcheddimensions so the operation is still valid. Be careful with dimensions!op1 np.array([i for i in range(9)]).reshape(3, 3)op2 np.array([[1, 2, 3]])op3 np.array([1, 2, 3])# Notice that the results here are DIFFERENT!print(op1 op2)print(op1 op2.T)# Notice that the results here are THE SAME!print(op1 op3)print(op1 op3.T)array([[ 1, 3, 5],[ 4, 6, 8],[ 7, 9, 11]])array([[ 1, 2, 3],[ 5, 6, 7],[ 9, 10, 11]])array([[ 1, 3, 5],[ 4, 6, 8],[ 7, 9, 11]])array([[ 1, 3, 5],[ 4, 6, 8],[ 7, 9, 11]])
Broadcasting for pairwise distancesamples np.random.random((15, 5))# Without broadcastingexpanded1 np.expand dims(samples, axis 1)tile1 np.tile(expanded1, (1, samples.shape[0], 1))expanded2 np.expand dims(samples, axis 0)tile2 np.tile(expanded2, (samples.shape[0], 1 ,1))diff tile2 - tile1distances np.linalg.norm(diff, axis -1)# With broadcastingdiff samples[: ,np.newaxis, :]- samples[np.newaxis, :, :]distances np.linalg.norm(diff, axis -1)# With scipy (another math toolbox)import scipydistances scipy.spatial.distance.cdist(samples, samples)Both achieve the effectof
Why should I vectorize my code? (dot product)Shorter code, faster executiona np.random.random(500000)b np.random.random(500000)With loopdot 0.0for i in range(len(a)):dot a[i] * b[i]Numpy dot t)Wall time: 345msWall time: 2.9ms
An example with pairwise distanceSpeed up depends on setup and nature of computationsamples np.random.random((100, 5))With looptotal dist []for s1 in samples:for s2 in samples:d np.linalg.norm(s1 - s2)total dist.append(d)Numpy with broadcastingdiff samples[: ,np.newaxis, :] samples[np.newaxis, :, :]distances np.linalg.norm(diff, axis -1)avg dist np.mean(distances)avg dist np.mean(total dist)Wall time: 162ms(even worse without NumPynorm)Wall time: 3.5ms
Tools for Plotting
Other Python packages/toolsJupyter Notebook Interactive, re-execution, result storageMatplotlib / Seaborn Visualization (line, scatter, bar, imagesand even interactive 3D)Pandas (https://pandas.pydata.org/) DataFrame (database/Excel-like) Easy filtering, aggregation (also plotting, but lessfeatures than dedicated datavis packages)
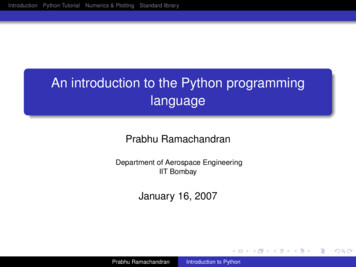
Example mlImportimport matplotlibimport matplotlib.pyplot as pltimport numpy as npCreate data# Data for plottingt np.arange(0.0, 2.0, 0.01)s 1 np.sin(2 * np.pi * t)Plottingfig, ax plt.subplots()ax.plot(t, s)Format plotax.set(xlabel 'time (s)', ylabel 'voltage (mV)',title 'About as simple as it gets, t.show()
Plot with dash lines and legendimport numpy as npimport matplotlib.pyplot as pltx np.linspace(0, 10, 500)y np.sin(x)fig, ax plt.subplots()line1, ax.plot(x, y, label 'Using set dashes()')# 2pt line, 2pt break, 10pt line, 2pt breakline1.set dashes([2, 2, 10, 2])line2, ax.plot(x, y - 0.2, dashes [6, 2],label 'Using the dashes parameter')ax.legend()plt.show()
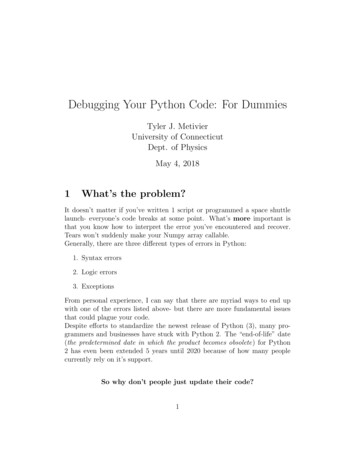
Using subplotx np.arange(0, 3 * np.pi, 0.1)y sin np.sin(x)y cos np.cos(x)# Setup grid with height 2 and col 1.# Plot the 1st subplotplt.subplot(2, 1, 1)plt.grid()plt.plot(x, y sin)plt.title('Sine Wave')# Now plot on the 2nd subplotplt.subplot(2, 1, 2)plt.plot(x, y cos)plt.title('Cosine Wave')plt.grid()plt.tight layout()
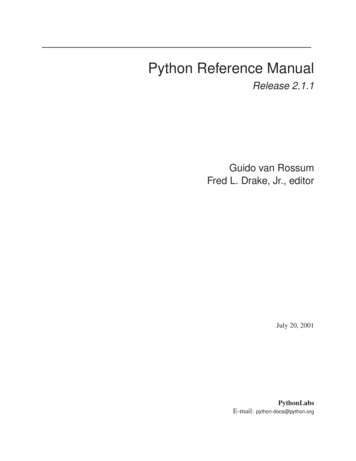
Plot area under curve
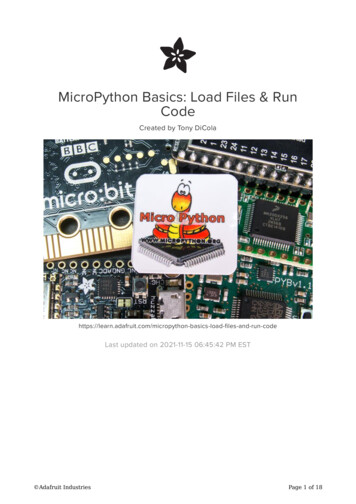
Confusion matrixhttps://scikit-learn.org/stable/auto examples/model selection/plot confusion matrix.htmlfig, ax plt.subplots()im ax.imshow(cm, interpolation 'nearest', cmap cmap)ax.figure.colorbar(im, ax ax)# We want to show all ticks.ax.set(xticks np.arange(cm.shape[1]),yticks np.arange(cm.shape[0]),xticklabels classes, yticklabels classes,ylabel 'True label', xlabel 'Predicted label’,title title)# Rotate the tick labels and set their alignment.plt.setp(ax.get xticklabels(), rotation 45, ha 'right',rotation mode 'anchor')# Loop over data dimensions and create text annotations.fmt '.2f' if normalize else 'd'thresh cm.max() / 2.for i in range(cm.shape[0]):for j in range(cm.shape[1]):ax.text(j, i, format(cm[i, j], fmt),ha 'center', va 'center',color "white" if cm[i, j] thresh else "black")fig.tight layout()
DEMO
Good luck on HW and projects!Questions?
Supplementary SlidesQuestions?
Where does my program start?It just worksA functionProperly
What is a class?Initialize the class toget an instance usingsome parametersInstance variableDoes somethingwith the instance
To use a classInstantiate a class,get an instanceCall an instance method
String manipulationFormattingstripped ' I love CS229! '.strip()upper case 'i love cs 229! '.upper()capitalized 'i love cs 229! '.capitalize()Concatenationjoined ‘string 1’ ‘ ’ ‘string 2'Formattingformatted ‘Formatted number {.2F}’.format(1.2345)
Basic data structuresListexample list [1, 2, '3', 'four’]Set (unordered, unique)example set set([1, 2, '3', 'four’])Dictionary (mapping)example dictionary {'1': 'one','2': 'two','3': 'three'}
More on List2D listlist of list [[1,2,3], [4,5,6], [7,8,9]]List comprehensioninitialize a list [i for i in range(9)]initialize a list [i ** 2 for i in range(9)]initialize 2d list [[i j for i in range(5)] for j in range(9)]Insert/Popmy list.insert(0, ‘stuff)print(my list.pop(0))
More on ListSort a listrandom list [3,12,5,6]sorted list sorted(random list)random list [(3, ‘A’),(12, ’D’),(5, ‘M’),(6, ‘B’)]sorted list sorted(random list, key lambda x: x[1])
More on Dict/SetComprehensionmy dict {i: i ** 2 for i in range(10)}my set {i ** 2 for i in range(10)}Get dictionary keysmy dict.keys()
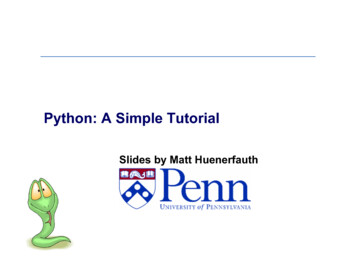
Another way for legend
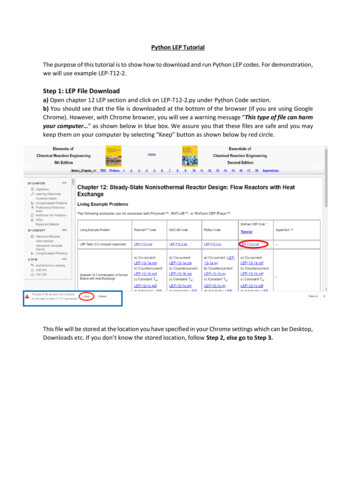
Scatter plot
Convenient math functions, read before use! Python Command Description np.linalg.inv Inverse of matrix (numpy as equivalent) np.linalg.eig Get eigen values & eigen vectors of arr np.matmul Matrix multiply np.zeros Create a matrix filled with zeros (Read on np.ones) np.arange Start, stop, step size (Read on np.linspace) np.identi