Transcription
Service AssessmentThe Historic Derecho of June 29, 2012U.S. DEPARTMENT OF COMMERCENational Oceanic and Atmospheric AdministrationNational Weather ServiceSilver Spring, Maryland
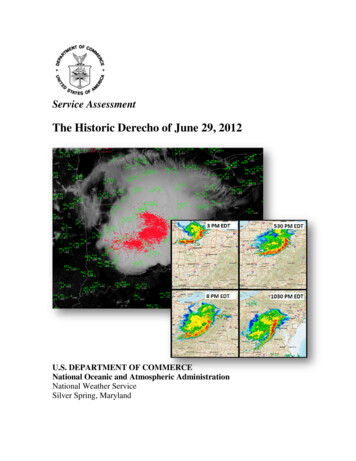
Cover Photograph: Visible satellite image at 5 p.m. Eastern Daylight Time (EDT)June 29, 2012, as the derecho moved across Ohio. National Lightning Data Network (NLDN)Cloud to ground (CG) lightning strikes for the 1-hour period, 4-5 p.m. EDT, are plotted in red.Surface observations are plotted in green. Smaller insets show radar reflectivity images of thederecho during the afternoon and evening.ii
Service AssessmentThe Historic Derecho of June 29, 2012January 2013National Weather ServiceLaura K. FurgioneActing Assistant Administrator for Weather Servicesiii
PrefaceOn June 29, 2012, a derecho of historic proportions struck the Ohio Valley andMid-Atlantic states. The derecho traveled for 700 miles, impacting 10 states and Washington,D.C. The hardest hit states were Ohio, West Virginia, Virginia, and Maryland, as well asWashington, D.C. The winds generated by this system were intense, with several measuredgusts exceeding 80 mph. Unfortunately, 13 people were killed by the extreme winds, mainly byfalling trees. An estimated 4 million customers lost power for up to a week. The regionimpacted by the derecho was also in the midst of a heat wave. The heat, coupled with the loss ofpower, led to a life-threatening situation. Heat claimed 34 lives in areas without powerfollowing the derecho.Due to the significance of this event, the National Oceanic and AtmosphericAdministration’s National Weather Service formed a Service Assessment Team to evaluate theNational Weather Service’s performance before and during the event. The findings andrecommendations from this assessment will improve the quality of National Weather Serviceproducts and services and increase awareness related to severe thunderstorms and intense heat.The ultimate goal of this report is to help the National Weather Service better perform its missionof protecting life and property and enhancing the national economy.Laura K. FurgioneActing Assistant Administratorfor Weather ServicesJanuary 2013iv
Table of ContentsPageService Assessment Team. viiiExecutive Summary . ix1.Introduction . 11.1.NWS Mission . 11.2.Purpose of Assessment Report . 11.3.Methodology . 12.Derecho Science and Climatology . 33.Event Overview . 54.Facts, Findings, Recommendations, and Best Practices. 104.1.Model Performance . 104.2.SPC Products and Services. 124.3.WFO Pre-Event Services. 184.4.WFO Warning Services. 204.5.NWSChat and Social Media. 274.6.Service Backup . 284.7.Spotter Activation and Training . 294.8.StormReady Program . 304.9.Equipment Failures. 304.10. Post-Event Heat . 315.Societal Responses and Impacts . 345.1.Public Opinion Survey . 345.2.Impacts of Warning Language and Lead Time . 375.3.NOAA Weather Radio All Hazards and Siren Systems. 385.4.Summary . 39Appendix A: Acronyms . A-1Appendix B: Findings, Recommendations, & Best Practices . B-1Appendix C: Direct Fatalities from the Derecho . C-1Appendix D: Heat-Related Fatalities in Areas Affected by the Derecho . D-1Appendix E:ASOS/AWOS Peak Wind Gusts 57 mph .E-1Appendix F:Sample Impact-based Warning. F-1Appendix G: References . G-1v
FiguresFigure 1: Number of derechos, 1980-2001, May through August . 4Figure 2: 8 p.m. Eastern Daylight Time, June 29, 2012, 500 millibar (mb) chart . 5Figure 3: Surface map at 2 p.m., June 29, 2012. Surface dewpoints greater than 66degrees Fahrenheit ( F) are contoured in green. Courtesy of SPC . 6Figure 4: 12-hour forecast of CAPE from the NAM model valid at 8 p.m., June 29, 2012 . 6Figure 5: Composite radar imagery showing the path of the derecho. Courtesy of SPC. 7Figure 6: SPC preliminary storm reports for June 29, 2012. Blue dots indicate damagingwind reports. Black squares indicate measured wind gusts 74 mph or greater. . 8Figure 7: WSR-88D Doppler radar reflectivity (left) and base velocity (right) fromNorthern Indiana (KIWX, top) and Sterling, VA (KLWX, bottom) as thederecho approached Fort Wayne, IN, and Washington, D.C. The bright pinkcolors in the velocity data indicate wind speeds greater than 70 mph. 9Figure 8: 12-hour forecast of precipitation accumulation from the NAM model valid at 8p.m., June 29, 2012 . 10Figure 9: Observed radar reflectivity (left) and 10-hour forecast from the HRRR of radarreflectivity (right) valid at 5 p.m., June 29, 2012 . 11Figure 10: 3:30 a.m., Day 3 Convective Outlook valid June 29, 2012 . 13Figure 11: SPC's 1:30 p.m., Day 2 Convective Outlook for June 29, 2012: left is categoricaloutlook, right is probability of all severe weather . 14Figure 12: The 9 a.m., June 29, 2012, SPC Day 1 Convective Outlook (left) and damagingwind probabilities (right). . 14Figure 13: The 4 p.m., June 29, 2012, Day 1 Convective Outlook (left) and the 9 p.m., Day1 Convective Outlook (right) issued by the SPC. . 15Figure 14: Severe Thunderstorm Watches issued during this event . 15Figure 15: Local extension of Severe Thunderstorm Watch #438 by WFO Sterling at 9:51p.m. (left), and SPC’s issuance of Severe Thunderstorm Watch #439 (right) at10:10 p.m. . 17Figure 16: SPC Storm Reports for Saturday, June 30, 2012 . 19Figure 17: Google Map of warning polygons issued for the event. Darker line segmentsare where multiple polygons share a common boundary. Blue polygons aresevere thunderstorm warnings, red are tornado warnings. . 21Figure 18: Severe thunderstorm warning issued by WFO Charleston for 15 counties, 3more than the 12 county system limit . 22Figure 19: Google representation of WarnGen polygon where damage report (i.e., the star)fell outside warning polygon because of 20 vertex limit. 23Figure 20: Graphical Nowcast issued by WFO Indianapolis during this event . 26Figure 21: SPS issued by WFO Sterling as the derecho approached the D.C. metro area . 27Figure 22: Power outages by county in the Pittsburgh CWA (Wetzel and MonongaliaCounty data unavailable), left, and area where the WFO lowered heat advisorycriteria, shaded region, right. . 32Figure 23: Example of impact-based heat advisory issued by WFO Charleston, WV . 33vi
TablesTable 1:Table 2:NWR outages in WFO Sterling’s CWA caused by the derecho. . 31Power outage data by state provided by FEMA . 31vii
Service Assessment TeamThe team consisted of the following individuals:Michael VescioTeam Leader: Meteorologist in Charge,Weather Forecast Office (WFO) Pendleton, ORMark FoxWarning Coordination Meteorologist, WFO Fort Worth, TXJennifer Henderson Ph.D. Candidate, Science and Technology Studies, Virginia TechMike HudsonChief Operations Officer, National Weather Service (NWS) CentralRegion Headquarters, Kansas City, MODr. Susan JaskoProfessor, Communication Studies, California Universityof PennsylvaniaRon MillerScience and Operations Officer, WFO Spokane, WADr. Laura MyersResearch Professor, Social Scientist Research Center, Mississippi StateUniversityNick PetroWarning Coordination Meteorologist, WFO Raleigh, NCJim ScarlettMeteorologist in Charge, WFO Aberdeen, SDAlex TardyWarning Coordination Meteorologist, WFO San Diego, CATyree WildeWarning Coordination Meteorologist, WFO Portland, ORStephen Wilkinson Warning Coordination Meteorologist, WFO Jackson, MSOther Valuable Contributors:David B. CaldwellDirector, Office of Climate, Water, and Weather Services (OCWWS),Silver Spring, MDDouglas C. YoungChief, OCWWS Performance Branch, Silver Spring, MDSalvatore RomanoEvaluation Meteorologist, OCWWS Performance Branch, Silver Spring, MDVankita BrownSocial Scientist, OCWWS, Silver Spring, MDBrent MacAloneyMeteorologist, OCWWS Performance Branch, Silver Spring, MDMelody MagnusTechnical Editor, Innovim, Inc., NWS OCWWS, Silver Spring, MDviii
Executive SummaryOn June 29, 2012, a devastating line of thunderstorms known as a derecho (deh REYcho) moved east-southeast at 60 miles per hour (mph) from Indiana in the early afternoon to theMid-Atlantic region around midnight. The states most significantly impacted were Indiana,Ohio, Kentucky, Pennsylvania, West Virginia, Maryland, Virginia, Delaware, New Jersey, andNorth Carolina, as well as Washington, D.C. Nearly every county impacted by this convectivesystem suffered damages and power outages. Winds were commonly above 60 mph withnumerous reports of winds exceeding 80 mph. Some areas reported isolated pockets of windsgreater than 100 mph. The storm resulted in 13 deaths, mainly a result of falling trees. Onemajor impact from the derecho was widespread power outages. More than 4 million customerswere without power, some for more than a week after the storms moved through. To makematters worse, the area affected was in the midst of a prolonged heat wave. There were 34 heatrelated fatalities in areas without power because of the derecho.The National Weather Service (NWS) formed a Service Assessment Team to evaluateperformance during this event. Due to the widespread nature of this derecho, the team chose tovisit the sites and review products and performance only at NWS Weather Forecast Offices(WFO) most impacted by the storms: WFOs Syracuse, IN (hereafter WFO Northern Indiana);Wilmington, OH; Pittsburgh, PA; Sterling, VA; Charleston, WV; and Blacksburg, VA. Theteam collected data from five other sites on the periphery of the damage path: WFOsIndianapolis, IN; Cleveland, OH; Jackson, KY; Mount Holly, NJ; and Wakefield, VA. A reviewof the products and services provided by the Storm Prediction Center (SPC) was also conductedalong with numerous SPC staff interviews.Unlike many major tornado outbreaks in the recent past, this event was not forecast wellin advance. Warm-season derechos, in particular, are often difficult to forecast and frequentlyresult from subtle, small-scale forcing mechanisms that are difficult to resolve more than 12-24hours in advance. The National Centers for Environmental Prediction (NCEP) operationalforecast models, such as the North American Mesoscale (NAM) and Global Forecast System(GFS), provided little assistance in forecasting this event more than 24 hours ahead of time.However, on the morning of June 29, some high-resolution, convection-allowing models beganto provide clues that an intense line of thunderstorms could take the path that was later observed.Because decision support activities were delayed until close to the event, key partners anddecision makers had less time to prepare for the severe winds. In the Mid-Atlantic region, manyforecasters thought the derecho would follow climatology and break up crossing the AppalachianMountains. This past pattern for such events impacted the SPC’s outlooks, which did not extendthe risk for severe thunderstorms eastward to the Mid-Atlantic coast until the afternoon ofJune 29. Therefore, WFO products and services, as well as preparedness efforts, were affectedbecause the WFOs followed SPC guidance closely.Despite the relatively short lead time for forecasting this event, the offices generally didan excellent job issuing warnings. Overall, lead times were greater than 30 minutes, especiallyon the eastern end of warning polygons. Most of the offices were issuing large warningix
polygons to cover the widespread nature of the event and the fast storm motion. All deathsoccurred within severe thunderstorm warning polygon boundaries.Three social scientists were included on this Service Assessment Team to help determinethe societal impacts of this event and to suggest improvements to future services. The socialscientists worked side by side with other team members participating in a wide range ofbriefings, interviews, and site visits. Consequently, many of the recommendations in thisassessment report incorporate a social science perspective. A common theme that emerged fromtalking to emergency managers, media, and the public was that although they received thewarnings, they were surprised by the intensity of the winds.The team submitted 13 recommendations to address NWS performance, safety, andoutreach programs. In addition, the team identified five best practices. Appendix B includesdefinitions of facts, findings, recommendations, and best practices followed by a complete listingof findings, recommendations, and best practices found within the main body of the report.Appendices C and D contain information concerning the deaths from the derecho and from heat.Appendix E provides a list of measured gusts greater than 57 mph recorded during this event.x
Service Assessment Report1. Introduction1.1.NWS MissionThe National Weather Service (NWS) provides weather, hydrologic, and climateforecasts and warnings for the United States, its territories, adjacent waters, and ocean areas forthe protection of life and property and the enhancement of the national economy. NWS data andproducts form a national information database and infrastructure, which can be used by othergovernmental agencies, the private sector, the public, and the global community.1.2.Purpose of Assessment ReportThe NWS conducts service assessments of significant weather-related events that resultin multiple fatalities, numerous injuries requiring hospitalization, significant impact on theeconomy of a large area or population, extensive national public interest or media coverage, oran unusual level of attention to NWS operations (performance of systems or adequacy ofwarnings, watches, and forecasts) by media, the emergency management community, or electedofficials. Service assessments evaluate the NWS performance and ensure the effectiveness ofNWS products and services in meeting its mission. The goal of service assessments is to betterprotect life and property by implementing recommendations and best practices that improveNWS products and services.This document presents findings and recommendations resulting from the evaluation ofNWS performance during the historic derecho event of June 29, 2012, which affected the OhioValley and Mid-Atlantic States. This derecho resulted in 13 fatalities, caused power outages toover 4 million customers, and indirectly led to 34 additional deaths due to heat-related illnessesin the week following the event.The objectives of this assessment are to identify significant findings and developrecommendations and best practices related to NWS effectiveness in the following key areas: Timeliness, quality, accuracy, and usefulness of NWS forecasts and warningsInternal and external coordination and collaborationForecasting and warning procedures at NWS officesCollaboration with federal, state, and local agencies1.3.MethodologyThe NWS formed an assessment team on July 5, 2012, consisting of employees fromNWS field offices, the NWS Central Region Headquarters office, and members of the socialscience community. The 12-member team completed the following: Performed on-scene evaluations July 13-16, 20121
Conducted interviews with staff from Weather Forecast Offices (WFOs) NorthernIndiana; Wilmington, OH; Pittsburgh, PA; Sterling, VA; Charleston, WV; andBlacksburg, VA; and with the Storm Prediction Center (SPC), all of which had primaryresponsibility for providing warnings, forecasts, and decision support for EmergencyManagers (EM), media, and the general public for this eventInterviewed members of the media, EMs, and the public to assess services provided bythe WFOsCollected data from WFOs on the periphery of the damage path includingIndianapolis, IN; Jackson, KY; Cleveland, OH; Wakefield, VA; and Mount Holly, NJ, toobtain a complete record of the event and to determine if any facts, findings,recommendations, or best practices pertained to these officesEvaluated products and services provided by the WFOs and the SPCDeveloped and agreed upon significant findings and recommendations to improve NWSproducts and servicesAfter a series of internal reviews, the service assessment is signed by the NationalOceanic and Atmospheric Administration’s (NOAA) Assistant Administrator for WeatherServices and published for public review.2
2. Derecho Science and ClimatologyA derecho is a complex of thunderstorms or a mesoscale convective system (MCS) thatproduces large swaths of severe, straight-line wind damage at Earth’s surface. Johns and Hirt(1987) set spatial, temporal, and damage limitations when classifying thunderstorm complexes asderechos. Specifically, for an MCS to be classified as a derecho, the following conditions mustbe met: There must be a concentrated area of convectively induced wind damage or gustsgreater than or equal to 58 mph occurring over a path length of at least 250 miles.Wind reports must show a pattern of chronological progression in either a singularswath (progressive; this event was a classic example) or a series of swaths (serial).There must be at least three reports separated by 64 kilometers (km) or more ofEnhanced Fujita 1 (EF1 damage) and/or measured convective wind gusts of 74mph or greater.No more than 3 hours can elapse between successive wind damage/gust events.Derechos occur year-round but are most common from May to August (Coniglio et al.,2004). Derechos form in a wide spectrum of large-scale weather patterns and occur in a broadrange of air mass instability and low to mid-level wind shear (the change of wind direction andspeed with height) environments (Evans and Doswell, 2001). The majority of events fall intothree jet stream patterns: Well-defined approaching upper level disturbanceUpper-level ridge of high pressureZonal west to east flowIn the last two patterns particularly, the forcing for the development of a derecho can besubtle and difficult to forecast. Forecasters may be aware that a pattern is setting up for apotential derecho, but pinpointing the timing and location of the storms is often problematicbecause favorable patterns may exist for several days without derecho formation.For progressive derechos, like this event, a west-to-east oriented surface frontal boundaryusually exists. The derecho typically initiates on the north side of the boundary as looselyorganized elevated thunderstorms, which eventually grow upscale, forming a large bow shapedecho. The bow echo then moves east-southeastward crossing the front into the warm and veryunstable air to the south (Johns, 1993). The storm-scale mechanisms governing the upscalegrowth and the transition from elevated to surface-based storms are not well understood. Thedemise of derechos tends to occur when they move into an environment of weaker instability andlow to mid-level wind shear (Coniglio et al., 2004).Coniglio and Stensrud (2004) developed a climatology of derechos for the eastern half ofthe United States. Figure 1 displays this derecho climatology for May through August from1980-2001.3
Figure 1:AugustNumber of derechos, 1980-2001, May throughThere is a distinct maximum in occurrence from the upper Mississippi Valley inMinnesota southeastward to western Ohio; however, there is a big decrease in frequency east ofthe Appalachian Mountains. The Appalachian Mountains and the lower climatological potentialfor derechos east of the mountains were cited by many forecasters as reasons why this derechomight weaken as it approached the Mid-Atlantic region.4
3. Event OverviewThe large-scale pattern on June 29, 2012, was characterized by a ridge of high pressurealoft over the Southeast and zonal west to east flow associated with the core of the jet streamacross the northern tier of states (Figure 2). In between these two features was a belt ofmoderate west to northwest flow aloft (approximately 45 mph) over the Ohio Valley andMid-Atlantic region. There were no obvious disturbances embedded in the flow to help focusthunderstorm development.Figure 2: 8 p.m. Eastern Daylight Time 1, June 29, 2012, 500 millibar (mb) chartAt the surface (Figure 3), a complex frontal boundary extended from the upper Midwestto the Northeast at 2 p.m. EDT. Atmospheric moisture content was high near the boundary andto the south over the Eastern Seaboard. This fact, along with very warm surface temperatures(the area was in the midst of a heat wave), led to a long corridor of very unstable conditions forthe derecho to move through, including areas east of the Appalachians.1All times referenced through the remainder of the document are in Eastern Daylight Time unless otherwiseidentified.5
Figure 3: Surface map at 2 p.m., June 29, 2012. Surface dewpoints greater than66 degrees Fahrenheit ( F) are contoured in green. Courtesy of SPCFigure 4 is a 12-hour forecast of surface-based Convective Available Potential Energy(CAPE) from the NAM model valid at 8 p.m. on June 29, 2012. Values above 4000Joules/kilogram (red and white shaded areas) indicate an extremely unstable air mass, thepotential for explosive thunderstorm development, and the possibility for a long-lived MCS ifstorms were to form.Figure 4: 12-hour forecast of CAPE from the NAM modelvalid at 8 p.m., June 29, 20126
The initial thunderstorms that formed the derecho developed north of the west-eastoriented boundary over Iowa around sunrise (not shown) and became severe in extreme northeastIllinois around noon, June 29. The storms then organized into a large bow echo in easternIndiana and raced east-southeast at around 60 mph, moving through Ohio, West Virginia,southern Pennsylvania, Maryland, Virginia, Washington, D.C., Delaware, southern New Jersey,and northern North Carolina before moving offshore shortly after midnight eastern time.Figure 5 displays the progression of the derecho at various time intervals as it movedfrom Indiana to Maryland.Figure 5: Composite radar imagery showing the path of the derecho. Courtesy of SPCFigure 6 displays the preliminary severe weather reports from SPC for this event. Therewere over 1,000 wind damage reports associated with this derecho.7
Figure 6: SPC preliminary storm reports for June 29, 2012. Blue dots indicate damaging wind reports.Black squares indicate measured wind gusts 74 mph or greater.Figure 7 displays the WSR-88D reflectivity and base velocity imagery from NorthernIndiana (KIWX) and Sterling, VA (KLWX) as the derecho was moving into the Fort Wayne, IN,and Washington, D.C., areas, respectively. The velocity data show extreme winds in excess of70 mph at both locations. Nearby Automated Surface Observing System (ASOS) peak windgusts of 91 mph at Fort Wayne (KFWA) and 71 mph at Dulles International Airport (KIAD)corroborated the radar velocities. Similar winds were reported in southwest Virginia at Roanokewhere the ASOS reported a peak wind gust of 81 mph.8
Figure 7: WSR-88D Doppler radar reflectivity (left) and base velocity (right) from Northern Indiana (KIWX, top)and Sterling, VA (KLWX, bottom) as the derecho approached Fort Wayne, IN, and Washington, D.C. The brightpink colors in the velocity data indicate wind speeds greater than 70 mph.9
4. Facts, Findings, Recommendations, and Best Practices4.1.Model PerformanceForecasters at the SPC and the WFOs rely heavily on the National Centers forEnvironmental Prediction (NCEP) operational models to forecast thunderstorms. When modelssuch as the NAM and GFS show a strong signal that thunderstorms will develop in anenvironment conducive for severe thunderstorms, forecaster confidence is increased that a severeweather event will occur. Typically, forecasters are looking for a coherent precipitation areagenerated by the models that persists and, in the case of a derecho, moves downstream.For this event, the 12-km grid-length NAM and approximately 27-km grid-length GFSmodels did not produce much in the way of precipitation for the time the derecho was occurring.As an example, Figure 8 is a 12-hour forecast of accumulated precipitation from the NAM validat 8 p.m. on June 29, 2012. It is obvious from the lack of precipitation displayed that this modelwas of little use to forecasters trying to anticipate the timing and location of this derecho. The27-km GFS model (not shown) for the same time period also did not show a strong signal for anMCS or derecho. This lack of signal in the NCEP models from 3 days prior right up to the eventsignificantly impacted the preparation and content of forecasts, outlooks, and decision support.Figure 8: 12-hour forecast of precipitation accumulation from theNAM model valid at 8 p.m., June 29, 2012On the day of the event, some of the high-resolution convection-allowing models(CAMs) that can explicitly simulate some aspects of thunderstorms, showed signs an MCSwould develop and move across the area later affected. Some forecasters at the impacted WFOswere paying close attention to the output of the High Resolution Rapid Refresh Model (HRRR).The HRRR is an experimental 3-km CAM initialized from the 13 km Rapid Refresh (RAP)model and includes radar reflectivity in the data assimilation. It is the only radar-initializedmodel running routinely at this time. Beginning about 15 hours prior to the event, the HRRRbegan depicting an MCS over the general region impacted. Forecasters at the WFOs were10
monitoring the HRRR model runs as they became available, but had some doubts about themodel’s depiction of a bow echo. These doubts were due to past erratic performance and thelack of a signal from the larger-scale GFS and NAM models.Figure 9 displays a 10-hour forecast from the HRRR showing radar reflectivity at5 p.m., June 29 along with the observed radar reflectivity. The figure shows at this time theHRRR was accurately simulating the derecho across the eastern Ohio Valley. Subsequent runsof the HRRR (not shown) also depicted the derecho remaining intact as it crossed theAppalachian Mountains into Virginia and Maryland. A 4-km version of the NAM, also a CAMand run at 6-hr intervals, showed an MCS, but the model lacked consistency from one run to thenext. Overall, it appeared WFOs used the CAMs; however, the degree of use varied from oneforecaster to another. In addition, it was not clear that all forecasters fully understood the CAMstrengths and limitations.HRRRRadarObservedFigure 9: Observed radar reflectivity (left) and 10-hour forecast from the HRRR of radar reflectivity (right) valid at5 p.m., June 29, 2012After conducting interviews with numerous SPC staff members, it became obvious SPCstaff believe relying on a single CAM, such as the HRRR, for a convective forecast can be a badpractice because convective-scal
Cloud to ground (CG) lightning strikes for the 1-hour period, 4-5 p.m. EDT, are plotted in red. Surface observations are plotted in green. Smaller insets show radar reflectivity images of the