Transcription
AN-62 TinySA.doc (12/8/2021, kh6htv)p. 1 of 9Application NoteAN-62copyrightDecember, 2021web www.kh6htv.comemail kh6htv@arrl.netTinySA - an Inexpensive TestInstrument for Digital TransmittersJim Andrews, KH6HTVThe success of the NanoVNA led the folks who developed it to follow it with thecompanion TinySA, a Spectrum Analyzer, with equally impressive performance.While it is billed as a spectrum analyzer, it is also an RF signal generator. The basicperformance covers from 100 kHz to 350 MHz. It can also be used up to 960 MHz butwith poorer performance.The price is astonishing low for what you get in this tinypackage. I got mine from Amazon for about 70 with next day delivery.The best place to go for information, specs., instruction manual, PC program, etc. is theTinySA wiki web site: ( www.tinysa.org/wiki/ ) I highly recommend you download thetinySA-App for your Windows PC. See Fig. 3 on the next page. It greatly increases theease of use and capabilities of this fantastic instrument. The spectrum plots in this app.note were obtained using the PC. The wiki site is quick to point out that it does not haveall of the capabilities of name brand spectrum analyzers and they do list the limitationsyou need to be aware of. But the price is right ! They also caution you to be careful andnot purchase imitation "clones" as they have inferior performance.
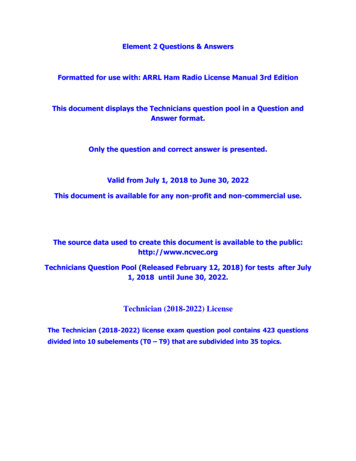
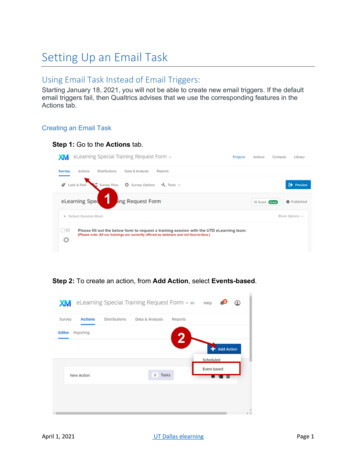
AN-62 TinySA.doc (12/8/2021, kh6htv)p. 2 of 9Fig. 2 A peek inside of the TinySA, Spectrum AnalyzerFig. 3 This is what the TinySA-App control screen looks like on a Windows PC.Googling "TinySA", you will find a lot of reviews of it's performance by hams. Thesereviews mainly deal with classical sine wave performance, with modulations such as AM,FM, etc.The focus of KH6HTV Video is on Amateur Television (ATV) and inparticular Digital Amateur Television (DATV). So it was natural for me to ask, howwell can I measure the spectral performance of a digital TV transmitter. The rest of thisapplication note will address this.
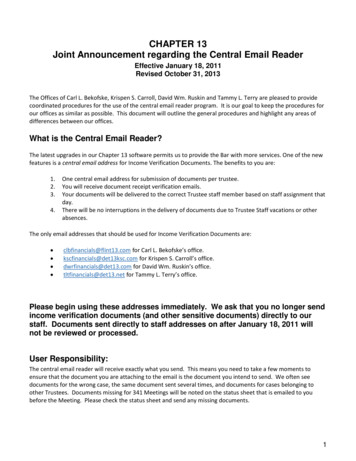
AN-62 TinySA.doc (12/8/2021, kh6htv)p. 3 of 9ITU Specification: The ITU has specified how the spectrum of a digital TVsignal should be measured. The analyzer settings, per the ITU, are: center frequency DVB-T channel center frequency, Span 20 MHz, Resolution Bandwidth 30kHz,Video Bandwidth 300kHz, Sweep Time 2 seconds, Detector RMS, SignalAveraging 10. The shoulder attenuation is measured at 200kHz beyond the channeledges, i.e. 3.2MHz from center frequency for a 6 MHz wide channel. For furtherdetails, I refer the reader to the DTV "Bible" --- "Digital Video and Audio BroadcastingTechnology", by Rhode & Schwarz engineer, Walter Fisher, page 426. [1]Fig. 4 The TinySA and the Rigol DSA-815 Spectrum Analyzers measuring a DTVsignal.Reference for Comparison:I have been using now for several years ahigh quality spectrum analyzer to characterize my DTV amplifiers and transmitters. It isa Rigol model DSA-815, 1500 MHz spectrum analyzer with a built-in tracking generator.It cost about 1,500. This app. note will compare measurements made with the Rigolagainst the TinySA. The DTV signal source I used is a Hi-Des model HV-320E, DVBT modulator. I set up the modulator to generate a 6 MHz bandwidth, QPSK signal of0dBm signal strength. Fig. 5 shows this signal measured on the Rigol with the ITUsettings. The center frequency was 100 MHz. The HV-320E covers frequencies up to2.6GHz with an identical spectrum. Note the DTV energy is spread over a 6 MHzbandwidth. The analyzer's detector bandwidth is set to 30kHz and is only measuring thepower in this narrow bandwidth. Thus the power level of the flat top shown in Fig. 5 isabout -22dBm, but spread over 6 MHz. Thus when using 30 kHz BW for a 6 MHz BWDTV signal, an approximate power measurement can be made by reading the power atthe center of the channel and then applying a 22dB correction factor.
AN-62 TinySA.doc (12/8/2021, kh6htv)p. 4 of 9Fig. 5 HV-320E spectrum as measured on the Rigol DSA-815. Pin 0dBm. Centerfrequency 100 MHz, 20 MHz span, 30kHz resolution bandwidth, 300kHz videobandwidth, 2 second sweep time, RMS detector, 10 averages, 10dB/div & 2MHz/div.MEASUREMENTS with TinySA:The first measurement performedwith the TinySA was with the same HV-320E signal as shown above in Fig. 4, but at ahigher, 70cm frequency of 435 MHz. The DTV signal was input to the HIGH port of theTinySA and it was put in the UHF mode. The TinySA was set to duplicate as close aspossible the same settings used on the Rigol SA. The center frequency was set to435MHz with a span of 20 MHz. The TinySA tries to always use "Auto" to set upbandwidth and input attenuation. I forced it into manual mode via the PC program. I setthe bandwidth to 30 kHz and input attenuation to 0 dB. Data points were set to 1000,and signal averaging was set to 8.In the UHF mode, the TinySA does not have a good input attenuator, so a 10dB SMAattenuator was placed on it's SMA input. A -10dB correction factor was entered in the"Gain" menu to account for the attenuator in the vertical calibration scale factor.Fig. 6 below shows the result. This does not compare favorably with that seen on theRigol, Fig. 5. The level of the flat top is approximately correct. But notice the horribleout of channel skirts on the spectrum. These are false artifacts not present in the DTVsignal. They are generated by severe non-linearity in the TinySA's UHF circuit. Thisresult is obviously unacceptable.
AN-62 TinySA.doc (12/8/2021, kh6htv)p. 5 of 9Fig. 6 435MHz, 6 MHz BW, 0dBm DTV signal measured directly on the TinySA, usingthe HIGH, UHF input.The next test was to repeat the measurement but instead use the LOW input which coversMF, HF, & VHF bands (0.1 - 350 MHz). The measurement was done at 100 MHz. Fig.7 below is the result. This now compares very favorably with the Rigol measurement,Fig. 5. The shoulder break points now at about the same level of -45dB.Fig. 7 100 MHz, 6 MHz BW, 0dBm DTV signal measured directly on the TinySA usingthe LOW, VHF input.
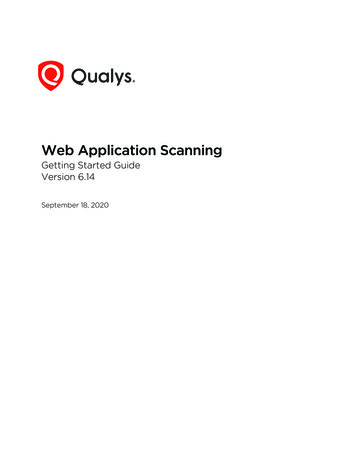
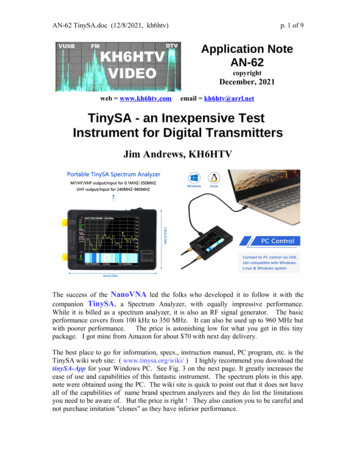
AN-62 TinySA.doc (12/8/2021, kh6htv)p. 6 of 9CONCLUSION: The TinySA will make accurate DTV spectrum measurements if theLOW, VHF input is used. The HIGH, UHF input should not be used.Fig. 8 The better way to measure frequencies higher than 350 MHzMIXER MEASUREMENTS: So to be able to measure our 70cm and higherfrequency DTV transmitters, we need to instead go to a mixer scheme. Low cost mixersare available on-line these days. Fig 8 above shows a 15, SMA mixer using a MiniCircuits ADE-25MH double balanced diode mixer. The RF & LO are rated for 5 MHz to2.5 GHz. The IF is rated for 5 MHz to 1.5 GHz. The LO requires 13dBm drive. Imeasured 7dB RF to IF down conversion loss. The TinySA vertical scale factor can becorrected for this loss by entering -7dB in the "Gain" menu.There are quite a few, low cost choices for the LO. One possibility is to simply useanother TinySA, not as a spectrum analyzer, but as a signal generator. Put in the HIGHUHF OUT mode, it's frequency is programmable from 240 MHz to 960MHz.Theoutput is a square wave. The max. output level per the menu is 16dBm. I actuallymeasured it to be from 16 to 18dBm. The programmable level control was not veryaccurate. The LOW, MF-HF-VHF, signal generator is more accurate.I ran some experiments with this mixer scheme to determine if accurate DTVmeasurements could be performed on the 70cm and 23cm bands. I used an IF of100MHz for the 70cm band and set the LO to 335 MHz for an RF input of 435 MHz.For the 23cm band, I set the LO to the TinySA max. limit of 960 MHz. Thus for an RFinput of 1243 MHz, the IF out was 283 MHz, which still fell with the LOW-VHF mode.Fig. 9 shows the result of a test using a 23cm, 1243MHz, DVB-T signal. The RF powerlevel was adjusted over a wide range to determine the limits of linearity. It shows thepower stepped from 0dBm, to -3dBm to -5dBm. Note the improved skirts as the RFinput power level is dropped. The conclusion drawn was that the input power should bekept below -3dBm and preferably below -5dBm. This experiment was also performed at70cm and I obtained identical results.
AN-62 TinySA.doc (12/8/2021, kh6htv)p. 7 of 9Fig 9 Test of the TinySa plus mixer to measure a 23cm, 1243MHz, DVB-T signal. RFinput power level stepped to demonstrate non-linear compression at high input power.Blue trace is 0dBm, Magenta trace is -3dBm. Green trace is -5dBm.EXAMPLE of USE: Fig. 10 below shows an example of using the TinySA withan external LO and mixer to measure the spectrum performance of a 70cm, RF linearpower amplifier. The amplifier's output power was 35dBm (3.2 Watts). A highpower, 30dB attenuator followed by a 10dB attenuator was used to drop the signal levelto the mixer down to about -5dBm.You might ask why the out of channel spectrum is higher than that of the modulator inputsignal, Figs 5 & 7 ? Nonlinearities in linear high power amplifiers generate these IMDspurious signals (noise) which land outside of the desired 6 MHz channel band edges.For DVB-T transmitters, Fisher [1], on pages 446-448 states that they have found thatacceptable performance for commercial broadcast DVB-T transmitters, withoutdegrading the S/N of the digital signal is obtained by driving the final amplifier until theout of channel spectrum shoulder break-point reaches -28 dB below the in channel powerlevel.Then for their R&S transmitters, they then add digital pre-distortion asequalization. This buys them another 10 dB, driving the shoulder down to -38 dB.Then the output of the final power amplifier is passed through a channel mask, band-passfilter which drops the shoulder even further to -52 dB, thus meeting govt. regulations.
AN-62 TinySA.doc (12/8/2021, kh6htv)p. 8 of 9Fig. 10 TinySA measurement of a KH6HTV Video model 70-7B Amplifier. Centerfrequency is 435 MHz. 5dB/div & 2MHz/div.The amplifier's output was adjustedfrom High to Medium to Low in -5dB steps. Blue trace is 35dBm, magenta trace is 30dBm and green trace is 26dBm.For our ham radio, DVB-T transmitters, I have found that a good compromise trade-offbetween maximizing the RF output power and minimizing degrading the S/N quality ofthe transmitted DVB-T signal is to run the drive power up until the shoulder break-pointreaches -30 dB. At this point, I achieve a Crest Factor of about 8 to 10 dB. This meansthe average DTV power is -8 to -10 dB below the max. saturated power rating of theamplifier. This crest factor is required to avoiding clipping the peaks in the DTV signaland thus destroying it's S/N. Most DATV hams are thus content to use their transmitters,as is, radiating signals that look like Fig. 10. We typically do not have, nor can affordthe cost of an exotic digital pre-distortion equalizer. For DATV repeater servicehowever, the addition of a sharp cut-off, steep skirted, 6 MHz band-pass channel filter isabsolutely required.For additional reading on testing DTV transmitters, I recommend checking out thepremier, German supplier of broadcast TV transmitters, Rohde & Schwarz's web site.
AN-62 TinySA.doc (12/8/2021, kh6htv)www.rohde-schwarz.comnewsletters there.p. 9 of 9They have a large collection of relevant application notes andREFERENCES:1."Digital Video and Audio Broadcasting Technology", by Rhode & Schwarzengineer, Walter Fisher. Published by Springer-Verlag, Berlin, Germany, 2010. Seechapter 21, "Measuring DVB-T Signals", pp. 421-4502."Digital TV Rigs and Recipes -- Part 4, DVB-T", S. Grunwakl, Rohde &Schwarz, Broadcasting Division, Application Note DigitalTV4, version 3.0, 13 Aug.2002, 66 pages --- available as .pdf files to be downloaded /digital-tv-rigs-and-recipes-applicationnote 56280-15676.html
It cost about 1,500. This app. note will compare measurements made with the Rigol against the TinySA. The DTV signal source I used is a Hi-Des model HV-320E, DVB-T modulator. I set up the modulator to generate a 6 MHz bandwidth, QPSK signal of 0dBm signal strength. Fig. 5 shows