Transcription
Data Analytics: A Matrix forBetter Decision MakingWritten byDaniel WaisbergPublishedSeptember 2015Today’s marketers have access to moredata than ever, and the pressure’s on toturn those data points into somethingmeaningful. Google’s Analytics AdvocateDaniel Waisberg shares his new framework,TITE, for helping marketers gain context andget actionable insights from their data.
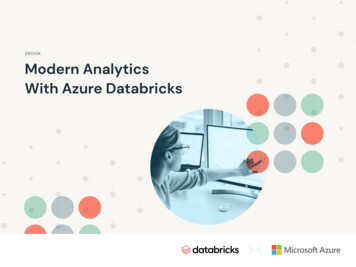
Asingle data point isn’t all that useful for understanding howsomething works, but neither is a big pile of stats. Context is thekey to making metrics actionable. But given all of the data anddashboards we’re dealing with, that process can be daunting. So howcan you turn those numbers into something more—in an organized andthoughtful way?I recently came up with a framework to help guide the process. Thematrix, called TITE (time, interactions, trends, and events), takes bothinternal and external factors into consideration as well as influences andthe need for comparison. I’ll explain each of these elements and, using ahypothetical example throughout the article, share how they can be usedto transform data into a meaningful story.Quantify and qualify your dataBefore I get into the data matrix, let’s briefly talk about accessibility. It’scrucial that organizations not only know how to access data, but that theymake it available and digestible to those who need it. DataShaka CTOPhil Harvey says the process of identifying and evaluating data sources,which he calls data landscaping, is an important step companies need totake before they can even begin analyzing data.Once you’ve got your data in hand, it’s time to think about extractingmeaning. Most marketers have, at some point, heard about theSWOT matrix, a structure for evaluating the strengths, weaknesses,opportunities, and threats involved in a new project or enterprise. It helpsyou understand how ideas relate to the world around you. In other words,it provides context.Here, I’ll show how the TITE matrix (shown below) can be used to look atatomic data, or the lower level of data, such as the individual items soldon a daily sales report. The matrix is divided into two main categories:source (where the data can be found, either internally or externally) and2
technique (how the data is being compared or what’s influencing it).These intersect to give us four key elements: Time: How is the data behaving week over week, month over month,or year over year (YoY)? Tracking the dips and spikes is an importantfirst step in planning improvement. Interactions: How are potential customers interacting with yourcompany’s properties, both online and offline? This is composedmainly of first-party data collection through platforms such asGoogle Analytics. Trends: How does your company compare to competitors andindustry trends in general? This comparison gives perspective tofluctuations in the data. Events: How are external events influencing your customers’perceptions of and attitudes toward the company? This is mostlythird-party data from tools like Google Finance and Google Trends.The TITE TrendsEventsA framework forassigning context to data3
Breaking down the data matrixTo better understand how the TITE matrix works, I’ll walk you through ahypothetical example to show how each of the elements can transforma data point into a more meaningful insight:Meet Mark, the marketing director at WTMD, a retail company thatspecializes in computing devices for all categories: desktops, laptops,tablets, and smartphones. At the start of the year, he was asked topresent 2014's results to Anne, WTMD’s vice president of marketing.Mark began his prep work by asking an analyst for the website’s salesrevenue for each device category. While the numbers looked goodinitially, he couldn't be sure without adding a frame of reference, orcontext. That’s where the TITE matrix comes in.TimeMark looked at WTMD’s internal data over a period of 36 months. Thisallowed him to see if the company's performance was improving and ifthere were specific months that consistently decreased or increased YoY.As a general rule, a data point on its own is not a useful piece ofinformation. It only shows a limited view of something that’s happened.Comparing current data to data from previous time ranges is essential tounderstanding where a business stands and whether it’s growing or not.If Mark, for example, learned that last year’s revenue was 1,750,000,would that be good? Well, that depends on several factors. The firstquestion he should be asking is: How much was the revenue for the pastthree years in a row? That would show if WTMD’s revenue is rising orfalling and if it’s within the business average.Also, keep in mind that when looking at comparisons over time, it’s criticalto account for seasonality, or patterns that repeat over time. For instance,January and February are slow months for consumer technology4
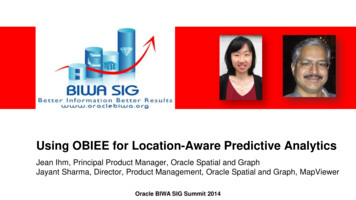
purchases. If Mark is analyzing his sales data during those months bylooking at the previous eight weeks, he might think the company’s salesare in a sudden free fall. (November and December are big months forthe company.) By comparing the same period YoY, he’s able to identifyrepeated behavior, as shown below in the comparison between the firsteight weeks of 2014 and the first eight weeks of 2013.WTMD’s Consumer Tech Sales20132014Jan 1Feb 1Feb 28Chart showing seasonal sales data for the first eight weeks of 2013 and 2014.InteractionsWhen Mark began looking at WTMD’s internal data, he also asked histeam for all data related to interactions with the company's channels.He learned that while the website represented the majority of companysales, deals were also being closed via other channels.Today, companies understand the power of connecting interactions onthe customer journey regardless of where they happen. Some are doingso through loyalty cards. So, for example, when WTMD customers usetheir loyalty card to purchase a consumer tech product, their behavioris logged into a central database, no matter if the purchases were madeonline, via an app, or in-store.5
This first-party data can be collected, analyzed, and optimizedeasily and accurately.“Context is critical when analyzing data. Ithelps marketers make better decisions bydrawing conclusions that are more meaningfuland accurate.”TrendsNext, Mark used external data to learn how WTMD’s results comparedto his competitors and the industry in general. He determined that whileWTMD’s revenues were increasing an average of 9% YoY, the industrywas growing at a slower rate of only 4% YoY.When analyzing changes in metrics, put them into perspective. If Marksaw that sales grew by 25% month over month, he might initially thinkthis was cause for celebration. Before he asks his boss for a raise,though, he’d want to look at the market to see what’s going on in theindustry. If his competitors saw an increase of 10%, his company is likelydoing something right. But if the competition grew by 50%, he might notbe so quick to crow about the results.There are many approaches to analyzing trends data. We can use GoogleAnalytics Benchmarking to see if increases (and decreases) are the resultof our actions and how they align with larger trends in the industry.Another great option for adding context to your business data is tocompare your stock to that of your competitors and across indexes,as shown below, based on Google Finance.6
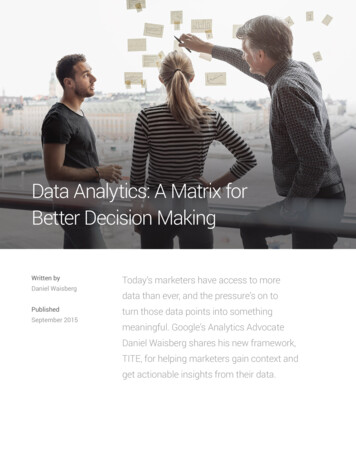
Tracking Stock Trends for WTMDSource: Based on GoogleFinance visualizationEventsWhile conducting research for his presentation, Mark found that salesdecreased during a particular month. Upon further investigation, helearned that a competitor’s in-store event had offered special deals.Data is often influenced by external events—some of which can’t becontrolled. For example, Mark might see a sudden increase in sales for aspecific laptop after a celebrity is photographed carrying one. This kind ofinfluence is hard to track.News alerts and social media monitoring can help you tune into worldchatter. You can also compare news events to stock fluctuations.Another option is to analyze trends and events (as shown below) insearch data on Google and YouTube. These things provide contextfor those consuming the data.For example, Mark could check out industry trends and see how salesfor each device type are performing. Then, he could compare thatinformation to WTMD’s own sales numbers.7
Tech Trends and 120132015Source: Each of the circles on this chart (based on Google Trends data) corresponds to an event.Make your data actionableUsing the TITE matrix, Mark was able to provide context for the 2014numbers. He explained the oscillations in the data and provided Annewith real insight to guide the company’s 2015 strategy.Context is critical when analyzing data. It helps marketers makebetter decisions by drawing conclusions that are more meaningful andaccurate. And for data to be trustworthy, it must be comprehensive.In his book Knowledge is Beautiful, British data journalist DavidMcCandless says context plays a key role in how well we understandinformation: “When you understand something, you’re able to perceiveits structure: its connections, its relationships, its significance relativeto everything else,” he writes. “Context, I’m realising, is the field of theseconnections, the network we plug any new information into. That8
explains why, when something is contextualised, we can suddenly get it. Itfeels ‘meaningful’ to us because it fits into the network of what we alreadyknow and understand and can relate to. Our knowledge.”As you’re creating context for your data to tell that meaningful story, keepthese four things in mind: Compare data points to their predecessors to surface how thecompany’s performance is changing over time. Review all customer interactions. Make sure all touchpoints arebeing measured and reported to get a full view of the customer. Check in on industry trends so you can see how your company’sincreases and decreases align with the averages. Be aware of industry events that can have an impact onyour business.Daniel WaisbergAnalytics Advocate, Google9
Data Analytics: A Matrix for Better Decision Making . 2 single data point isn’t all that useful for understanding how something works, but neither is a big pile of stats. Context is the key to making metrics a