Transcription
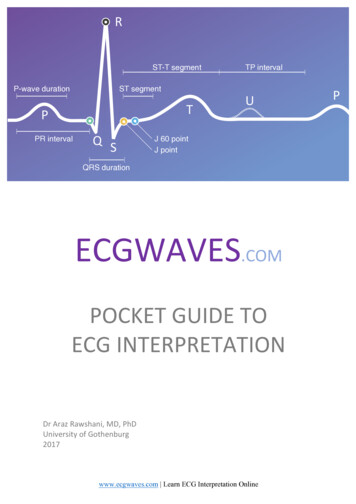
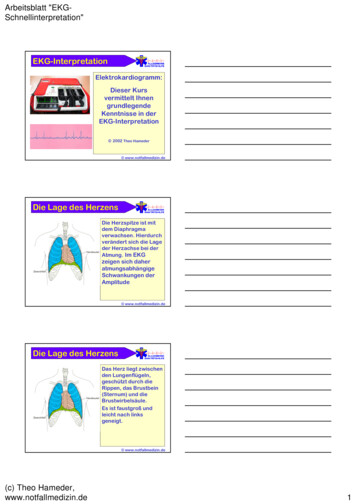
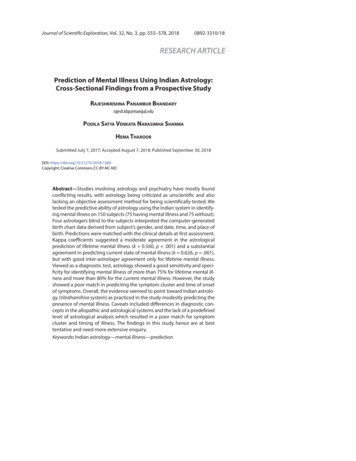
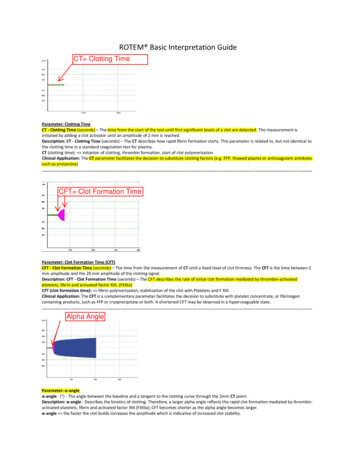
ROTEM Basic Interpretation GuideCT Clotting TimeParameter: Clotting TimeCT - Clotting Time (seconds) – The time from the start of the test until first significant levels of a clot are detected. This measurement isinitiated by adding a clot activator until an amplitude of 2 mm is reached.Description: CT - Clotting Time (seconds) – The CT describes how rapid fibrin formation starts. This parameter is related to, but not identical tothe clotting time in a standard coagulation test for plasma.CT (clotting time): initiation of clotting, thrombin formation, start of clot polymerizationClinical Application: The CT parameter facilitates the decision to substitute clotting factors (e.g. FFP, thawed plasma or anticoagulant antidotessuch as T Clot Formation TimeParameter: Clot Formation Time (CFT)CFT - Clot Formation Time (seconds) – The time from the measurement of CT until a fixed level of clot firmness. The CFT is the time between 2mm amplitude and the 20 mm amplitude of the clotting signal.Description: CFT - Clot Formation Time (seconds) – The CFT describes the rate of initial clot formation mediated by thrombin-activatedplatelets, fibrin and activated factor XIII. (FXIIIa)CFT (clot formation time): fibrin polymerization, stabilization of the clot with Platelets and F XIIIClinical Application: The CFT is a complementary parameter facilitates the decision to substitute with platelet concentrate, or fibrinogencontaining products, such as FFP or cryoprecipitate or both. A shortened CFT may be observed in a hypercoaguable --------------------------------------------Alpha AngleParameter: α-angleα-angle - ( ) - The angle between the baseline and a tangent to the clotting curve through the 2mm CT point.Description: α-angle - Describes the kinetics of clotting. Therefore, a larger alpha angle reflects the rapid clot formation mediated by thrombinactivated platelets, fibrin and activated factor XIII (FXIIIa); CFT becomes shorter as the alpha angle becomes larger.α-angle the faster the clot builds increases the amplitude which is indicative of increased clot stability.
Clinical Application: This parameter correlates to the parameter, CFT. Smaller α-angles typically suggest thrombocytopenia orhypofibrinogenemia. Whereas, a large α-angle may be observed in hypercoagulable ---------------------------------------------A10 Maximum Clot Firmness "at 10 mins"Parameter: A10 (or A20) Amplitude (x) after CTA10 – (mm) – The clot firmness at the amplitude time point of 10 minutes after CT.Description: A10 – (mm) – Amplitude 10 represents the clot firmness at 10 minutes after CT.Clinical Application: Directly relates to and is highly predictable to the MCF. Often it facilitates a decision to use platelet concentrate orfibrinogen containing components when the amplitude/value is below established reference ranges.Maximum Clot Firmness (MCF)A20 at 20 minsParameter: Maximum Clot FirmnessMCF – (mm) – The MCF - Maximum Clot Firmness measures clot firmness, thus, overall clot stability.Description: MCF is the maximum amplitude that is reached prior to clot being dissolved by fibrinolysis.Clinical Application: A low MCF suggests decreased clot firmness, whereas, an elevated MCF may indicate a hypercoagulable state. MCFcorrelates to ter: Lysis Index (x) LI (30), LI (60)Lysis Index - (%) – The Lysis Index is a parameter representing fibrinolysis at a determined time point. It correlates to the MCF (Clot %remaining).Description: LI30 for example, describes the remaining clot firmness 30 minutes after CT, whereas, LI60 describes the remaining clot firmness60 minutes after CT.Clinical Application: In most cases, an abnormal LI30 suggests hyperfibrinolysis, therefore, this parameter’s result may prove beneficial whendeciding upon anti-fibrinolytic drug therapy. In other cases hyperfibrinolysis can occur later, thus, LI60 may also be a useful clinical meter: Maximum Lysis (ML)ML - (%) – Maximum Lysis is a parameter that describes the degree of fibrinolysis relative to the MCF achieved during the measurement.(Percent reduction of clot firmness after MCF in relation to MCF).Description: A ML of 5% means that during a selected period of observation, the MCF decreased by 5%.ML (Maximum Lysis): is not calculated at any fixed time, rather it is defined as the % of lysis at the end of the measurement.Consider: Total run time and the time after MCF.Clinical Application: ML (maximum lysis): Evaluate in conjunction with Lysis Index.ML stability of the clot (ML 15%) or fibrinolysis (ML 15% within 1h)
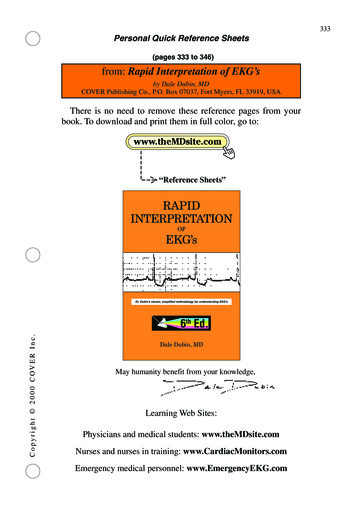
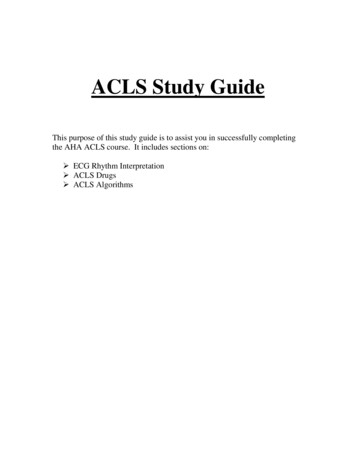
US NORMAL REFERENCE RANGESASSAYPARAMETERINTEMEXTEMFIBTEMAPTEMHEPTEMCT (sec)CFT (sec) o A10 (mm)A20 (mm)MCF (mm)LI30 (%) ML (%)122-20845-11070 - 8151 - 7251 - 72na 1543 - 8248 - 12765 - 8050 -7052 - 70na 15nanana7 - 247 - 24nanacompare to EXTEM to confirm condition of hyperfibrinolysis influence on EXTEM parameterscompare to INTEM to confirm presence of heparin influence on INTEM parametersONE PUBLISHED ROTEM ALGORITHMBolliger, D, Seeberger, M, Tanaka, K.; Principles and Practice of Thromboelastography in Clinical Coagulation Management and TransfusionPractice. 2011NOTES:
Tanaka, K., Ogawa, S., Bolliger, D.; A Primer for Use of Rotational Thromboelastometry. Point of Care, Volume 2, Number 11, June 2012.NOTES:
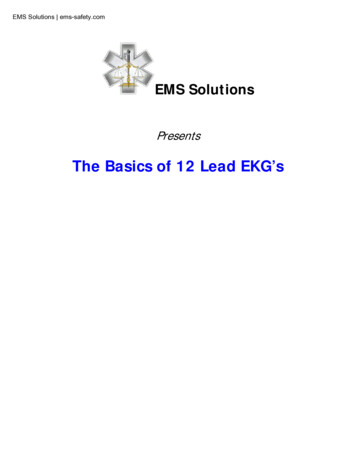
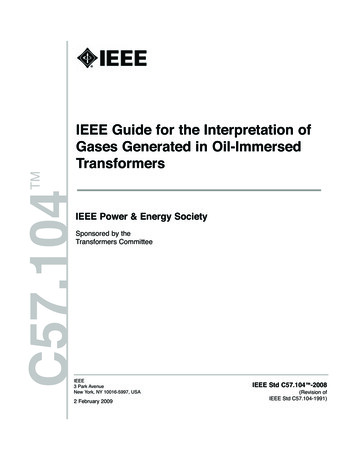
Example #1(Bleeding) Normal Range 50-70 MCFPlatelets or Plasma ? Fibtem?Fibtem Normal range - 9 - 24 MCFFibrinogen Normal range Platelet therapyExample #2Clinical Bleeding? Normal range 50- 70MCF Platelets or Plasma? Fibtem?Fibtem very low Cryo &/or FFP
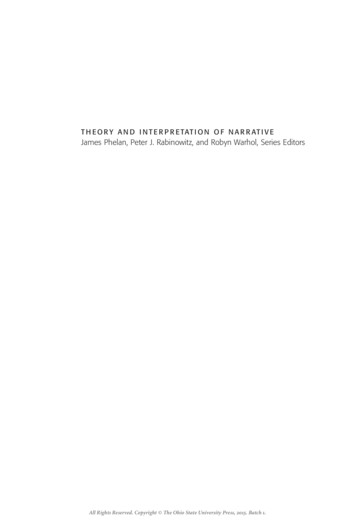
Example #3Residual Heparin postprotamineFibtem low normalExample # 4HyperfibrinolysisAptem ConfirmsHyperfibrinolysisCorrect hyperfibrinolysis firstFibtem no fibrinogen detection"flat line" CryoPlatelets
ROTEM Basic Interpretation Guide Parameter: Clotting Time CT - Clotting Time (seconds) – The time from the start of the test until first significant levels of a clot are detected.This measurement is initiated by addin