Transcription
Data Integration with Talend Open StudioRobert A. Nisbet, Ph.D.Most college courses in statistical analysis and data mining are focus on the mathematicaltechniques for analyzing data structures, rather than the practical steps necessary to createthem. But in the business world, the vast majority of situations suitable for data miningrequire data that are scattered in many different files, formats, databases, and tables.Complex procedures must be designed to perform the Extract, Transform, and Load ( ETL)functions necessary to bring this data from various sources systems and formats into acommon data structure suitable for data mining and statistical analysis.ExtractMany data mining projects require data that are housed in normalized data warehouses.Other data mining projects must access data from a variety of sources, each differentsystems stored in different formats and organizations. Some data may be extracted fromthe web through spidering or screen-scraping. Other data sources can be demographicdatabases and files. In any case, data must be extracted from source systems in adenormalized organization to create an analytical file composed on one record per entity(e.g. customer) associated with a number of attributes associated as fields (columns) in therecord.TransformThe transform operation applies a set of rules or functions to the extracted data to changethe data to conform to the required format, or to derive new factors (variables) for use indata mining. A detailed explanation of some transform operations commonly performed indata mining is presented below.LoadThe load operation inserts the processed data into some target data structure, usually adata warehouse. Processing for data warehouses augmentation involves loading the datainto the schema of the warehouse (normalized relational, Star Schema, or multidimensional). Data must be added to a data warehouse in the appropriate manner to beconsistent with database operations. Sometimes, data must be inserted in the sorted datastructure. Other times, input data must be used to update existing data elements. The loadcapabilities of the ETL tool provide this flexibility. For data mining, the load process consistsof adding model predictions to the data structure for future comparison and refinement ofmodels. Few data mining tools provide sufficient flexibility for loading data warehouses.Usually, these operations must be performed by dedicated data architect people, usingcomplex and very expensive data integration tools. Data miners who need data elementssuitable for data mining must work closely with data architects, or do it themselves. Datawarehousing was the first application area where these data integration operations wereperformed on a large-scale. Very large data warehouses were built by companies like IBM
and NCR to holding many terabytes of data in a highly organized structure suitable forefficient storage and retrieval of business information.The classical approach for performing these data integration operations was to write SQLprograms. A more modern approach was to use SAS, both for data integration andanalytical modeling operations. Even newer tools employ a menu-driven graphical userinterface (GUI) to orchestrate various data integration operations to create data structuresin a format suitable for data mining. The latest generation of data integration tools use agraphical programming user interface to built data flow diagrams composed of icons(components) configurable to conduct specific data operations, which are connected witharrows to show data flow pathways. These graphical representations are translated by thetool into lower-level operations and run to create the necessary output data structures.Examples of these tools include:1. Informatica2. Ab Initio3. Cognos4. Datastage5. Oracle Data Integrator6. Business Objects Data Integrator7. SQL Server Data Integration Services8. SAS DatafluxThese commercial ETL tools are complex and very expensive. But, there are some Open SourceETL frameworks available, including:1. Apatar2. Clover ETL3. Pentaho Project4. Talend Open StudioThe proper application of ETL tools for data warehousing can become very complex, and isoutside the scope of data mining requirements. Most data mining tools provide somecapabilities for extraction of data from databases, Excel spreadsheets, or flat files. The loadingoperations of ETL and not very important in data mining, but the transformation processes areextremely important. Data transformation includes all operations necessary to prepare dataset to be submitted to data mining algorithms.Transformation and Data PreparationTransformation applies a series of rules or functions to the extracted data from the source toderive the data for loading into the end target. Some data sources will require very little oreven no manipulation of data. In other cases, one or more of the following transformationtypes may be required to meet the business and technical needs of the target database:Table 1 lists some common transform operations, and an annotation listing:
ETL tool only – these operations are usually performed only by ETL tools, although somedata mining tools provide some form of these operation.Some DM tools – these operations are supported by some data mining toolsBoth – data mining and ETL tools share these capabilities.Operation1. Selection of some or all columns in a data streamToolETL tools only2. Relating fields of data sources with fields in differentorders (mapping) based on the contents of a specified (key)fieldETL tool only3. Joining data from multiple sources (including lookupand merge operations)ETL tools only4. Applying any form of simple or complex datavalidation. If validation fails, it may result in a full, partial orno rejection of the data, and thus none, some or all thedata is handed over to the next step, depending on the ruledesign and exception handling. Many of the abovetransformations may result in exceptions, for example,when a code translation parses an unknown code in theextracted dataETL tools only5. Translating coded values (e.g., if the source systemstores 1 for male and 2 for female, but the source systemstores M for male and F for female).Both6. Encoding free-form values (e.g., mapping “Ms” title tofemales)Both7. Encoding free-form values (e.g., mapping “Ms” title tofemales)Both
8. Deriving a new calculated value (e.g., sale amount qty * unit price)Both9. SortingBoth10. FilteringBoth11. Deriving a new calculated value (e.g., sale amount qty * unit price)Both12. Aggregation (for example, rollup - summarizingmultiple rows of data - total sales for each store, and foreach region, etc.)Some DM tools13. Transposing or pivoting (turning columns into rowsor vice-versa)Some DM tools14. Splitting a column into multiple columnsSome DM toolsTable 1. Common transformation operations performed by ETL tools only, some data miningtools, and both ETL and data mining toolsThose operations uniquely provided by ETL and data quality tools are provided in the TalendOpen System by two processing components: tJoin – Used to add fields (columns) to existing records based on common contents of aspecified field. tMap – Used to relate fields in two data sources that appear in different orders.While most of the ETL functions listed above can be performed by most data mining tools, thecomplex mapping and joining functions needed often to support data mining are not availablein data mining tools.Input Data Sets and SchemasBefore using the tJoin and tMap operations in Talend Open Studio, it is most convenient to loadthe input data schemas into the Repository. The Repository maintains a list of input and outputrecord structures (schemas) that can be referenced and maintained globally in the system. Forthis tutorial, two data sets are used as inputs, Data1 and Data2. These data sets contain
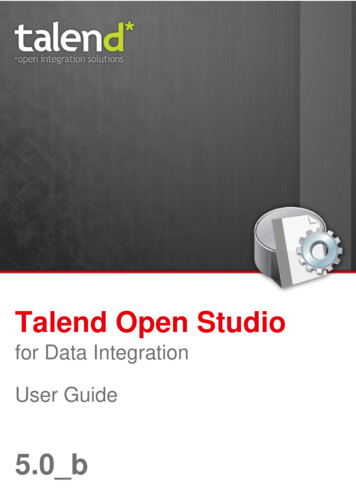
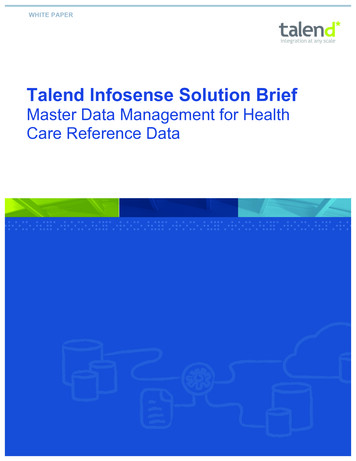
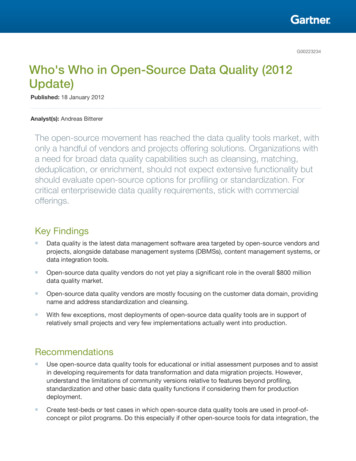
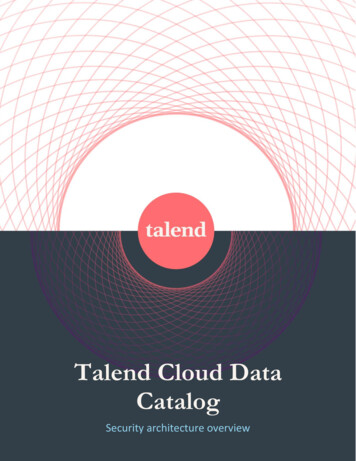
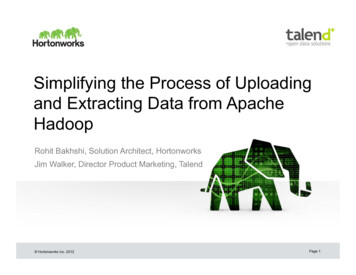
telecommunications data for customers stored in a different set of fields (different schemas).The initial challenge is to combine all of the fields for a give customer into one record (row) inthe output data structure (a file or database table). This operation is performed by joining thefields of one input data structure with those of another data structure. Using the Talend OpenSystem to prepare your data sets will accommodate a large variety of data manipulationoperations unavailable in the data mining tool.Joining OperationsThere are many kinds of joins supported by ETL tools. Consider the Venn diagram shown inFigure 1 below, consisting of two overlapping circles, representing matching and non-matchingrecords of two data structures. Various types of joins are defined by which different portions ofthe file coverage are selected.ABCFigure 1. Venn diagrams illustrating areas of matching and non-matching records (according tosome key field) for a left-join (A B), a right-join (B C), and an inner join to include onlymatching records (B).The tJoin Component of Talend Open SystemFor many data mining jobs, multiple data sources must be combined for a given entity (e.g.customer) to produce a single row in a data structure containing all fields of the input datasources. Joining two files consists of combining the fields (columns) of one data source with thefields of another data source whenever a key field matches (e.g. Customer Number). Joining isaccomplished by the tJoin component in Talend Open Studio. Figure 2 shows a sample join jobdesigned to combine two data sources.
The “Run” button to run this job.Figure 2. A sample join operation using the tJoin component.Each data source must be configured to access the appropriate data set according to therequested information in the Basic Settings pane at the bottom of Figure 2.To see the join conditions, double-click on the tJoin component to open the dialog box shown inFigure 3.
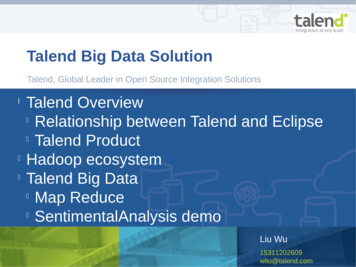
Figure 3. The tJoin dialog box, showing options to specify an inner join and to edit the schemaof the join.The inner join type is specified clicking the inner join option on the screen shown in Figure 3above. A left join is specified by leaving the inner join box open, and connecting the arrow fromthe “left” data source (Data1) to the tJoin component first, then connect the other data source(which will be treated as the “right” data source). The right data source will be treated as alook-up data source. A right join is not specified explicitly. If you want to perform a join forareas B and C in Figure 1 (which constitutes a logical right join), just connect the Data2 sourcefirst. The common field in each data source (the key) is specified in the definition of theschema in the Repository.To change the default mapping of input columns, click on the Edit schema box in the tJoindialog box to display the mapping schema shown in Figure 4 (select View Schema at theprompt, and click OK).
Figure 4. The tJoin field mapping schema for data source #1.Figure 5 shows the field mapping screen for data source #2.Figure 5. The tJoin field mapping schema for data source #2.The goal of the join operation is to add the fields from data source #1 to those of data source#2, resulting in a record for a given customer (CUST NO) with all the fields included.The left pane shows fields for the two input data sources (selectable by clicking on theappropriate tab). The right pane displays the selected fields from both files. By default, allfields from each file are selected. You can remove any input field from the output datastructure by highlighting it and clicking the left arrow in the middle of the display at the bottom.The output components shown in Figures 2 and 3 (DATA OUT) is a comma-delimited text file.Double-clicking on the component will permit configuration of the component to output thejoined data stream in the folder of your choice.When the configuration of all of the components in the job is complete, you can click on the“Run” button (indicated in Figure 3) to run the job. The resulting joined file is saved with thename and location specified in the DATA OUT text file output component.
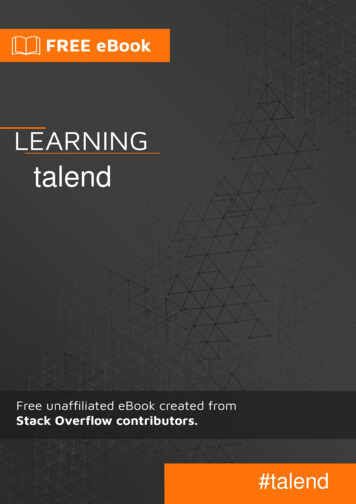
The tMap Component of Talend Open SystemFigure 6 shows a job that uses the tMap component to map which input fields relate to eachfield in the output data structure. Fields can be repositioned in the data records with thiscomponent.Figure 6. The Talend tMap component for mapping fields to an output data structure.Double-clicking on the tMap 1 component displays the tMap configuration screen below.Figure 7. The tMap configuration screen.
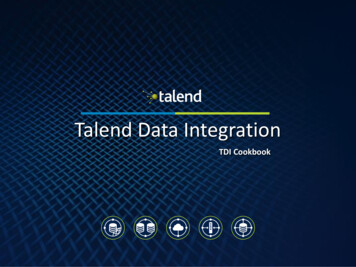
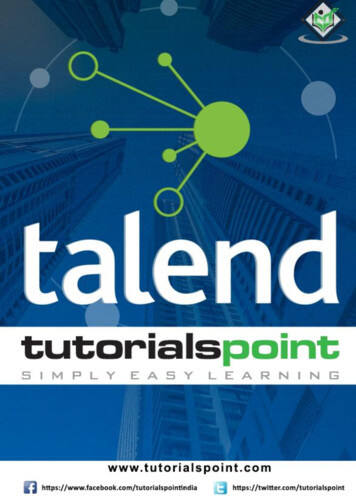
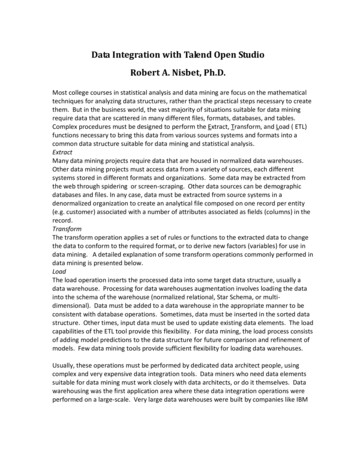
The upper display panes show the fields of the input and output schema connected with lines,which indicate the desired mapping. Notice that field #3 (Q CH1 1) in the left pane is mappedto the variable of the same name as field #10 in the output data structures. The tMap tabslocated between the upper and lower panes includes a tab for displaying the Expression Editor.Complex transformations of variables can be performed, using either Perl or Java code(configurable upon installation).The combination of the tJoin and tMap components permits you to perform many complexdata manipulation operations not supported by data mining tools. The combination of the datamining tool and Talend Open Studio can enable the processing of all of the steps in a datamining project, following one of the standard process models (e.g. CRISP-DM). The followingdiscussion of the CRISP-DM data mining process model is found in Nisbet, et al. (2009).CRISP-DMThis format for expressing the data mining process is the most complete available. It wascreated by a consortium of NCR, ISL (creators of IBM Predictive Analytics Workbench (formerly,Clementine), and Daimler-Benz companies. The process defines a hierarchy consisting of majorphases, generic tasks, specialized tasks, and process instances. The major phases are related inFigure 8 below as it is applied to fraud modeling.Cross Industry Standard Process for Data Mining(CRISP-DM) - Fraud Detection illustrationHow can we improvethe current frauddetection process?How is fraud defined?How can we insertthe model intoexisting processes?Do we have verifiedexamples of fraud?What attributes areavailable?Do we need tocleanse or modifyattributes? Howsample population?Which algorithm(s)will produce thebest results?Are we meetingperformanceobjectives? What arethe problem areas? 2008 Elder Research, Inc.37
Figure 8. Phases of the CRISP-DM process. The dashed arrows are added to indicate additionaldata flow pathways necessary to update the database and business understanding.The dashed arrows shown in Figure 8 represent the closing of the “loop”, enriching the BusinessUnderstanding and adding predictions to the data base. Each phase of the process consists of anumber of second level generic activities, each with several specialized operations. A fourthlevel (Tasks) could be defined in this process, but these tasks are very domain-specific, that isthey must be defined in terms of the specific business problem to be solved in the context ofthe specific data used to solve it. See Nisbet, et al. (2009) for a detailed description of theCRISP-DM process.ReferencesNisbet, R, J. Elder, and G. Miner. 2009. The Handbook of Statistical Analysis & Data MiningApplications. Academic Press (Elsevier). Burlington, MA.
Data Integration with Talend Open Studio Robert A. Nisbet, Ph.D. Most college courses in statistical analysis and data mining are focus on the mathematical techniques for analyzing data structures, rather than the practical steps necessary to create them. But in the business world, the vast majorit