Transcription
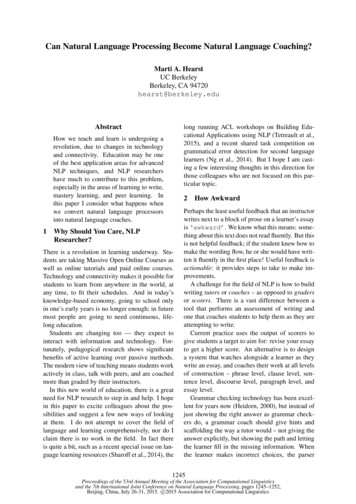
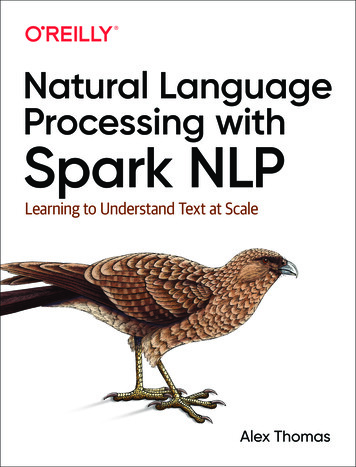
QUANTAMENTAL RESEARCHSeptember 2017Natural Language Processing – Part I: PrimerUnveiling the Hidden Information in Earnings CallsAuthorFrank ZhaoQuantamental Research617-530-8107fzhao@spglobal.comInterest in natural language processing (NLP) has grown in earnest since Turing’s1publication “Computing Machinery and Intelligence” in 1950. In his seminal work, Turing laidout his criterion for intelligence – a computer could be considered intelligent if it can interactwith humans without them ever realizing they were dealing with a machine. NLP at its core isthe embodiment of that vision where consumers of NLP obtain useful insights from datawithout ever needing to know whether they are interacting with a machine.Given the growing interest in NLP among investors, we are publishing this primer todemystify many aspects of NLP and provide three illustrations, with accompanying Pythoncode, of how NLP can be used to quantify the sentiment of earnings calls. In our firstexample below, sector-level sentiment trends are generated providing insights aroundinflection points and accelerations. The other two illustrations are: i) stock-level sentimentchanges and forward returns ii) language complexity of earnings calls (Section 4).S&P 500 Earnings Call Sentiment TrendsNote: Sentiment is defined as the proportion of negative words in an earnings call using Loughran and McDonald(2011) 2 . Sentiment changes are measured quarter-over-quarter from four quarters ago where the values aremultiplied by -1 to make them easier to interpret. Sector-level values are rolled up equally from the stock-level. Realestate is rolled into Financials. Source: S&P Global Market Intelligence Quantamental Research, as of 08/08/2017.The paper is laid out into four sections: What is NLP? – We demystify common NLP terms (Section 2) and provide anoverview of general steps in NLP (Section 2). Why is NLP important? – Forty zettabytes (10 21 bytes) of data are projected to3be on the internet by 2020, out of which more than eighty percent of the data areunstructured in nature, requiring NLP to process and understand (Section 3). How can NLP help me? – We derive insights from earnings call transcripts via NLPmeasuring industry-level sentiment trends or language complexity of earnings callsand much more (Section 4). Where do I start? – Code for each use case is enclosed, enabling users to replicatethe sentiment analysis (Section 6).12Turing, A.M. “Computing Machinery and Intelligence.” Mind 49 (1950), 433-460.Loughran, T., AND B. McDonald. “When is a Liability not a Liability? Textual analysis, Dictionaries, and 10‐Ks.”Journal of Finance 66 (2011), 35-65.3Mearian, L. (2012, Dec. 11). By 2020, there will be 5,200 GB of data for every person on Earth. Retrieved fromhttp://www.computerworld.com.
Unveiling the Hidden Information in Earnings Calls1. IntroductionNLP dates back to as early as the seventeenth century, when philosophers and polymathssuch as Gottfried Leibniz and Rene Descartes put forth theoretical proposals to relate wordsbetween languages. The first patents for translating machines were filed in the 1930s byGrigor Artsrouni, an Armenian journalist and writer. In 1950, Alan Turing, the coiner of theTuring Test, published his seminal article “Computing Machinery and Intelligence”. In 1957,Noam Chomsky’s “Syntactic Structures” revolutionized linguistics with his ‘universalgrammar’, a collection of rules based off of syntactic structures. Through the 1980s, all NLPsystems were primarily based on complex sets of hand-written rules and not until the late1980s did statistical algorithms start to replace the hand-written rules and gain ubiquity. Inthe following sections, we try to touch on (almost) every aspect of basic NLP such that bythe end of the primer we hope our readers not only have a foundational knowledge of thesubject, but also able to perform simple NLP using our shared code snippets.2. What is NLP? – Definitions & StepsIn this section, we demystify a number of NLP related terms and provide our readers withour simple definitions that will serve as a foundation for all subsequent sections. Then, wewill walk our readers through the major steps within a NLP process.2.1 DefinitionsTerms such as big data, alternative data, machine learning, supervised learning andunsupervised learning are being thrown around in the context of NLP. What exactly do theymean? In fact, what does NLP itself really mean?2.1.1 Definitions: Overarching TermsNatural Language Processing (NLP): leveraging computers and statistics to process andmake sense of language in a systematic and sensible way that doesn’t involve humanintervention besides coding.Artificial Intelligence (AI): is the process of building systems (that ingest data, use differentlearning techniques on the data to create intelligence and then output that intelligence) thatcan do intelligent – i.e., human-like – things. Our take is that true AI is still some time away,45but Google AlphaGo and Facebook seem to have made strides recently. This is theultimate goal.4Mozur, P. (2017, May 25). Google’s A.I. Program Rattles Chinese Go Master as It Wins Match. Retrieved fromhttp://www.nytimes.com.5LaFrance A. (2017, June 15). An Artificial Intelligence Developed Its Own Non-Human Language. Retrieved fromhttps://www.theatlantic.com.QUANTAMENTAL RESEARCH SEPTEMBER 2017WWW.SPGLOBAL.COM/MARKETINTELLIGENCE2
Unveiling the Hidden Information in Earnings Calls2.1.2 Definitions: Categories of DataStructured Data: a data set that has been cleaned of errors, processed to a standardizedformat and readily stored in a carefully designed SQL database.Unstructured / Big / Alternative Data: these terms describe a subset of newly created datathat hasn’t been (or fully) explored, cleaned and processed. It is usually heavy with text, butmay also include audio and/or visual data. All data that does not qualify as structured isunstructured.2.1.3 Definitions: Categories of Learning MethodsMachine Learning (ML): a set of statistical methods to help make sense of a data set togain a useful insight or to automate a task. A computer or data scientist uses the term“machine learning” whereas a pure statistician may use “applied statistics’’ or an economistmay use “econometrics”. There are two major categories to which all algorithms in machinelearning belong: supervised and unsupervised learning. See details below.Deep Learning (DL): is a subfield of machine learning. It is most commonly implementedusing a neural network that takes its design from the human brain – a network of neuronsthat are connected by synapses. One way to visualize deep learning via a neural network isthat the learning is organized as a cylindrical-shaped hierarchy of concepts, where theconcepts could be non-linear. The concepts increase in complexity as one moves from thetopmost layer to the bottommost one. The main difference between machine learning anddeep learning is that the performance of deep learning algorithms increases linearly as theamount of input data increases whereas the performance of machine learning algorithmsplateaus.Supervised Learning (SL): A category of machine learning or deep learning in which theresearcher or data scientist feeds an algorithm some training data such that the algorithmhas ex-ante ‘rules’ (e.g., the data points are linearly related, the data points follow the normaldistribution or the data points have certain probabilities of taking on certain values).Examples of supervised learning methods are linear regression, Bayesian statistics anddecision trees.Unsupervised Learning (UL): A category of machine learning or deep learning in whichthe algorithms themselves find ‘hidden’ patterns by sorting data points into different groupsor categories until the algorithms find an optimal divide. It is like an optimization problem (forthose readers who have an operational research background) where the algorithm is tryingdifferent groupings until it finds a global or a local ‘maximum’ or ‘minimum’. The maindifference from supervised learning is that no ‘rules’ or training data sets are given.Examples of unsupervised learnings methods are clustering, and PCA expectationmaximization.QUANTAMENTAL RESEARCH SEPTEMBER 2017WWW.SPGLOBAL.COM/MARKETINTELLIGENCE3
Unveiling the Hidden Information in Earnings Calls2.1.4 Definitions: OthersTokens: words or entities (e.g., punctuations, numbers, URLs, etc.) present in a text.Tokenization: the process of converting a text (a list of strings) into tokens.2.2 General Steps in NLPThere are generally three major steps in NLP (see details below): text preprocessing, text tofeatures and testing & refinement. Text preprocessing includes noise removal, lexiconnormalization and objective standardization. Text to features includes syntactical parsing,entity parsing, statistical features and word embedding. Lastly, testing & refinement stepincludes the designing, the calibrating and the refining of a model that is the engine whichhelps users to extract useful information from a content set or perform an automated task.2.2.1 Text PreprocessingNoise removal is cleaning of textual data by stripping away anything that is not relevant tothe task at hand including but not limited to the removal of acronyms, punctuations andnumbers. Usually, URLs, hashtags, acronyms and stopwords (e.g., words like the) areremoved. In fact, anything that isn’t relevant to one’s analysis could be considered as noise.One solution that we used is to come up with a defined set of words and entities such thateverything else was removed as noise.Lexicon normalization is the method of standardizing multiple representations that areexhibited by a single word (e.g., different inflections of a word: e.g., play, plays, played, etc.).Two commonly used solutions are stemming and lemmatization. The goal of both is toreduce inflectional forms and derivationally related forms of a word to its root. Stemming is acruder process of chopping off the suffix of different inflections of a word whereaslemmatization removes inflectional endings to return a word to its root morphologically.Object standardization is the process of converting shorthand forms or variant spellings tothe formal spelling (e.g., luv to love). One solution is to use a comprehensive dictionary andall misspellings and abbreviations are considered noise and removed.2.2.2 Text to FeaturesSyntactical Parsing is commonly broken into two types of analysis: dependency grammarand part of speech tagging (PoS). They are used to model out the structure of sentences.Dependency is in the context of grammar. Each sentence is broken down into a tripletrelation (i.e., relation, governor and dependent). One can think of the triplet relation ingrammar terms as the subject, the verb and the direct (or indirect) object in a sentence.Typically a tree is used to represent the triplet graphically. The main idea of syntacticalparsing is to take into account sentence structures before processing a text.QUANTAMENTAL RESEARCH SEPTEMBER 2017WWW.SPGLOBAL.COM/MARKETINTELLIGENCE4
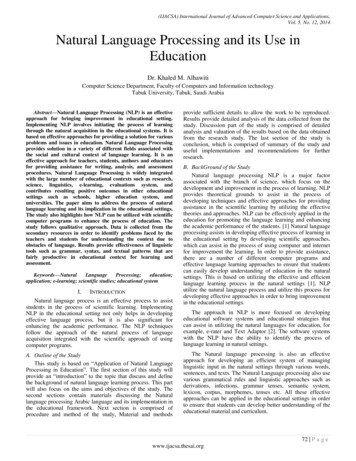
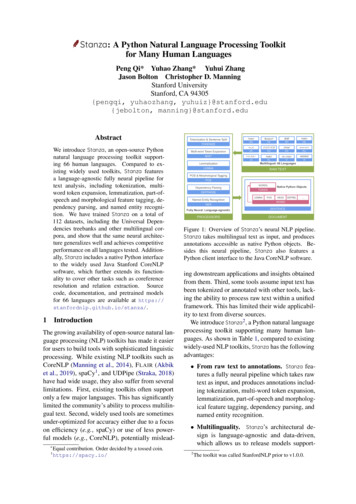
Unveiling the Hidden Information in Earnings CallsAnother common tool to understand syntax is PoS. For instance, many English words cantake on different parts-of-speech depending on context (e.g., book – book a flight or readinga book). By having PoS taggings, NLP has additional information to process and understandwords from the PoS dimension.Statistical features are the numerical results of converting a text into quantifiablecharacteristics. Common examples are a count of words, sentences or syllables from a text.From there, one can derive, for instance, the sentiment (i.e., the tone) of a text by countingthe proportion of negative words in that text or the readability of a text (e.g., Gunning FogIndex) by calculating the average word count per sentence and the proportion of polysyllabicwords in that text.Word EmbeddingA more advanced statistical feature is word embedding, a method of using a vector ofnumbers to capture different dimensions of a word. Intuitively, one can think of eachdimension (i.e., number) as a usage for that word, but in actual implementation thedimensions aren’t known.Exhibit 1 provides a simple illustration of word embedding. The far left column contains thedifferent dimensions of each word that we are trying to understand. The numbers arenumerical representations of each of the dimensions that are generated from a training dataset. For example, the value of each cell in our illustration is bounded between zero and oneinclusively where the magnitude of the values shows the strength of the relationshipbetween the word and the dimension (e.g., Queen and Royalty are extremely closely relatedby the value 0.990 whereas King and Femininity isn’t closely related as the value of 0.050indicates). As one can imagine if we created hundreds of dimensions for each word, eachnumber in the vector effectively captures one contextual usage of that word.Exhibit 1: Simple Example of Word 600.100Note: values are fictitious for illustration purposes and the dimensions are unknown in realitySource: S&P Global Market Intelligence Quantamental Research. Drozd et al., (2016)6.As the number of dimensions increases, word embedding would effectively map out all thedifferent contexts that a word can be used with numerical values indicating the strength of6Drozd, A., Gladkova, A., Matsuoka, S. “Word Embeddings, Analogies, and Machine Learning: Beyond King – Man Woman Queen”. Proceedings of COLING 2016, the 26th International Conference on ComputationalLinguistics: Technical Papers, pages 3519–3530QUANTAMENTAL RESEARCH SEPTEMBER 2017WWW.SPGLOBAL.COM/MARKETINTELLIGENCE5
Unveiling the Hidden Information in Earnings Callsthat particular association. For instance by applying vector math to our example, wordembedding has learned the concept of ‘gender’ without us explicitly teaching it that concept(e.g., when you do the vector math: king - masculinity femininity queen). Wordembedding is one of the fastest growing, cutting-edge techniques where it has been the7main tool for a number of major breakthroughs in the NLP space.2.2.3 Testing, Refinement & Assessment of EfficacyTesting & refinement is the final step in the process. Testing refers to whether NLP hasperformed a task well using a threshold (e.g., 60% of actual incoming spam emails arecategorized as spam emails) that is pre-defined by the user. Refinement is the repeatedcalibration of the NLP algorithm until it meets the modeler’s efficacy threshold. In order tomitigate the risk of data mining, one usually takes the entire input data set and divides it intoat least three parts. For instance, fifty percent of the data (perhaps randomly chosen) aredesignated as the training set and the other fifty percent is set aside as the evaluation set.The training set is then further divided into two equal halves where one of which (basically25% of the overall data) is labeled as the development set and the other (the other 25%) isdesignated as the development test set.Total data set (100 %) Development Set (50%) Evaluation Set (50%)Development Set (50%) Training Set (25%) Development Testing Set (25%)The idea is that a model is calibrated on the development training set and the testing of thatmodel’s efficacy is done on the development test set. Once the modeler is happy with all therefinements then she takes her model (where she no longer makes any changes at least forthe time being) to the evaluation set for the final efficacy testing. For those who are familiarwith empirical research, the concept is the same as setting aside in- and out-of-sample datasets. Now using our earlier spam email illustration, the modeler validates her algorithm bylooking at the emails that are sorted to the spam email folder. Her algorithm is deemedsuccessful if its success rate in the evaluation set is equal to or greater than her pre-definedthreshold for success of 60%.3. Why is NLP Important?Approximately two and a half exabytes (10 18) of unstructured data are created daily on the8internet right now. In fact to put things into perspective, the amount of unstructured datathat was created in the past two days since you have read this primer is equivalent to thesame amount of data that was created from the beginning of humankind through the end of7Mikolov T., Yih W., Zweig G. “Linguistic Regularities in Continuous Space Word Representations.” Proceedings ofNAACL-HLT (2013), 746–751.8Khoso, M. (2016, May 13). How Much Data is Produced Every Day? Retrieved from http://www.northeastern.edu.QUANTAMENTAL RESEARCH SEPTEMBER 2017WWW.SPGLOBAL.COM/MARKETINTELLIGENCE6
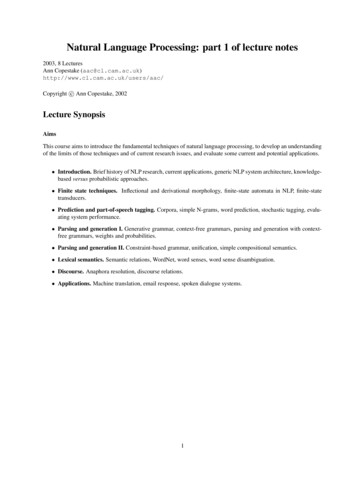
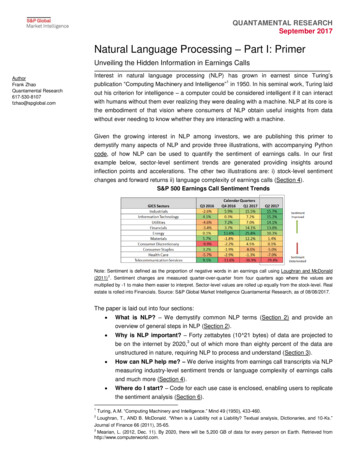
Unveiling the Hidden Information in Earnings Calls92003. According to International Data Corporation (IDC), eighty percent of all available dataover the internet are unstructured and the growth rate gap between unstructured andstructured data is only widening (Exhibit 2). Humans have two ways to process, understandand harness the informational content of these vast, relatively untapped content sets –manual processing, which is infeasible, or automatic processing, where NLP comes intoplay.Exhibit 2: Historical Growth of Unstructured & Structured DataSource: S&P Global Market Intelligence Quantamental Research. IDC. 2015.4. How Can NLP Help Me? – Insights from Earnings CallsIn this section, we illustrate several NLP insights from use cases stemming from S&P GlobalMarket Intelligence’s earnings call transcripts: Use Case 1: An analysis of the historical relationship between a stock’s sentimentchanges vs. its forward returns Use Case 2: A heat-map of industry-level sentiment trends Use Case 3: Language complexity of earnings calls and sell-side analyst selectivitywent hand-in-hand in Q2 2017, when managers wanted to soften bad news. Use Case 4: Firms with the highest sell-side analyst selectivity ratio underperformedby 2.14% in Q2 2017. This non-NLP use case highlights the speaker typesegmentation feature of earnings call transcripts.9DeAngelis, S. F. (2014, Feb.). The Growing Importance of Natural Language Processing [Web log post]. RetrievedAug 8, 2017, from http://www.wired.comQUANTAMENTAL RESEARCH SEPTEMBER 2017WWW.SPGLOBAL.COM/MARKETINTELLIGENCE7
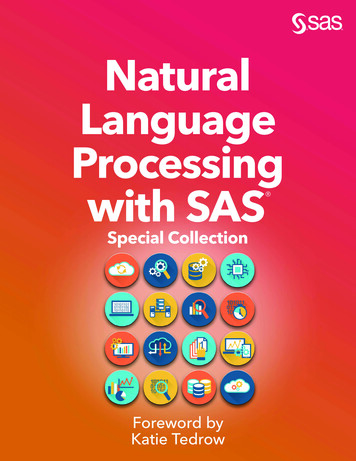
Unveiling the Hidden Information in Earnings Calls4.1 Details on Loughran and McDonald (2011) Financial DictionaryIn use cases 1 and 2, sentiment changes are measured at the stock-level and at the industrygroup-level. How is sentiment defined exactly? There are many ways to define sentiment.We use a bag-of-words approach where the sentiment word lists are from the Loughran andMcDonald (2011) financial dictionary. Their dictionary has become the de facto financialdictionary for NLP analysis due to its accessibility, its comprehensiveness, its financialspecific context, its lack of dependency on the transitory nature of its words and, lastlyand perhaps most importantly, its unambiguous and singularly connoted words. Detailsbelow. Accessibility – their word lists are readily accessible because they are freely postedonline. Comprehensiveness – the dictionary is comprehensive such that it is difficult formanagers to game the system (i.e., circumvent certain words that have empirically beenshown to lead to future stock underperformance) because they start with everyconceivable English word with all inflections of a word, totaling 80,000 distinct words inthe master word list. Financial-specific context - they filter their initial master word list down to theirsentiment word lists by examining 10-K filings between 1994 and 2008 inclusively. Permanence of words - their master and sentiment word lists are less transitorybecause they start with the most comprehensive list of English words possible and,more importantly, the master word list doesn’t rely on transitory terms such as iphone. Unambiguous and Singularly Connoted Words - they arrive at their sentiment wordlists containing unambiguous and singularly connoted words by looking at the mostfrequently occurring words in the 10-Ks from the master word list. From there, they wentword-by-word and assessed each of the word’s meaning in a business context. At theend of their process, the words that ended up in their word lists are less ambiguous intheir meaning with singular connotation.Their three most important lists of words for our use cases are the master word list, positiveand negative sentiment word lists with distinct word counts of 80,000 , 350 and 2300 ,respectively. Examples of positive words are able, abundance, acclaimed, accomplish andso forth. Examples of negative words are abandon, abdicate, aberrant, abetting and so forth.4.2 Stock-Level Sentiment TrendsThe first use case is to capture the historical relationship of Apple Inc.’s sentiment levelchanges from its earnings calls and its forward returns until the next call (Exhibit 3). Thechanges in sentiment are defined as quarter-over-quarter (QoQ) changes from four quartersago (to account for seasonality). The sentiment of each of Apple’s earnings calls is definedQUANTAMENTAL RESEARCH SEPTEMBER 2017WWW.SPGLOBAL.COM/MARKETINTELLIGENCE8
Unveiling the Hidden Information in Earnings Callsby the proportion of negative words in its earnings call transcript where the classification ofboth the negative and the master word list is based on the Loughran and McDonald (2011)financial dictionary. Because sentiment in this use case is measured with negative words,positive (negative) changes reflect sentiment deterioration (improvement). Apple’s forwardreturns until its future calls have been shifted back a quarter such that its sentiment changesand its forward returns are aligned vertically in the Exhibit. One promising observation is thatthe Pearson correlation is about -0.30 since Q1 2009, which suggests that Apple’s forwardreturns historically go down when its sentiment deteriorates.Exhibit 3: Stock Level – Sentiment Change vs. Forward ReturnsNote: Sentiment is defined as the proportion of negative words in an earnings call using Lougrahan and McDonald(2011). Sentiment changes are measured quarter-over-quarter from four quarters ago. Source: S&P Global MarketIntelligence Quantamental Research. Data as of 08/08/2017.4.3 Industry-Level Use Case: Trends in Sentiment ChangesThe second use case provides a heat map showing sentiment trends for S&P 500 GICSindustry groups. Exhibit 4 shows quarterly sentiment changes for 24 GICS industry groupsby calendar quarter between Q3 2016 and Q2 2017 inclusively. The industry groups aresorted by their sentiment changes from Q2 2017 in descending order. Similar to the Apple’sexample from above, all the sentiment values are QoQ changes from four quarters agowhere each industry group’s sentiment is aggregated, on an equal-weighted basis, from thestock-level where the sentiment is measured using the proportion of negative words in astock’s earnings call. In order to make the interpretation more intuitive, we multiplied thevalues by negative one so green (red) values denote improvement (deterioration) insentiment for the industry groups and the different color shades reflect the magnitude ofsentiment changes.One could easily visualize sentiment trends for an industry group and spot potentialinflection points and accelerations. For example, the sentiment improved substantially forbanks between calendar quarter Q4 2016 and Q1 2017. Investors would notice this as anQUANTAMENTAL RESEARCH SEPTEMBER 2017WWW.SPGLOBAL.COM/MARKETINTELLIGENCE9
Unveiling the Hidden Information in Earnings Callsinflection point to the upside and could potentially use the insight as an additional piece ofinformation in their investment decision making process.Exhibit 4: S&P 500 Trends in Sentiment ChangeNote: Sentiment is defined as the proportion of negative words in an earnings call using Lougrahan and McDonald(2011). Sentiment changes are measured quarter-over-quarter from four quarters ago where the values aremultiplied by -1 to make results easier to interpret. Industry group level values are rolled up equal-weighted from thestock-level. Source: S&P Global Market Intelligence Quantamental Research. Data as of 08/08/2017.4.4 Does Language Complexity of Earnings Calls and the Sell-Side Analyst Selectivity RatioGo Hand-in-Hand?The third use case showcases the segmentation of S&P Global Market Intelligence’searnings call transcripts by speaker types specifically looking at sell-side analysts. The casedemonstrates whether managers who have bad news may be attempting to soften thatnews. We examined the following two dimensions: the language complexity of earnings callsand the selectivity of sell-side analysts who are picked to ask questions during earnings callsin the form of a ratio.4.4.1 Defining Gunning Fog Index & Our HypothesisThe language complexity of earnings calls is measured using the (Gunning) fog index (seethe y-axis of Exhibit 5), which measures the number of years of formal education that oneneeds to understand the diction used in the analyzed text (e.g., 16 is equivalent to someonewho has completed an undergraduate degree), in our case an earnings call transcript. Thefog index has two inputs: the average number of words per sentence and the proportion ofQUANTAMENTAL RESEARCH SEPTEMBER 2017WWW.SPGLOBAL.COM/MARKETINTELLIGENCE10
Unveiling the Hidden Information in Earnings Callspolysyllabic words (threshold is 3 syllables or higher). A higher number of words persentence and/or a higher proportion of polysyllabic words in a text would result in anincrease in the fog index.Why might a fog index be a good proxy to assess whether managers are trying to soften badnews? First, we surmise that when news is bad (e.g., missed earnings) managers need todisclose it due to their legal or fiduciary obligations. Hoping to mitigate the effect of the newson their stock prices, they may provide long-winded ‘explanations’ of the news, whereas inthe quarters with good news answers to sell-side analysts tend to be shorter and moredirect. Secondly, managers may give more long-winded answers to drain the time remainingin the Q&A section of an earnings call where the historical average duration of earnings callsis about an hour.4.4.2 Defining Sell-Side Analyst Selectivity Ratio and Our HypothesesThe sell-side analyst selectivity ratio is defined as the percent of the active sell-sidecoverage that are allowed to ask questions during an earnings call. For instance, Apple Inc.has forty active sell-side coverages prior to one of its earnings calls and its managementallowed 10 of the analysts to ask questions, which translates to an analyst selectivity ratio of25% and in our narrative is interpreted as a high analyst selectivity ratio and viewednegatively.Our hypothesis is that when a firm has good financial results, it wants everyone to know,especially sell-side analysts because they are great messengers to buy-side moneymanagers and traders. Answers to sell-side questions tend to be shorter and more directwhen firms are doing well, which in turn enables managers to allow more analyst questions.When financial results are less favorable, the percent of sell-side analysts who get to askquestions declines due to two possible reasons. One is that managers tend to have lengthierexplanations as to why the negative results are perhaps transitory, which consumesadditional time that would otherwise be allocated to taking additional analyst questions.Secondly, managers may take multiple questions from analysts who may have a positiveview on their firms.Naturally, there are other ways of measuring analyst selectivity ratio (or languagecomplexity). For instance, one potential issue with this analyst selectivity ratio is that it mayhave a market-capitalization bias. If a firm has a great number of sell-side analysts coveringit, it is generally harder for a firm to call on every analyst who has an active coverage (e.g.,Apple Inc. called only 7 of the 43 analysts during its calendar quarter Q2 2017). Becausegenerally larger market-caps have a greater number of sell-side coverage, larger (smaller)market-cap firms may always have a higher (lower) analyst selectivity ratio. In calendar Q22017 using a snapshot of market-caps on Mar. 31, 2017, the spearman correlationQUANTAMENTAL RESEARCH SEPTEMBER 2017WWW.SPGLOBAL.COM/MARKETINTELLIGENCE11
Unveiling the Hidden Information in Earnings Callsbetween each firm’s analyst selectivity ratio and its market-cap is -0.14.10The -0.14correlation result suggests that there is a relationship between a firm’s analyst selectivityratio and its market-cap (i.e., firms with larger market-caps have lower analyst selectivityratios), but it isn’t very strong. Thus, we are using this flavor of analyst selectivity ratio for theuse case without further consideration, mainly because we want to keep the narrative assimple as possible.4.4.3 Results & InterpretationIn use case 3 (Exhibit 5), our results in Q2 2017 do seem to indicate that firms withmanagers whose language complexity during earnings calls is higher also took a smallerproportion of questions from their active sell-side coverage. This relationship is capturedstatistically by the best-fitted, downward sloping orange-dotted line with a t-statistic of about11-2.5 .Exhibit 5: Language Complexity of Earnings Call versusSell-Side Analyst Selectivity Ratio S&P 500 – Q2 2017Source: S&P Global Market Intelligence Quantamental Research. Data as at 08/08/20174.5 Firms with the Highest Sell-Side Analyst Selectivity Underperformed in Q2 2017In our final use case 4, we continue the narrative from use case 3 where we examine theforward returns of firms whose managers called on a smaller percentage of their active sell-10The spearman correlation between each firm’s number of active analyst coverage and its market-ca
Natural Language Processing (NLP): leveraging computers and statistics to process and . researcher or data scientist feeds an algorithm some training data such that the algorithm has ex-ante ‘rules’ (e.g., the data points ar