Transcription
The Political Legacy of American SlaveryAvidit Acharya, Stanford UniversityMatthew Blackwell, Harvard UniversityMaya Sen, Harvard UniversityWe show that contemporary differences in political attitudes across counties in the American South in part trace theirorigins to slavery’s prevalence more than 150 years ago. Whites who currently live in Southern counties that had highshares of slaves in 1860 are more likely to identify as a Republican, oppose affirmative action, and express racial resentment and colder feelings toward blacks. We show that these results cannot be explained by existing theories, including the theory of contemporary racial threat. To explain the results, we offer evidence for a new theory involvingthe historical persistence of political attitudes. Following the Civil War, Southern whites faced political and economicincentives to reinforce existing racist norms and institutions to maintain control over the newly freed African Americanpopulation. This amplified local differences in racially conservative political attitudes, which in turn have been passeddown locally across generations.For the first 250 years of American history, white landowners, predominantly from the South, enslaved millions of individuals of African descent. This “peculiarinstitution,” as it was sometimes called, defined the social,economic, and political landscape of the American Souththroughout this period. Slavery was so crucial to the Souththat one Georgia newspaper editor wrote, “Negro slavery isthe South, and the South is negro slavery” (cited in Faust1988, 60). Yet, despite slavery’s prominence in shaping American history, and despite volumes written by economists andhistorians on its consequences, political scientists have largelyoverlooked how American slavery and the events followingits abolition could continue to influence the South’s contemporary politics. Given recent findings on the long-termconsequences of past events and institutions (Acemoglu,García-Jimeno, and Robinson 2012; Dell 2010; Nunn andWantchekon 2011; Voigtländer and Voth 2012), it would besurprising if such a fundamental aspect of American historyhad no persistent impact on American politics.In this paper, we show that the local prevalence ofslavery—an institution that was abolished 150 years ago—has a detectable effect on present-day political attitudes inthe American South. Drawing on a sample of more than40,000 Southern whites and historical census records, weshow that whites who currently live in counties that hadhigh concentrations of slaves in 1860 are today on averagemore conservative and express colder feelings toward African Americans than whites who live elsewhere in theSouth. That is, the larger the number of slaves per capita inhis or her county of residence in 1860, the greater theprobability that a white Southerner today will identify as aRepublican, oppose affirmative action, and express attitudesindicating some level of “racial resentment.” We show thatthese differences are robust to accounting for a variety offactors, including geography and mid-nineteenth-centuryeconomic and social conditions. These results strengthenwhen we instrument for the prevalence of slavery usinggeographic variation in cotton-growing conditions.We consider several explanations for our results rootedin contemporary forces and find each to be inconsistentwith the empirical evidence. For example, we consider thepossibility that whites are simply more racially conservativewhen exposed to larger black populations—the centralfinding of the literature on racial threat (Blalock 1967;Avidit Acharya (avidit@stanford.edu) is an assistant professor at Stanford University, Stanford, CA 94305; web: http://stanford.edu/ avidit. MatthewBlackwell (matt blackwell@harvard.edu) is an assistant professor at Harvard University, Cambridge, MA 02138; web: http://www.mattblackwell.org. MayaSen (maya sen@hks.harvard.edu) is an assistant professor at Harvard University, Cambridge, MA 02138; web: http://scholar.harvard.edu/msen.Data and supporting materials necessary to reproduce the numerical results in the paper are available in the JOP Dataverse (https://dataverse.harvard.edu/dataverse/jop). An online appendix with supplementary material is available at http://dx.doi.org/10.1086/686631.The Journal of Politics, volume 78, number 3. Published online May 19, 2016. http://dx.doi.org/10.1086/686631q 2016 by the Southern Political Science Association. All rights reserved. 0022-3816/2016/7803-0001 10.00This content downloaded from 128.103.149.052 on June 15, 2016 06:28:11 AMAll use subject to University of Chicago Press Terms and Conditions (http://www.journals.uchicago.edu/t-and-c).621
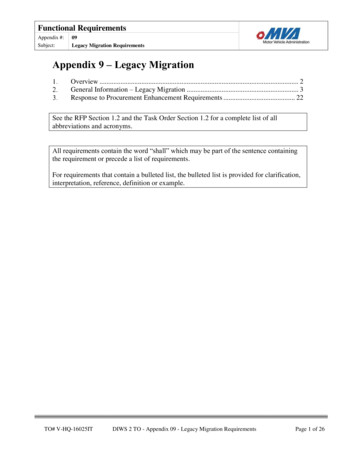
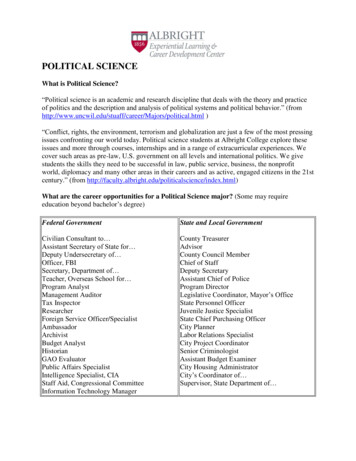
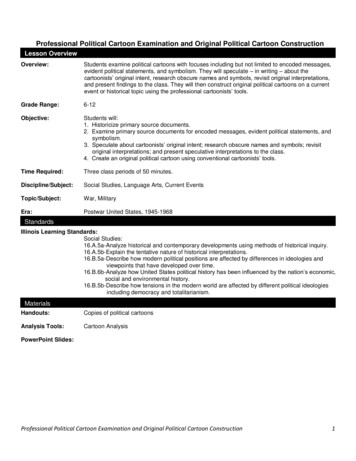
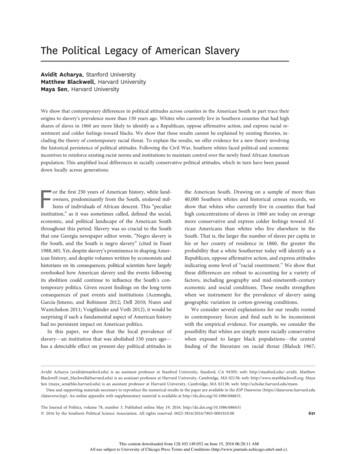
622 / The Political Legacy of American Slavery Avidit Acharya, Matthew Blackwell, and Maya SenBlumer 1958; Key 1949). However, when we estimate thedirect effect of slavery on contemporary attitudes (Acharya,Blackwell, and Sen, forthcoming), we find that contemporary shares of the black population explain little of slavery’seffects. We also test various other explanations, includingthe possibility that slavery’s effects are driven exclusively bytwentieth-century population shifts or income inequalitybetween African Americans and whites. We find no evidence that these contemporary factors and theories of population sorting fully account for our results. Introducingindividual-level and contextual covariates commonly used inthe public opinion literature also does not explain away ourfinding.To explain our results, we instead propose a theory ofthe historical persistence of political attitudes. The evidencesuggests that regional differences in contemporary white attitudes in part trace their origins to the late slave period andthe time period after its collapse, with prior work suggesting that the fall of slavery was a cataclysmic event that undermined Southern whites’ political and economic power.For example, Du Bois (1935), Foner (2011), and Key (1949),among others, have argued that the sudden enfranchisementof blacks was politically threatening to whites, who for centuries had enjoyed exclusive political power. In addition, theemancipation of Southern slaves undermined whites’ economic power by abruptly increasing black wages, raising labor costs, and threatening the viability of the Southern plantation economy (Alston and Ferrie 1993; Ransom and Sutch2001). Taken in tandem with massive preexisting racial hostility throughout the South, these political and economicchanges gave Southern Black Belt elites an incentive to further promote existing anti-black sentiment in their local communities by encouraging violence toward blacks and racistattitudes and policies (Roithmayr 2010). This amplified thedifferences in white racial hostility between former slaveholding areas and non-slaveholding areas and intensifiedracially conservative political attitudes within the Black Belt.These have been passed down locally, one generation to thenext.We provide empirical support for this mechanism byshowing that areas of the South that were the earliest toeliminate the political and economic incentives for anti-blackviolence—for example, by adopting new technologies, suchas tractors, that reduced the demand for black farm labor—are also the areas in which slavery’s long-term effects havemost attenuated. Furthermore, as evidence for intergenerational (cultural) transfer of attitudes, we show that there existsa strong correlation between the racial attitudes of parents andtheir children in the US South. Our evidence, therefore, supports the theory that political attitudes have persisted historically in the US South, rather than the view that attitudesare driven exclusively by contemporaneous forces—makingour position quite distinct from much of the existing publicopinion literature.The paper proceeds as follows. First, we motivate ourhypothesis that historical persistence—and not just contemporary factors—shape modern-day political attitudes.We discuss our data in the next section and present ourcore results linking the prevalence of slavery in 1860 andcontemporary attitudes in the following section, with additional robustness checks presented in the appendix, available online. We then consider and provide evidence againstseveral competing theories rooted in contemporary factors,including the theory of racial threat. In the following section,we provide evidence for our theory of the historical persistence of political attitudes, paying close attention to postbellum political and economic incentives as the driving mechanism. We conclude by discussing the broader implicationsof our research for scholarship in American political behavior.EXPLAINING REGIONAL DIFFERENCES INSOUTHERN POLITICAL AND RACIAL ATTITUDESWe orient our analysis toward the Southern “Black Belt”(or the “Cotton Belt”), the hook-shaped swath of land thatwas the primary locus of antebellum slavery (fig. 1). Scholarshave noted that Black Belt whites were particularly prominent in Southern politics and have been more conservativethan whites elsewhere in the South. As V. O. Key wrote, itis “the whites of the black belts who have the deepest andmost immediate concern about the maintenance of whitesupremacy,” and “if the politics of the South revolves aroundany single theme, it is that of the role of the black belts” (Key1949, 5–6). Furthermore, the Black Belt has had an enormousinfluence on national politics. Members of Congress fromthese areas held influential positions, effectively exercisingveto power during the development of the welfare state inthe 1920s and 1930s (Katznelson, Geiger, and Kryder 1993).Given these facts, our motivating question is this: Why arewhites who currently live in the Black Belt more conservative than whites living elsewhere in the South, particularlyon race-related issues? We consider two broad classes ofexplanations: (i) the historical persistence of attitudes originating in slavery and (ii) contemporary factors, includingcontemporary demographics and geographic mobility.Historical persistence of white political attitudesOur first hypothesis is that today’s Black Belt is more politically conservative than other parts of the South in partbecause of its history of chattel slavery. We are motivated inthis hypothesis by an emerging empirical literature showingthat the effects of coercive institutions persist in otherThis content downloaded from 128.103.149.052 on June 15, 2016 06:28:11 AMAll use subject to University of Chicago Press Terms and Conditions (http://www.journals.uchicago.edu/t-and-c).
Volume 78Number 3July 2016 / 623Figure 1. Estimated proportion slave in 1860 by countycontexts. Dell (2010), for example, shows that a colonialforced labor system in Peru and Bolivia led to lower levelsof modern-day household consumption and childhoodgrowth. Acemoglu et al. (2012) find that the use of slaves inthe colonial gold mines of Colombia predicts modern-daypoverty, reduced school enrollment, and decreased vaccination rates. Nunn and Wantchekon (2011) show that Africans whose ancestors were targeted by the slave tradehave higher levels of mistrust today than other Africans.Within the United States, O’Connell (2012) demonstratesthat areas of the American South that had high numbers ofslaves have greater economic inequality between blacks andwhites today. Similarly, Lagerlöf (2005) and Nunn (2008)find a negative relationship between the prevalence of slaveryand income in the American South, and Mitchener andMcLean (2003) find a negative relationship between slaveryand modern-day labor productivity. These papers are part ofa growing literature that shows that historical institutionssuch as slavery can affect both institutional and behavioraloutcomes long after the institutions themselves disappear(Nunn 2009). This work complements an existing literaturedocumenting the path dependence of historical institutionsover time (e.g., Pierson 2000).Building from this literature, we hypothesize that Southern slavery may have had a similarly lasting effect on politicaland racial attitudes. The rise and swift fall of chattel slaverytogether were cataclysmic events. Specifically, the eventual fallof slavery undermined the political and economic power ofthe Southern whites, particularly in the Black Belt (Du Bois1935; Foner 2011), making them more hostile toward AfricanAmericans and conservative in their political, racial, andeconomic views (noted contemporaneously by Key 1949).Qualitative accounts (as we document below) suggest thatthe nature of Southern whites’ responses to the collapse ofslavery varied according to how locally prevalent—and thuspolitically and economically important—slavery had been.Areas with more enslaved people reacted more sharply toemancipation by curtailing blacks’ rights and oppressing newlyfreedmen and their mobility.In addition, a large literature has shown that attitudescan persist historically through both cultural and institutionalchannels (Nunn and Wantchekon 2011; Voigtländer and Voth2012). On the one hand, Southern institutions such as JimCrow helped enforce racial segregation, while racially targetedviolence reinforced practices of black subjugation (Woodward[1955] 2002). On the other hand, the culture of the SouthernBlack Belt was one where black subjugation was passed onwithin white families and across generations—a process thatno doubt included intergenerational socialization (Bisin andVerdier 2000; Boyd and Richerson 1988; Campbell et al. 1980;Jennings and Niemi 1968).Based on these arguments, we expect that (i) areas thatwere more reliant on slavery should be more conservativetoday on race-related issues and in terms of party affiliation, (ii) race-related attitudes should be correlated acrossgenerations within the South, and (iii) the effects of slaveryThis content downloaded from 128.103.149.052 on June 15, 2016 06:28:11 AMAll use subject to University of Chicago Press Terms and Conditions (http://www.journals.uchicago.edu/t-and-c).
624 / The Political Legacy of American Slavery Avidit Acharya, Matthew Blackwell, and Maya Senshould be weaker (i.e., should have decayed more) in areaswhere the incentives for anti-black attitudes faded earlier.How contemporary demographics could explainregional variation in white political attitudesIn contrast to the arguments above, much of the politicalscience literature points to contemporary (not historical)forces as providing the explanation for why Black Belt whitesare more conservative on race. By and large, the literature hasinterpreted Key’s (1949) work as suggesting that whites contemporaneously become more conservative when they are exposed to the high concentrations of African Americans wholive in their communities.1 The high concentration of AfricanAmericans in today’s Black Belt could contemporaneouslythreaten white dominance, resulting in whites actively choosing more conservative political beliefs today. The literaturesupporting this idea, known as “racial threat,” is voluminous.2For example, Glaser (1994) finds evidence linking negativewhite attitudes toward civil rights or African American politicians with high concentrations of blacks. Giles and Buckner(1993) find a relationship between black concentrations andwhite support for racially conservative candidates such asDavid Duke (these findings are, however, challenged by Voss[1996]). This literature, however, has not considered thatslavery could be an independent predictor of contemporaryattitudes (apart from its effect on contemporary demographics), making it an omitted variable in studies of racial threatin the South.Other aspects of the contemporary local context may alsoaffect white attitudes—for example, income gaps betweenblacks and whites, urban-rural differences, and other contextual and individual-level factors (e.g., Hopkins 2010;Oliver and Mendelberg 2000).3 A final category of explanations concerns white mobility through the twentieth century.For example, it could be that more racially conservativewhites have migrated into former slaveholding areas, whileracial liberals have left, thereby creating a regional pattern in1. As we note below, Southern slavery is correlated with contemporaryblack concentration, making it difficult to disentangle the effects of slaveryfrom the effects of contemporary black concentrations.2. Early studies showed, e.g., that modern black concentrations predict white support for segregationist candidates such as George Wallace(e.g., Wright 1977), racially hostile white attitudes (Blalock 1967; Giles1977), negative attitudes on school desegregation (Ogburn and Grigg1956), and higher incidence of lynchings (Reed 1972).3. Some work has even highlighted the connection between slavery andthese contemporary factors (Mitchener and McLean 2003; Nunn 2008;O’Connell 2012). While these papers suggest that slavery might affect contemporary attitudes indirectly through contemporary factors such as economic inequality and prosperity, we find below that slavery has a direct effecton contemporary attitudes that does not work through these channels.political attitudes that is less about persistence of beliefs andmore about the sorting of beliefs.Ultimately much of the public opinion literature focuseson contemporary or individual-level factors in explainingpolitical beliefs rather than on historical forces. Yet Key himself was aware of the importance of history in the context ofslavery when he noted that, in the years leading to the CivilWar, “those with most at stake—the owners of large numbersof slaves—were to be found roughly in the same areas aspresent-day black belts” (Key 1949, 6). We now turn to exploring this historical link in terms of regional variation inSouthern whites’ attitudes.HISTORICAL SLAVE DATA AND CONTEMPORARYPUBLIC OPINION DATAOur main explanatory variable and proxy for slavery’sprevalence is the proportion of each county’s 1860 population that was enslaved, as measured by the 1860 US Census.Although counts of enslaved people were taken before 1860,we use measures from 1860 because they represent the lastrecord before chattel slavery was abolished in 1865. In addition, white planters were very mobile in the antebellumperiod, during which slaves (not land) were their main sourceof wealth; after emancipation, mobility decreased rapidly aswhite elites became increasingly oriented toward landowning(Wright 1986, 34). If any local legacy exists, we would expectto see it in data from 1860. Since county boundaries haveshifted since 1860, we use an area-weighting method to mapdata from the 1860 Census onto county boundaries in 2000,enabling us to estimate the proportion enslaved in 1860within modern-day counties.4 Figure 1 depicts the data. Overall, we have in our data approximately 4 million enslavedpeople, constituting 32% of the Southern population.Outcome variables measuring contemporary whitepolitical and racial attitudesWe analyze three county-level outcome measures, whichcome from the Cooperative Congressional Election Study(CCES), a large survey of American adults (Ansolabehere2010). We pool CCES data from the 2006, 2008, 2009, 2010,and 2011 surveys to create a combined data set of over4. Total population and total enslaved population in 1860 counties aredivided among the counties in 2000 so that the proportion of the 1860population from 1860-county i that is assigned to 2000-county j is basedon the size of their overlapping areas. This approach produces estimatesand results similar to those provided by (i) O’Connell (2012) (r p 0.986),who uses an alternative interpolation technique, and (ii) a simpler methodthat relies on matching counties by name. See appendix section A formore information on our approach.This content downloaded from 128.103.149.052 on June 15, 2016 06:28:11 AMAll use subject to University of Chicago Press Terms and Conditions (http://www.journals.uchicago.edu/t-and-c).
Volume 78157,000 respondents. We subset these data to the formerConfederate states plus Missouri and Kentucky, both ofwhich had significant internal support for the Confederacy,5and to self-identified whites, leaving us with more than40,000 respondents across 1,329 of the 1,435 Southern counties. In addition, we also investigate individual-level black-whitethermometer scores from waves of the American NationalElection Survey (ANES) from 1984 until 1998, a time periodin which the ANES both used a consistent sampling frameand included county-level identifiers for respondents. Afterrestricting the sample to Southern whites, we have an ANESsample of 3,123 individuals across 64 counties in the South.This makes the ANES more restricted in its geographic coverage, but it contains valuable direct questions on the subjective evaluation of racial groups.The four outcome measures are as follows.Partisanship. We examine partisanship, because, as manyscholars have argued, Southern whites’ partisanship (andpartisan re-alignment) has been intimately connected to, andreflective of, their attitudes on race and black-white relations(Carmines and Stimson 1989; Key 1949; Kuziemko and Washington 2015; Valentino and Sears 2005). Such partisan identification can not only reflect racial attitudes, as suggestedby these papers, but may also reflect beliefs on policy issuesclosely related to race, including redistribution (Gilens 2009;Lee and Roemer 2006). Partisanship also serves as an important bridge to regional and national politics.We construct our partisanship measure from a standardseven-point party identification question on the CCES. Weoperationalize the party variable as whether an individualidentified at all with the Democratic Party (1 if Democrat;0 otherwise).6 Thus, the county-level measure representsthe proportion of whites in each county who identified asDemocrats.Support for affirmative action. All CCES surveys ask respondents whether they support or oppose affirmative actionpolicies, which are described as “programs [that] give preference to racial minorities and to women in employment andcollege admissions in order to correct for discrimination”5. The sample thus includes Alabama, Arizona, Arkansas, Florida,Georgia, Kentucky, Louisiana, Mississippi, Missouri, North Caroline,South Carolina, Tennessee, Texas, Virginia, and West Virginia.6. We use survey data as opposed to voter registration data becauseprimaries in many Southern states are open. Coupled with the dramaticchanges in partisanship in the South over the last 40 years, this means voterregistration data are unreliable measures of current partisan leanings. Finally, survey data allow us to focus on the partisanship of whites voters only.Number 3July 2016 / 625(2008 CCES).7 We construct the outcome variable by collapsing the four-point scale, from “strongly support” to“strongly oppose,” to an indicator representing whether therespondent demonstrated any level of support for affirmative action (1 for support; 0 otherwise). At the county level,then, this is the proportion of whites who say that theysupport affirmative action.Racial resentment. Kinder and Sears (1981, 416) write thatracial resentment (or symbolic racism) “represents a form ofresistance to change in the racial status quo based on moralfeelings that blacks violate such traditional American valuesas individualism and self-reliance, the work ethic, obedience,and discipline.” We construct a third outcome variable using the two CCES questions on racial resentment. The firstquestion, asked in the 2010 and 2011 CCES surveys, asksrespondents on a five-point scale whether they agree withthe following statement: “The Irish, Italian, Jews and manyother minorities overcame prejudice and worked their wayup. Blacks should do the same.” The second question, askedin 2010, asks respondents, also on a five-point scale, whetherthey agree that “Generations of slavery and discriminationhave created conditions that make it difficult for Blacks towork their way out of the lower class.” For the 2010 CCES,when both questions were asked, we rescaled both questionsand averaged them to create one measure. The final countylevel measure is the average level of agreement with theracially resentment statement on a five-point scale.White-black thermometer difference. In many years, theANES contains “feeling thermometer” questions, which askrespondents to evaluate their feelings about politicians andgroups (including racial or ethnic groups) on a scale from 0to 100.8 Since these scales have engendered criticisms thatthe ratings fluctuate heavily from individual to individual(Wilcox, Sigelman, and Cook 1989) and that they are lessstable than party identification (Markus and Converse7. Although the question wording differs across years, we have noreason to believe that these wording variations affect our analysis.8. The 1984 ANES gave respondents the following instructions:I’ll read the name of a person and I’d like you to rate the personusing the feeling thermometer. Ratings between 50 degrees and100 degrees mean that you feel favorable and warm toward theperson. Ratings between 0 degrees and 50 degrees mean that youdon’t feel favorable toward the person and that you don’t care toomuch for that person. You would rate the person at the 50 degreemark if you don’t feel particularly warm or cold toward thatperson.For groups like “blacks” or “whites,” the instructions asked “And, stillusing the thermometer, how would you rate the following?”This content downloaded from 128.103.149.052 on June 15, 2016 06:28:11 AMAll use subject to University of Chicago Press Terms and Conditions (http://www.journals.uchicago.edu/t-and-c).
626 / The Political Legacy of American Slavery Avidit Acharya, Matthew Blackwell, and Maya Sen1979), we use them mainly to buttress the findings from ourprevious three outcome variables. To measure relative racialhostility, we take the difference between white respondents’feeling thermometer ratings toward whites and their feelingthermometer ratings toward blacks. Thus, a positive difference would indicate that respondents have warmer feelingstoward whites as opposed to blacks. Only using black thermometer scores yields similar results, but we use the difference in case slavery has an overall effect on racial groupthermometer ratings.Appendix tables A.1 and A.2 report summary statisticsfor these and other data. Figure 2 depicts the bivariate relationships between proportion slave in 1860 and the fouroutcome measures from the CCES and ANES. It shows negative, statistically significant relationships between slave prevalence and proportion Democrat and support for affirmativeaction and positive, statistically significant relationships withracial resentment and thermometer score differences. We nowturn to establishing plausible estimates of the causal effect ofslavery’s prevalence on these outcomes.SLAVERY’S EFFECTS ON CONTEMPORARYOUTCOMESIn models that analyze the CCES outcomes, we conduct acounty-level analysis using weighted least squares (WLS)with the within-county sample size (appropriately weightedby the sampling weights) as weights.9 We opt for analyses atthe county level for two reasons. First, the key variable ofinterest here (in effect, our treatment) is slavery in 1860,which is only measured at the county level, meaning wecannot detect any within-county variation in this measure.Second, when attempting to estimate the effect of a clusterlevel variable such as this, Green and Vavreck (2008) showthat aggregating units up to the cluster level provides themost accurate variance estimates. While it is sometimes useful to trade off this accuracy on standard error estimation toallow for the inclusion of individual-level covariates, in ourcontext many individual-level covariates are potentially directly affected by the treatment (slavery), so including themmay introduce posttreatment bias (Rosenbaum 1984). In spiteof this, we present respondent-level analyses in appendixtable A.3 that include additional respondent-level controlsand standard errors clustered at the county level. These results are consistent with our county-level results below, although we caution that the estimates may be biased. Fur9. Whites in high-black areas are less likely to be sampled than whitesin low-black areas, since the sampling reflects the population distributionof whites. If we were making inferences about both blacks and whites, thisapproach would be problematic. However, we use the white populationsubset to make inferences only about the Southern white population.thermore, we opt for an individual-level analysis for ourresults on NES thermometer scores since we are collectingtogether 15 years’ worth of survey results wherein racialattitudes have changed dramatically, making it important toinclude survey-year fixed effects in our models. The level ofanalysis has very little impact on the substantive results, andthe ANES results at the county level are presented in appendix table A.11.In table 1, we report the baseline estimates of slavery’seffect on the three CCES outcomes. Column 1 of table 1presents the simple WLS relationship between slavery andwhite partisan identification, which measures the relationship depicted in figure 2. In the remaining columns, we include state-level fixed effects to address the possibility thatstates adopted different policies that could have influencedslave shares in 1860 and could affect our outcome variablesin ways unrelated to slavery. In addition, in the remainingcolumns, we control for factors that may have been predictive of proportion slave in 1860. These “1860 covariates,”unless otherwise noted, come from the 1860 US Census andaddress possible differences between slaveholding and nonslaveholding counties. First, since wealthier or more populous counties may have had more or fewer slaves, we controlfor economic and demographic indicators from 1860. Theseinclude (i) the log of the total county population, (ii) theproportion of farms in the county smaller than 50 acres,(iii) the inequality of farmland holdings as measured by theG
and racial attitudes. The rise and swift fall of chattel slavery ntual fall of slavery undermined the political and economic power of the Southern whites, particularly in the Black Belt (Du Bois 1