Transcription
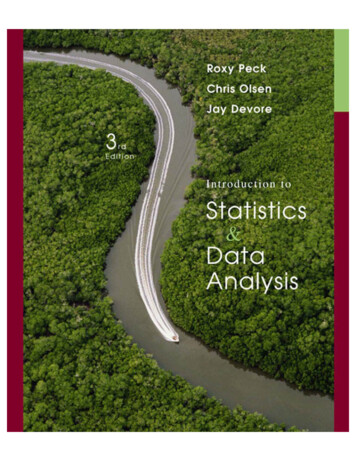
Introductionto Statisticsand Data Analysis
This page intentionally left blank
Introductionto Statisticsand Data AnalysisThird EditionRoxy PeckCalifornia Polytechnic State University, San Luis ObispoChris OlsenGeorge Washington High School, Cedar Rapids, IAJay DevoreCalifornia Polytechnic State University, San Luis ObispoAustralia Brazil Canada Mexico Singapore Spain United Kingdom United States
Introduction to Statistics and Data Analysis,Third EditionRoxy Peck, Chris Olsen, Jay DevoreAcquisitions Editor: Carolyn CrockettDevelopment Editor: Danielle DerbentiAssistant Editor: Beth GershmanEditorial Assistant: Ashley SummersTechnology Project Manager: Colin BlakeMarketing Manager: Joe RogoveMarketing Assistant: Jennifer LiangMarketing Communications Manager: Jessica PerryProject Manager, Editorial Production: Jennifer RisdenCreative Director: Rob HugelArt Director: Vernon BoesPrint Buyer: Karen HuntPermissions Editor: Isabel AlvesProduction Service: Newgen–AustinText Designer: Stuart PatersonPhoto Researcher: Gretchen MillerCopy Editor: Nancy DicksonIllustrator: Jade Myers; Newgen–IndiaCover Designer: Stuart PatersonCover Image: Paul Chesley/Getty ImagesCover Printer: Courier Corporation/KendallvilleCompositor: Newgen–IndiaPrinter: Courier Corporation/Kendallville 2008, 2005 Duxbury, an imprint of Thomson Brooks/Cole, apart of The Thomson Corporation. Thomson, the Star logo, andBrooks/Cole are trademarks used herein under license.Thomson Higher Education10 Davis DriveBelmont, CA 94002-3098USAALL RIGHTS RESERVED. No part of this work covered by thecopyright hereon may be reproduced or used in any form or byany means—graphic, electronic, or mechanical, including photocopying, recording, taping, Web distribution, information storageand retrieval systems, or in any other manner—without the written permission of the publisher.Printed in the United States of America1 2 3 4 5 6 7 11 10 09 08 07ExamView and ExamView Pro are registered trademarksof FSCreations, Inc. Windows is a registered trademark of theMicrosoft Corporation used herein under license. Macintosh andPower Macintosh are registered trademarks of Apple Computer,Inc. Used herein under license.Library of Congress Control Number: 2006933904Student Edition:ISBN-13: 978-0-495-11873-2ISBN-10: 0-495-11873-7For more information about our products, contact us at:Thomson Learning Academic Resource Center1-800-423-0563For permission to use material from this text or product, submit arequest online at http://www.thomsonrights.com.Any additional questions about permissions can be submitted bye-mail to thomsonrights@thomson.com.
To my nephews, Jesse and Luke Smidt, whobet I wouldn’t put their names in this book.R. P. To my wife, Sally, and mydaughter, AnnaC. O. To Carol, Allie, and Teri.J. D.
About the AuthorsROXY PECK is Associate Dean of theCollege of Science and Mathematicsand Professor of Statistics at CaliforniaPolytechnic State University, San LuisObispo. Roxy has been on the facultyat Cal Poly since 1979, serving for sixyears as Chair of the Statistics Department beforebecoming Associate Dean. She received an M.S. inMathematics and a Ph.D. in Applied Statistics fromthe University of California, Riverside. Roxy is nationally known in the area of statistics education,and in 2003 she received the American StatisticalAssociation’s Founder’s Award, recognizing her contributions to K–12 and undergraduate statistics education. She is a Fellow of the American StatisticalAssociation and an elected member of the International Statistics Institute. Roxy has recently completed five years as the Chief Reader for the Advanced Placement Statistics Exam and currentlychairs the American Statistical Association’s JointCommittee with the National Council of Teachers ofMathematics on Curriculum in Statistics and Probability for Grades K–12. In addition to her texts in introductory statistics, Roxy is also co-editor of Statistical Case Studies: A Collaboration Between Academeand Industry and a member of the editorial board forStatistics: A Guide to the Unknown, 4th edition. Outside the classroom and the office, Roxy likes to traveland spends her spare time reading mystery novels.She also collects Navajo rugs and heads to New Mexico whenever she can find the time.CHRIS OLSEN has taught statisticsat George Washington High School inCedar Rapids, Iowa, for over 25 years.Chris is a past member of the Advanced Placement Statistics Test Development Committee and the authorof the Teacher’s Guide for Advanced Placement Statistics. He has been a table leader at the AP Statisticsreading for 6 years and since the summer of 1996 hasbeen a consultant to the College Board. Chris leadsworkshops and institutes for AP Statistics teachersin the United States and internationally. Chris wasthe Iowa recipient of the Presidential Award for Excellence in Science and Mathematics Teaching in1986. He was a regional winner of the IBM Com-puter Teacher of the Year award in 1988 and receivedthe Siemens Award for Advanced Placement in mathematics in 1999. Chris is a frequent contributor tothe AP Statistics Electronic Discussion Group andhas reviewed materials for The Mathematics Teacher,the AP Central web site, The American Statistician,and the Journal of the American Statistical Association. He currently writes a column for Stats magazine. Chris graduated from Iowa State Universitywith a major in mathematics and, while acquiringgraduate degrees at the University of Iowa, concentrated on statistics, computer programming, psychometrics, and test development. Currently, he divideshis duties between teaching and evaluation; in addition to teaching, he is the assessment facilitator forthe Cedar Rapids, Iowa, Community Schools. In hisspare time he enjoys reading and hiking. He and hiswife have a daughter, Anna, who is a graduate student in Civil Engineering at Cal Tech.JAY DEVORE earned his undergraduate degree in Engineering Science from the University of Californiaat Berkeley, spent a year at the University of Sheffield in England, and finished his Ph.D. in statistics at StanfordUniversity. He previously taught at the University ofFlorida and at Oberlin College and has had visitingappointments at Stanford, Harvard, the Universityof Washington, and New York University. From 1998to 2006, Jay served as Chair of the Statistics Department at California Polytechnic State University, SanLuis Obispo. The Statistics Department at Cal Polyhas an international reputation for activities in statistics education. In addition to this book, Jay haswritten several widely used engineering statisticstexts and is currently working on a book in appliedmathematical statistics. He is the recipient of a distinguished teaching award from Cal Poly and is aFellow of the American Statistical Association. Inhis spare time, he enjoys reading, cooking and eatinggood food, tennis, and travel to faraway places. He isespecially proud of his wife, Carol, a retired elementary school teacher, his daughter Allison, who worksfor the Center for Women and Excellence in Boston,and his daughter Teri, who is finishing a graduateprogram in education at NYU.
Contents1 The Role of Statistics and the Data Analysis Process11.1 Three Reasons to Study Statistics 11.2 The Nature and Role of Variability 41.3 Statistics and the Data Analysis Process 71.4 Types of Data and Some Simple Graphical Displays 12Activity 1.1 Head Sizes: Understanding Variability 22Activity 1.2 Estimating Sizes 23Activity 1.3 A Meaningful Paragraph 242 Collecting Data Sensibly272.1 Statistical Studies: Observation and Experimentation 272.2 Sampling 322.3 Simple Comparative Experiments 422.4 More on Experimental Design 512.5 More on Observational Studies: Designing Surveys (Optional) 562.6 Interpreting and Communicating the Results ofStatistical Analyses 61Activity 2.1 Designing a Sampling Plan 63Activity 2.2 An Experiment to Test for the Stroop Effect 64Activity 2.3 McDonald’s and the Next 100 Billion Burgers 64Activity 2.4 Video Games and Pain Management 65Graphing Calculator Explorations 693 Graphical Methods for Describing Data753.1 Displaying Categorical Data: Comparative Bar Chartsand Pie Charts 763.2 Displaying Numerical Data: Stem-and-Leaf Displays 87vii
viii Contents3.3 Displaying Numerical Data: Frequency Distributionsand Histograms 973.4 Displaying Bivariate Numerical Data 1173.5 Interpreting and Communicating the Results ofStatistical Analyses 127Activity 3.1 Locating States 134Activity 3.2 Bean Counters! 134Graphing Calculator Explorations 1414 Numerical Methods for Describing Data1474.1 Describing the Center of a Data Set 1484.2 Describing Variability in a Data Set 1594.3 Summarizing a Data Set: Boxplots 1694.4 Interpreting Center and Variability: Chebyshev’s Rule,the Empirical Rule, and z Scores 1764.5 Interpreting and Communicating the Results ofStatistical Analyses 186Activity 4.1 Collecting and Summarizing Numerical Data 190Activity 4.2 Airline Passenger Weights 190Activity 4.3 Boxplot Shapes 190Graphing Calculator Explorations 1955 Summarizing Bivariate Data1995.1 Correlation 2005.2 Linear Regression: Fitting a Line to Bivariate Data 2105.3 Assessing the Fit of a Line 2215.4 Nonlinear Relationships and Transformations 2385.5 Logistic Regression (Optional) 2555.6 Interpreting and Communicating the Resultsof Statistical Analyses 264Activity 5.1 Exploring Correlation and Regression 267Activity 5.2 Age and Flexibility 268Graphing Calculator Explorations 2726 Probability2796.1 Chance Experiments and Events 2796.2 Definition of Probability 288
Contents ix6.3 Basic Properties of Probability 2956.4 Conditional Probability 3026.5 Independence 3136.6 Some General Probability Rules 3236.7 Estimating Probabilities Empirically Using Simulation 335Activity 6.1 Kisses 347Activity 6.2 A Crisis for European Sports Fans? 347Activity 6.3 The “Hot Hand” in Basketball 347Graphing Calculator Explorations 3517 Random Variables and Probability Distributions3577.1 Random Variables 3587.2 Probability Distributions for Discrete Random Variables 3617.3 Probability Distributions for Continuous Random Variables 3677.4 Mean and Standard Deviation of a Random Variable 3727.5 Binomial and Geometric Distributions 3867.6 Normal Distributions 3977.7 Checking for Normality and Normalizing Transformations 4147.8 Using the Normal Distribution to Approximate aDiscrete Distribution 425Activity 7.1 Rotten Eggs? 429Graphing Calculator Explorations 4348 Sampling Variability and Sampling Distributions4458.1 Statistics and Sampling Variability 4468.2 The Sampling Distribution of a Sample Mean 4508.3 The Sampling Distribution of a Sample Proportion 461Activity 8.1 Do Students Who Take the SATs Multiple Times Havean Advantage in College Admissions? 468Graphing Calculator Explorations 4719 Estimation Using a Single Sample4759.1 Point Estimation 4769.2 Large-Sample Confidence Interval for a Population Proportion 4829.3 Confidence Interval for a Population Mean 495
x Contents9.4 Interpreting and Communicating the Results ofStatistical Analyses 508Activity 9.1 Getting a Feel for Confidence Level 514Activity 9.2 An Alternative Confidence Interval for aPopulation Proportion 515Activity 9.3 Verifying Signatures on a Recall Petition 516Activity 9.4 A Meaningful Paragraph 516Graphing Calculator Explorations 52110 Hypothesis Testing Using a Single Sample52510.1 Hypotheses and Test Procedures 52610.2 Errors in Hypotheses Testing 53110.3 Large-Sample Hypothesis Tests for a Population Proportion 53710.4 Hypotheses Tests for a Population Mean 55010.5 Power and Probability of Type II Error 56210.6 Interpreting and Communicating the Results ofStatistical Analyses 571Activity 10.1 Comparing the t and z Distributions 574Activity 10.2 A Meaningful Paragraph 575Graphing Calculator Explorations 58011 Comparing Two Populations or Treatments58311.1 Inferences Concerning the Difference Between Two Populationor Treatment Means Using Independent Samples 58311.2 Inferences Concerning the Difference Between Two Populationor Treatment Means Using Paired Samples 60611.3 Large Sample Inferences Concerning a Difference Between TwoPopulation or Treatment Proportions 61911.4 Interpreting and Communicating the Results ofStatistical Analyses 629Activity 11.1 Helium-Filled Footballs 632Activity 11.2 Thinking About Data Collection 633Activity 11.3 A Meaningful Paragraph 633Graphing Calculator Explorations 641
Contents xi12 The Analysis of Categorical Data and Goodness-ofFit Tests 64712.1 Chi-Square Tests for Univariate Data 64712.2 Tests for Homogeneity and Independence in a Twoway Table 66012.3 Interpreting and Communicating the Results ofStatistical Analyses 677Activity 12.1 Pick a Number, Any Number . . . 680Activity 12.2 Color and Perceived Taste 680Graphing Calculator Explorations 68513 Simple Linear Regression and Correlation:Inferential Methods 68913.1 Simple Linear Regression Model 69013.2 Inferences About the Slope of the Population Regression Line 70213.3 Checking Model Adequacy 71313.4 Inferences Based on the Estimated Regression Line(Optional) 72513.5 Inferences About the Population Correlation Coefficient(Optional) 73413.6 Interpreting and Communicating the Results ofStatistical Analyses 737Activity 13.1 Are Tall Women from “Big” Families? 739Graphing Calculator Exploration 74614 Multiple Regression Analysis74914.1 Multiple Regression Models 75014.2 Fitting a Model and Assessing Its Utility 76314.3 Inferences Based on an Estimated Model 14-114.4 Other Issues in Multiple Regression 14-1314.5 Interpreting and Communicating the Results ofStatistical Analyses 14-26Activity 14.1 Exploring the Relationship Between Number ofPredictors and Sample Size 780Sections and/or chapter numbers in color can be found at www.thomsonedu.com/statistics/peck
xii Contents15 Analysis of Variance78315.1 Single-Factor ANOVA and the F Test 78415.2 Multiple Comparisons 80015.3 The F Test for a Randomized Block Experiment 15-115.4 Two-Factor ANOVA 15-915.5 Interpreting and Communicating the Results ofStatistical Analyses 15-22Activity 15.1 Exploring Single-Factor ANOVA 808Graphing Calculator Exploration 81116 Nonparametric (Distribution-Free) Statistical Methods16-116.1 Distribution-Free Procedures for Inferences About a DifferenceBetween Two Population or Treatment Means Using IndependentSamples (Optional) 16-116.2 Distribution-Free Procedures for Inferences About a DifferenceBetween Two Population or Treatment Means UsingPaired Samples 16-1016.3 Distribution-Free ANOVA 16-23Appendix A: Statistical Tables 813Appendix B: References 833Answers to Selected Odd-Numbered Exercises 835Index I-1Sections and/or chapter numbers in color can be found at www.thomsonedu.com/statistics/peck
PrefaceIn a nutshell, statistics is about understanding the role that variability plays in drawing conclusions based on data. Introduction to Statistics and Data Analysis, Third Edition develops this crucial understanding of variability through its focus on the dataanalysis process.An Organization That Reflects the Data Analysis ProcessStudents are introduced early to the idea that data analysis is a process that begins withcareful planning, followed by data collection, data description using graphical andnumerical summaries, data analysis, and finally interpretation of results. This processis described in detail in Chapter 1, and the ordering of topics in the first ten chaptersof the book mirrors this process: data collection, then data description, then statisticalinference.The logical order in the data analysis process can be pictured as shown in the following figure.Step 1:AcknowledgingVariability—CollectingData SensiblyStep 2:DescribingVariabilityin the Data—DescriptiveStatisticsStep 3:DrawingConclusionsin a Way ThatRecognizesVariability inthe DataUnlike many introductory texts, Introduction to Statistics and Data Analysis,Third Edition is organized in a manner consistent with the natural order of the dataanalysis process:xiii
xiv PrefaceStep 1:AcknowledgingVariability—Collecting DataSensiblyStep 2:DescribingVariabilityin the Data—DescriptiveStatisticsChapters 1–2Chapters 3–5Probability Supportsthe ConnectionChapters 6–7Step 3:DrawingConclusionsin a Way ThatRecognizesVariability inthe DataChapters 8–15The Importance of Context and Real DataStatistics is not about numbers; it is about data—numbers in context. It is the contextthat makes a problem meaningful and something worth considering. For example, exercises that ask students to compute the mean of 10 numbers or to construct a dotplotor boxplot of 20 numbers without context are arithmetic and graphing exercises. Theybecome statistics problems only when a context gives them meaning and allows for interpretation. While this makes for a text that may appear “wordy” when compared totraditional mathematics texts, it is a critical and necessary component of a modern statistics text.Examples and exercises with overly simple settings do not allow students to practice interpreting results in authentic situations or give students the experience necessary to be able to use statistical methods in real settings. We believe that the exercisesand examples are a particular strength of this text, and we invite you to compare theexamples and exercises with those in other introductory statistics texts.Many students are skeptical of the relevance and importance of statistics. Contrived problem situations and artificial data often reinforce this skepticism. A strategythat we have employed successfully to motivate students is to present examples andexercises that involve data extracted from journal articles, newspapers, and other published sources. Most examples and exercises in the book are of this nature; they covera very wide range of disciplines and subject areas. These include, but are not limitedto, health and fitness, consumer research, psychology and aging, environmental research, law and criminal justice, and entertainment.A Focus on Interpretation and CommunicationMost chapters include a section titled “Interpreting and Communicating the Results ofStatistical Analyses.” These sections include advice on how to best communicate theresults of a statistical analysis and also consider how to interpret statistical summaries
Preface xvfound in journals and other published sources. A subsection titled “A Word to theWise” reminds readers of things that must be considered in order to ensure that statistical methods are employed in reasonable and appropriate ways.Consistent with Recommendations for the Introductory Statistics Course Endorsedby the American Statistical AssociationIn 2005, the American Statistical Association endorsed the report “College Guidelinesin Assessment and Instruction for Statistics Education (GAISE Guidelines),” whichincluded the following six recommendations for the introductory statistics course:1.2.3.4.5.6.Emphasize statistical literacy and develop statistical thinking.Use real data.Stress conceptual understanding rather than mere knowledge of procedures.Foster active learning in the classroom.Use technology for developing conceptual understanding and analyzing data.Use assessments to improve and evaluate student learning.Introduction to Statistics and Data Analysis, Third Edition is consistent with these recommendations and supports the GAISE guidelines in the following ways:1. Emphasize statistical literacy and develop statistical thinking.Statistical literacy is promoted throughout the text in the many examples and exercises that are drawn from the popular press. In addition, a focus on the role of variability, consistent use of context, and an emphasis on interpreting and communicating results in context work together to help students develop skills in statisticalthinking.2. Use real data.The examples and exercises from Introduction to Statistics and Data Analysis,Third Edition are context driven and reference sources that include the popularpress as well as journal articles.3. Stress conceptual understanding rather than mere knowledge of procedures.Nearly all exercises in Introduction to Statistics and Data Analysis, Third Editionare multipart and ask students to go beyond just computation. They focus on interpretation and communication, not just in the chapter sections specifically devotedto this topic, but throughout the text. The examples and explanations are designedto promote conceptual understanding. Hands-on activities in each chapter are alsoconstructed to strengthen conceptual understanding. Which brings us to . . .4. Foster active learning in the classroom.While this recommendation speaks more to pedagogy and classroom practice, Introduction to Statistics and Data Analysis, Third Edition provides 33 hands-on activities in the text and additional activities in the accompanying instructor resourcesthat can be used in class or assigned to be completed outside of class. In addition,accompanying online materials allow students to assess their understanding and develop a personalized learning plan based on this assessment for each chapter.5. Use technology for developing conceptual understanding and analyzing data.The computer has brought incredible statistical power to the desktop of every investigator. The wide availability of statistical computer packages such as MINITAB,S-Plus, JMP, and SPSS, and the graphical capabilities of the modern microcomputer have transformed both the teaching and learning of statistics. To highlight therole of the computer in contemporary statistics, we have included sample output
xvi Prefacethroughout the book. In addition, numerous exercises contain data that can easilybe analyzed by computer, though our exposition firmly avoids a presupposition thatstudents have access to a particular statistical package. Technology manuals forspecific packages, such as MINITAB and SPSS, are available in the online materials that accompany this text.The appearance of hand-held calculators with significant statistical and graphing capability has also changed statistics instruction in classrooms where access tocomputers is still limited. The computer revolution of a previous generation is nowbeing writ small—or, possibly we should say, smaller—for the youngest generationof investigators. There is not, as we write, anything approaching universal or evenwide agreement about the proper role for the graphing calculator in college statistics classes, where access to a computer is more common. At the same time, fortens of thousands of students in Advanced Placement Statistics in our high schools,the graphing calculator is the only dependable access to statistical technology.This text allows the instructor to balance the use of computers and calculatorsin a manner consistent with his or her philosophy and presents the power of the calculator in a series of Graphing Calculator Explorations. These are placed at the endof each chapter, unobtrusive to those instructors whose technology preference isthe computer while still accessible to those instructors and students comfortablewith graphing calculator technology. As with computer packages, our expositionavoids assuming the use of a particular calculator and presents the calculator capabilities in a generic format; specifically, we do not teach particular keystroke sequences, believing that the best source for such specific information is the calculator manual. For those using a TI graphing calculator, there is a technology manualavailable in the online materials that accompany this text. As much as possible, thecalculator explorations are independent of each other, allowing instructors to pickand choose calculator topics that are more relevant to their particular courses.6. Use assessments to improve and evaluate student learning.Assessment materials in the form of a test bank, quizzes, and chapter exams areavailable in the instructor resources that accompany this text. The items in the testbank reflect the data-in-context philosophy of the text’s exercises and examples.Advanced Placement StatisticsWe have designed this book with a particular eye toward the syllabus of the AdvancedPlacement Statistics course and the needs of high school teachers and students. Concerns expressed and questions asked in teacher workshops and on the AP Statistics Electronic Discussion Group have strongly influenced our exposition of certain topics, especially in the area of experimental design and probability. We have taken great care toprovide precise definitions and clear examples of concepts that Advanced PlacementStatistics instructors have acknowledged as difficult for their students. We have also expanded the variety of examples and exercises, recognizing the diverse potential futuresenvisioned by very capable students who have not yet focused on a college major.Topic CoverageOur book can be used in courses as short as one quarter or as long as one year in duration. Particularly in shorter courses, an instructor will need to be selective in deciding which topics to include and which to set aside. The book divides naturally into fourmajor sections: collecting data and descriptive methods (Chapters 1–5), probabilitymaterial (Chapters 6–8), the basic one- and two-sample inferential techniques (Chapters 9–12), and more advanced inferential methodology (Chapters 13–16). We include
Preface xviian early chapter (Chapter 5) on descriptive methods for bivariate numerical data. Thisearly exposure raises questions and issues that should stimulate student interest in thesubject; it is also advantageous for those teaching courses in which time constraintspreclude covering advanced inferential material. However, this chapter can easily bepostponed until the basics of inference have been covered, and then combined withChapter 13 for a unified treatment of regression and correlation.With the possible exception of Chapter 5, Chapters 1–10 should be covered in order. We anticipate that most instructors will then continue with two-sample inference(Chapter 11) and methods for categorical data analysis (Chapter 12), although regression could be covered before either of these topics. Optional portions of Chapter 14(multiple regression) and chapter 15 (analysis of variance) and Chapter 16 (nonparametric methods) are included in the online materials that accompany this text.A Note on ProbabilityThe content of the probability chapters is consistent with the Advanced Placement Statistics course description. It includes both a traditional treatment of probability andprobability distributions at an introductory level, as well as a section on the use of simulation as a tool for estimating probabilities. For those who prefer a briefer and moreinformal treatment of probability, the book Statistics: The Exploration and Analysis ofData, by Roxy Peck and Jay Devore, may be a more appropriate choice. Except forthe treatment of probability and the omission of the Graphing Calculator Explorations,it parallels the material in this text. Please contact your sales rep for more informationabout this alternative and other alternative customized options available to you.New to This EditionThere are a number of changes in the Third Edition, including the following: More than 80 new examples and more than 180 new exercises that use datafrom current journals and newspapers are included. In addition, more of theexercises specifically ask students to write (for example, by requiring students toexplain their reasoning, interpret results, and comment on important features of ananalysis).Examples and exercises that make use of data sets that can be accessed online from the text website are designated by an icon in the text, as are examples that are further illustrated in the technology manuals (MINITAB, SPSS,etc.) that are available in the online materials that accompany this text.More than 90 exercises have video solutions, presented by Brian Kotz of Montgomery College, which can be viewed online or downloaded for viewing later.These exercises are designated by an icon in the text.A number of new hands-on activities have been added to the end-of-chapteractivities. These activities can be used as a chapter capstone or can be integratedat appropriate places as the chapter material is covered in class.Students can now go online to test their understanding of the material coveredin each chapter and develop a personalized learning plan to assist them in addressing any areas of weakness.A detailed description of the data analysis process now appears in Chapter 1.Although the order of topics in the text generally mirrors the data collectionprocess with methods of data collection covered first, two graphical displays (dotplots and bar charts) are covered in Chapter 1 so that these simple graphical analysis tools can be used in the conceptual development of experimental design and so
xviii Preface that students have some tools for summarizing the data they collect through sampling and experimentation in the exercises, examples, and activities of Chapter 2.A new optional section on logistic regression is now included in Chapter 5 forthose who would like more complete coverage of data analysis techniques for categorical data.Advanced topics that are often omitted in a one-quarter or one-semester course,such as inference and variable selection methods in multiple regression (Sections14.3 and 14.4) and analysis of variance for randomized block and two-factor designs (Sections 15.3 and 15.4), have been moved to the online materials thataccompany this text.Coverage of distribution-free procedures for inferences about the differencebetween two population or treatment means using independent samples (formerlySection 11.4) has been moved to Chapter 16. This chapter, titled “Nonparametric(Distribution-Free) Statistical Methods,” also includes new material on inferencesabout the difference between two population or treatment means using pairedsamp
College of Science and Mathematics and Professor of Statistics at California Polytechnic State University, San Luis Obispo. Roxy has been on the faculty at Cal Poly since 1979, serving for six years as Chair of the Statistics Department before becoming Associate Dean. She received an M

