Transcription
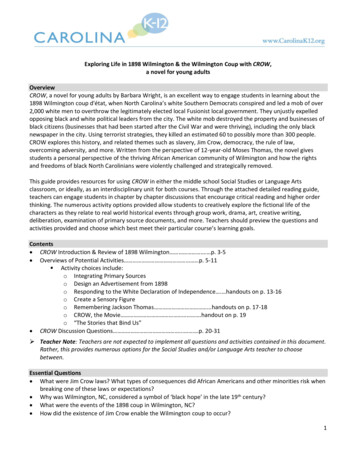
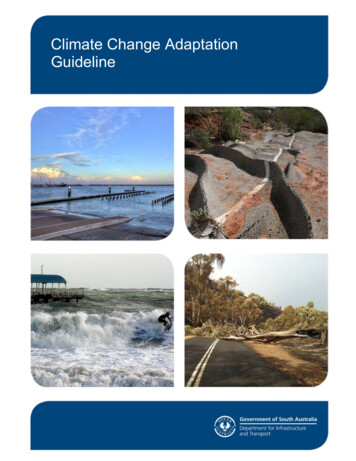
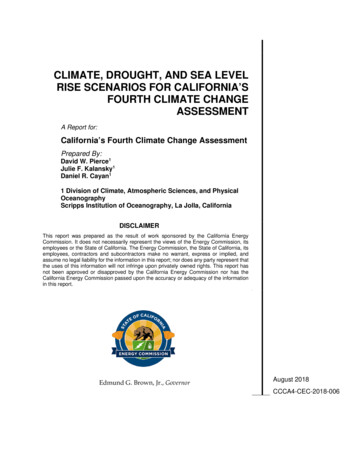
Climate Overview of Wilmington, NCNational WeatherServiceWilmington, NCweather.gov/ilmTemperaturesAll-time Heat Records104 on June 27, 1952103 on June 30, 2012103 on August 1, 1999Hottest Month (avg temp)National Weather Service84.7 in July 2012TEMP DATAHighest EverAverage HighAverage TempAverage LowLowest EverHottest Year (avg temp)Daily record highs66.5 in 1990Average highs/lowsAvg Number of Days per YearDaily record 071.755 80 : 0All-time Cold Records0 on December 25, 19895 on January 21, 19855 on February 14, 1899Coldest Month (avg temp)35.7 in January 1977Coldest Year (avg temp)61.0 in 1981Avg Number of Nights per Year 32 : 37 25 : 9 20 : 2Updated June 2021Wilmington has a humid subtropical climate with hot summers and cool winters. Summertime heatcan become excessive, especially when high humidity accompanies hot temperatures. During thespring and summer months, seabreezes originating from the ocean to the east and south bringcooler air onshore during most afternoons. The transition seasons of fall and spring often havepleasant temperatures and comfortable humidity. Freezing temperatures occur regularly betweenmid-November and mid-March, but severe or long-lasting cold is very rare. 90 : 45 100 : 1
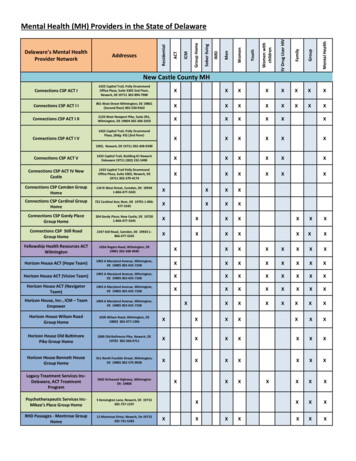
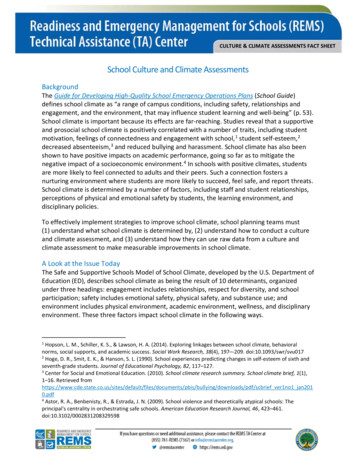
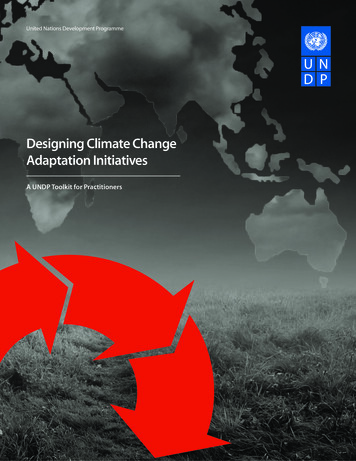
Climate Overview of Wilmington, NCNational WeatherServiceWilmington, NCweather.gov/ilmRainfallMonthly Average Rainfall Totals (inches)All-time Rainfall RecordsApplied Climate Information System23.02” Hurr. Florence (Sep 2018)22.54” Non-trop. low (Sep 2010)19.06”Hurr. Floyd (Sep 1999)13.79” Non-trop. low (Oct 2005)RAIN DATAHighest EverAverageLowest EverAvg # Days .01"0.01" daily prob.0.10" daily prob.0.50" daily prob.1.00" daily prob.Longest Wet Streak14 days Jul 22 to Aug 4, 2018(most recent of four occurrences)Wettest Day13.38” on Sept 15, 1999 7%7%4%928%17%7%3%1032%20%8%3%12233%22%10%5%Wettest Year102.40” in 2018Longest Dry Streak42 days Sept 4 to Oct 15, 1931Driest Month0.02” in October 1943Driest Year27.68” in 1909Updated June 2021Wilmington receives plentiful rainfall throughout the year. The wettest season is summer when locally heavythunderstorms occur many afternoons and evenings. Hurricanes occasionally bring flooding rain, especially duringlate summer or fall. The passage of low pressure systems once or twice a week brings most of our winter rainfall –typically a light and steady rain compared to other times of the year. The driest periods in Wilmington are spring andlate fall when high pressure covers the area.Wettest Month24.13” in September 2018
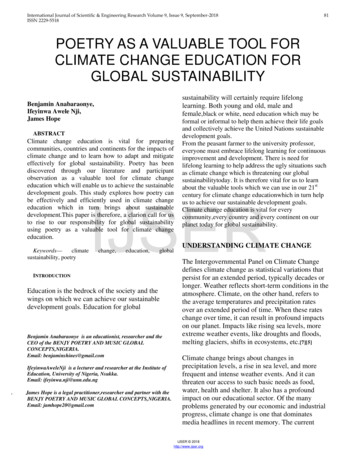
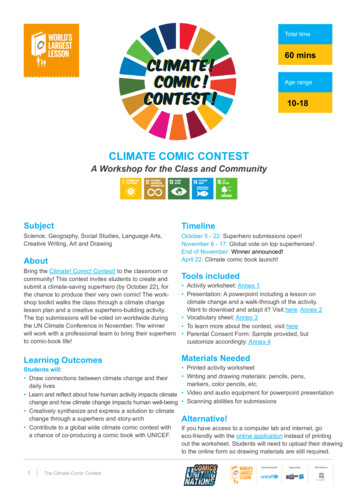
Climate Overview of Wilmington, NCNational WeatherServiceWilmington, NCweather.gov/ilmThunderstormsAverage Wilmington Thunderstorm FrequencyThunderstorm relative frequencyT-STORM DATAAvg. Days with ThunderJan1Feb1Green and yellow colors indicate more frequent thunderstorm c0ANNUAL51Severe Thunderstorm Risk by SeasonWinter (Dec – Feb)Spring (Mar – May)Summer (Jun – Aug)Fall (Sep – Nov)8 PM4 AMMidincreasingfrequencyof t-stormsStorm Prediction Center8 AMThunderstorms are most common in Wilmington from Maythrough September when heat and humidity are greatest.Most of these storms occur between 1 pm and 10 pm.Wilmington’s severe thunderstorm risk is highest during thespring and summer months, although landfalling tropicalcyclones can bring a risk of tornadoes during the fall.Updated June 2021Iowa Environmental Mesonet, Iowa State UniversityNoonStorm Prediction Center4 PM
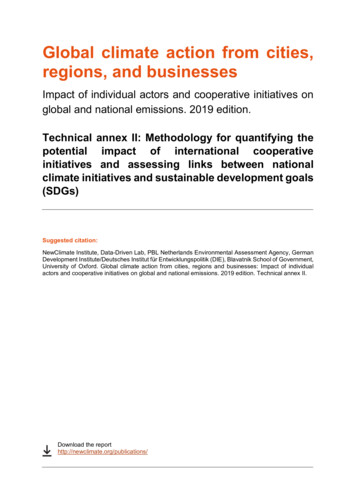
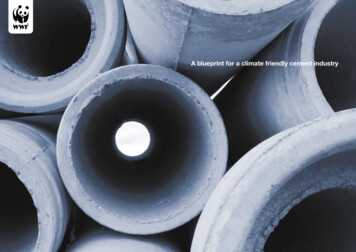
Climate Overview of Wilmington, NCNational WeatherServiceWilmington, NCweather.gov/ilmHurricanesFlorence23.02” Rain105 mph windFloyd19.06” Rain86 mph windVAVANCNCSCHurricaneMean Return PeriodCape Fear averages a hurricane with74 mph winds every six yearsNational Hurricane CenterSCMajor Hurricane MeanReturn PeriodCape Fear averages a hurricane with115 mph winds every 17 yearsFran5.09” Rain86 mph windEastern North Carolina, south Florida, and coastal Louisiana are among the most hurricaneprone regions of the United States, averaging a hurricane strike every five to seven years.Climatological Tropical Storm and Hurricane Development and Risk Zones by MonthNational Hurricane CenterJuneJulyAugustSeptemberMany tropical storms and hurricanes havebrought flooding, damaging winds, andeven tornadoes to Wilmington. Some ofthe most significant storms to strike thecity throughout recent history are:Hurricane FlorenceHurricane FloydHurricane FranHurricane DianaHurricane DonnaHurricane HeleneHurricane IoneHurricane ConnieHurricane HazelHurricane “Six”Sept 14, 2018Sept 16, 1999Sept 5, 1996Sept 3, 1984Sept 11, 1960Sept 27, 1958Sept 19, 1955Aug 11, 1955Oct 15, 1954Sept 9, 1881From 1871 to 2021, 73 tropical cycloneshave produced wind gusts of at least 39mph at the NWS (or US Weather Bureau)official station. Fourteen hurricanes havebrought 74 mph winds during that time.OctoberNovember
Climate Overview of Wilmington, NCNational WeatherServiceWilmington, NCweather.gov/ilmApplied Climate Information SystemSnow and WindLargest Snowstorms in WilmingtonDecember 22-24, 1989February 9-11, 1974February 17-18, 1896February 10-11, 1912January 13-15, 1912February 24-25, 1942December 20-21, 1915March 1-3, 1980January 30, 1936Jan8.3SWFeb8.4SWMar9.2SWApr9.3SWMay8.3SWSNOW DATAHighest Month/Annual TotalAverage Month/Annual TotalMonthly Chance of Measurable SnowMonthly Chance of Any Snow, incl. 2NJan8.6”0.7”27%43%Feb12.5”0.2”13%53%Dec ANNUAL7.47.8NSWNorth Carolina Climate OfficeWIND DATAAverage Speed (mph)Prevailing 5”6.6”6.5”Average monthly snowfall Dec ton’s Strongest Recorded Wind GustsHurricane HeleneHurricane FlorenceHurricane “Six”Hurricane HazelHurricane DonnaHurricane IoneSep 27, 1958Sep 14, 2018Sep 9, 1881Oct 15, 1954Sep 11, 1960Sep 19, 1955135 mph105 mph103 mph *98 mph97 mph92 mph* converted from fastest mile to 5-second gustWinter (Dec-Feb)Spring (Mar-May)Summer (Jun-Aug)Fall (Sep-Nov)
Climate Overview of Wilmington, NCNational WeatherServiceWilmington, NCweather.gov/ilmHumidity, Sky Cover, FogAverage relative humidity (percent)REL. HUMIDITY1:00 AM7:00 AM1:00 PM7:00 PMDaily Dec8183567572ANNUAL8585577474Wilmington’s proximity to the Atlantic Oceanprovides a humid climate. Relative humidityis typically lowest during the late winter andspring months, and highest during summer.Sky condition (average number of clear, partly cloudy, cloudy days per month)SKY CONDITIONClearPartly 1.87.111.1Dec10.17.013.8ANNUAL110.8104150.3Cloud Cover (%)61% of Psbl. Sunshine 56Daily Solar Energy* Spring and fall experience the most sunnydays in Wilmington. Cloudy days are mostcommon during winter, comprising almosthalf of all days in January.* kWh/m2/day, National Renewable Energy LaboratoryFog Days (average number of days per month visibility falls to 5 miles; ¼ mile)FOG & DENSE FOGJanFog (5 mi. vsby)15.8Dense Fog (¼ mi. vsby) 2.9Dec18.23.2ANNUAL180.726.1Almost half of all days experience somereduced visibility due to fog, usually duringthe early morning hours. However dense fog(visibility ¼ mile or less) occurs infrequently,most often during the cooler months.
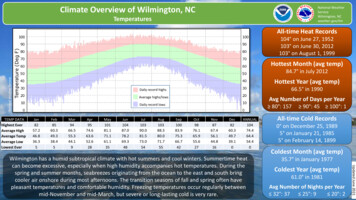
Climate Overview of Wilmington, NCNational WeatherServiceWilmington, NCweather.gov/ilmClimate Change and Sea Level RiseMore Numerous Heavy Rainfall EventsNC Institute for Climate StudiesAs humanity continues to burn fossil fuels for electricity andtransportation, the concentration of greenhouse gases inEarth’s atmosphere is rising. This traps more of the sun’sheat, leading to a warming global climate. Wilmington’slocal climate is already changing – temperatures are warmerand rainfall events are becoming heavier. More changes,including an increase in flooding from heavy rainfall andsubstantial sea level rise, are anticipated in the years ahead.Sea Level Will Rise, Causing More Frequent Coastal FloodingNC Institute for Climate StudiesNC Institute for Climate StudiesNC Institute for Climate StudiesIncreasing TemperaturesWilmington’s temperature has risen about 1 F over the past 100 years.Additional rises of 2-5 F are possible by 2050, with 2-10 F of totalincrease by the year 2100. Extreme heat should occur more often.Most long-range climatemodels show some potentialfor higher overall rainfallamounts. The number of dayswith heavy rainfall (3 inches)is expected to double from itshistoric averages.The Cape Fear River reached flood stage a record number of times in2019. By the year 2040 coastal flooding should occur on half the days inthe year, and by 2100 coastal flooding may occur virtually every day.Hurricanes will more easily create damaging storm surge flooding.
Climate Overview of Wilmington, NCNational WeatherServiceWilmington, NCweather.gov/ilmOther Environmental HazardsTsunamisWilmington’s tsunami risk is ‘very low.’ No EastCoast earthquake is likely to generate atsunami. Distant tsunamis could originate fromthe Puerto Rican trench, the Canary Islands, orthe Azores-Gibraltar fault zone, however nosuch events have occurred in recorded history.Non-geological events called meteo-tsunamisproduced by weather can produce up to 3 foothigh water level departures.Wilmington has no risk of volcanic eruptions.The closest active volcanoes are locatedapproximately 1,500 miles to the southeast onthe Caribbean islands of Montserrat andGuadeloupe.Updated June 2021Wilmington’s earthquake risk is near averagecompared to the rest of the country. The lastearthquake felt in Wilmington occurredAugust 23, 2011 and was centered innorthern Virginia. No damage occurredlocally. Strong earthquakes in 1886(Charleston, SC) and 1811 (New Madrid, MO)caused minor damage in Wilmington.VolcanoesU.S. National Parks ServiceUnited States Geological SurveyNatl Tsunami Hazard Mitigation ProgramEarthquakes
Coldest Month (avg temp) 35.7 in January 1977 Coldest Year (avg temp) 61.0 in 1981 Avg Number of Nights per Year 32 : 37 25 : 9 20 : 2 Wilmington has a humid subtropical climate with hot summers and cool winters. Summertime heat can become excessive, especially wh