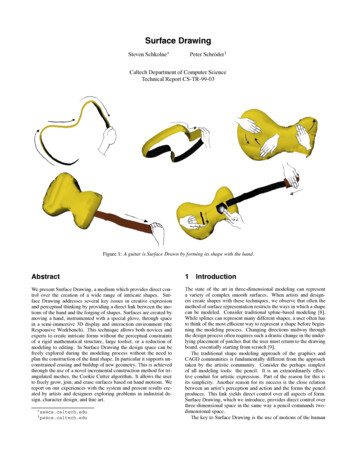
Transcription
Three-Dimensional Feature Diagrams VisualizationPablo Trinidad, Antonio Ruiz–Cortés, David Benavides, Sergio SeguraDpto. Lenguajes y Sistemas InformáticosUniversity of Seville{ptrinidad,aruiz,benavides,sergiosegura} at us.esAbstractVisualizing and manipulating large feature diagrams isstill an open issue for the SPL community. Few effort hasbeen made on improving the techniques to get the most outof drawing space and current feature modeling tools eitheruse file-system-like trees or 2D graphs that must be scrolledto locate features. The aim of this paper is presenting a newmethod to draw large feature models based on cone trees,a three-dimensional visualization technique to represent hierarchical information. In order to evaluate our proposal,we develop a prototype that generates standard 3D files soit can be easily integrated into existing tools. Finally, wepresent a roadmap for a future extension of our proposalwith dynamic behaviour so large feature models handlingmight be improved.1. MotivationAs software product lines (SPL) have become a reality insoftware development and tools are appearing to deal withthe different activities in SPL, the size of the systems impose a limitation of the amount of information that usersare able to manage at the same time. Last edition of ViSPLEworkshop [15] was held with the intention of finding solutions for complex SPL visualization. It remarks the community interest in finding solutions to problems such as theunderstanding of large SPL and variability representation.In the workshop conclusions report, it was emphasized theimportance of visualization techniques when the user wantsto look at a lot of informations at the same time and wasrecommended to find for solutions in the visualization theory and other applications of visualization techniques. Thatis the intention of this work, which is based on works in3D visualization such as [5, 10] that propose using threedimensional rooms to visualize information.We focus on feature diagrams in all their possible forms[14] are affected by the increasing size of SPL. Most ofexisting tools either use browser-like viewers to representfeature diagrams or traditional graph layout algorithms toprovide graphical interfaces for feature modeling. As anadvance towards finding better techniques for SPL visualization, Nestor et al.[12] propose some visualization techniques to improve some common tasks in SPL engineering. This paper intends to propose an alternative to existing works by introducing three-dimensional representationtechniques to the visualization techniques used to manipulate feature diagrams.Specifically, cone trees [6, 7, 13] are proposed as analternative to represent large hierarchies in the three–dimensional space. Cone trees distribute the elements oftree-like structures in a virtual 3D room where roots of subtrees are placed in the apex of cones that link them to theirchild nodes which are placed around their cone bases. Someexperiments have evaluated how they have improved sometasks when users work with large hierarchies, which is ourpremise to propose them to manipulate large feature models.In this paper our contribution is fourfold: i) we proposea roadmap to produce and evaluate the use of cone treesto represent feature diagrams in what we call feature conetrees (FCT); ii) We provide a detailed description of theprocess to obtain static FCT; iii) We propose using severaltechniques to incorporate dynamic behaviour into FCT toimprove the user experience; iv) A prototype to producestatic FCT is provided so a first evaluation of our proposalcan be given.This paper is structured as follows: Section 2 briefly describes cone trees and comments the benefits of using themcompared to traditional 2D layout algorithms; In Section3, we propose a process to produce FCT from feature diagrams, remarking how the original proposals on cone treesare adapted to fit into feature diagrams structure; Some details about a prototype implementation of our proposal thatintegrates into our FAMA tool[4] are given in Section 4;In Section 5, we discuss about the applicability our proposal based on previous evaluations of cone trees in othercontexts; Lastly, some conclusions and a roadmap for ourfuture work in feature diagrams visualization are given in
Section 6.2. Cone TreesRobertson et al.[13] proposed the visualization of hierarchical information in the three-dimensional space. Theroot of the hierarchy is placed at the ceiling of a virtual 3Droom and its children are evenly placed along the base of acone whose apex is the parent node. Next layers are drawnfollowing the same process, where child nodes will be considered the root of their subtrees.The interaction with a cone tree is eased by rotating allthe subcones whenever a node is selected. This way, selected and parent nodes are the nearest from the user viewpoint. Animations are introduced so the user is aware of therotation process and the perception of the whole structure isnever lost.The main goal of cone trees is an effective use of screenspace to visualize the whole structure. While 2D graph layout algorithms [11] are unable to fit large hierarchies on thescreen, cone trees are able to use depth to make a betteruse of space. When broad hierarchies are drawn using traditional 2D algorithms, the user must scroll to perceive thewhole structure and understanding the hierarchy topologyis a hard task. Cone trees prioritizes the understanding ofthe topology and emphasizes the information relevant to theuser bringing it to the front of the three-dimensional space.The benefits of using cone trees to represent large hierarchies have been considered for several case studies such asa organizational structure browser[13] or Unix file-systembrowsers[6]. For this last case, the authors present a smallexperiment to measure how cone trees improve some common tasks with file browsers. The goal of this paper is describing a process to transform feature diagrams into conetrees so it could improve some interacting tasks on largediagrams, such as they do in other contexts. Figure 1. Feature Cone Trees ResearchRoadmapIn the case of feature diagrams, features correspond to thenodes and relationships among features are the lines thatjoin parent and child features.Nodes will be drawn as semitransparent spheres thatcontain a representative name of the feature within. Eachparent-feature node is placed at the apex of a virtual cone.Child-feature nodes are placed around the base of the coneand are linked to the parent node by means of lines (seeFig. 3.1). Therefore, binary relationships are represented aslines that join two feature spheres. We remark that it is different from the original proposal of cone trees where parentand child nodes are joined by means of cones. We use linesinstead of cones because in some cases it is needed to represent information related to each relationship such as theircardinality in cardinality-based feature diagrams or emphasizing an erroneous relationship when a feature diagram isdebugged. Set relationships are a particular case and mustbe handled differently as we will discuss later.z ƌƉyα3. Feature Diagrams Visualization with ConeTreesWe aim to use cone trees to represent feature diagramsin order to give a solution to large feature diagrams visualization. Our first step towards this objective consists ofdefining the static layout of feature cone trees (FCT), thatwe describe in this paper. As a second step, we approachthe guidelines to deal with dynamic handling of cone treesthat will be a goal of our future research (Figure 1).3.1Building Feature Cone TreesCone trees depict hierarchical information by usingnodes and cones or lines that link parent and child nodes.ŚZθƌĐFigure 2. Feature Cone Tree RenderingIt is important to notice that cross-tree constraints andtextual constraints are out of the scope of this paper. Theybreak the tree-like structure and makes the feature diagrambecome a graph. An approach to deal with them when dy-
namic behaviour is introduced in Section 6.3.2Building the cones layoutOnce we have defined the elements of our cone trees,we cope with building them from feature diagrams. Conetrees are built bottom-up. In our particular case it meansthat they are recursively built from the leaves of the featurediagram to the root feature. Let us consider a parent feature (fp ) at any level of the tree and a set of child features(Fc {fc1 , · · · , fck }) each of them linked to the parent feature by means of a binary relationship (for the sake of simplicity, set relationships are ignored from the algorithm). fpis represented by a semitransparent sphere with radius rp .Analogously, child features in Fc are drawn in the base of acone and all of them have the same radii (rc ). In the figuresyou may find in this article, we have considered the spheresradius as a constant of the cone tree, so all the spheres sharethe same radius. However radii may be defined in terms ofthe level of the feature diagram where a feature is placed.For those child features that are not leaves of the featurediagram, they will also be parent features in their respective subtrees. In this case, sphere radius is not consider forbase calculus but the radius of the base of the virtual coneof their respective child features. This is the reason why thetrees are built bottom-up, because we need to know the radiiof the subcones for each child node to build an upper level.To define a cone, its height and base radius are used. Theheight of the virtual cone (h) is also a constant of the conetree. The radius of the cone base (R) is obtained by a formula that approximately estimates the perimeter of the baseby adding the diameter (twice the radii) of the child features(see Fig. 3).PPrci 2 · rci i iR 2ππNote that the result is not precise as we are really calculating the perimeter of the circumscribe polygon to the conebase which is less than the perimeter of the cone base. Ifwe used this imprecise radius, the spheres may overlap witha high number of child features so the radius must be increased. We correct this deviation adding the radius of thelargest rci to R as proposed in [6]:PrcR i i max rciiπOnce the cone proportions are obtained, each spheremust be placed around the base. We must calculate the angle (θi ) between two adjacent child features fi 1 and fiwhose radii are rci 1 and rci respectively. First child feature f1 is placed at zero-radians position. Remaining childfeatures are placed around the base calculating its θi angleby this formula (in e 3. Calculating angle between childnodes and the cone base radiusrci rci 1θi θi 1 RIt is also an approximate calculus, however its visual effect is unnoticed. Finally, we have to calculate the position of each sphere in the three dimensional space from theangles. Let us consider that the center of Fp sphere is at(0, 0, 0). We may set the position of each child feature bycalculating its spherical coordinates [8]. We only need thedistance between fp and fci sphere centers (l); the angleform the y-axis (α) and the angle from the z-axis (θi ). Cartesian coordinates can be easily calculated from these data incase you prefer them to calculate the position. Notice that land α are fixed parameters of the cone so they must not becalculated for all the child features.3.3Building the relationshipsOnce the spheres are placed at the tree, relationships between parent and child nodes must be drawn. As spheres aresemitransparent, visual cutter could arise in case we drewlines from the parent sphere center to the child sphere center. We do not want the lines to be within the spheres butgoing from the parent sphere surface to the child spheresurface. In Figure 4 a relationship is drawn with lengthl starting from a point (ox , oy ) in the surface of the parent sphere. Notice that two dimensions are used in the example to simplify the procedure and a third dimension canbe easily added. A line can be describe by its origin point(ox , oy ) and destination point (dx , dy ) which is also on the
child sphere surface. These parameters are calculated by thefollowing formulae:(ox , oy ) (rp sin α, rp cos α) (px , py )(dx , dy ) (cx , cy ) (rc sin α, rc cos α)where (cx , cy ) is the parent sphere center, (cx , cy ) is thechild sphere center and α angle is calculated as follows:α arctanRhIn case we want to use spherical coordinates (polar coordinates in the bi-dimensional space) origin and destinationpoints are defined in terms of an angle and a distance fromthe origin, which is the parent sphere center. The angle forboth points will be α; the distance for the origin point isequal to the radius of the parent sphere rp ; the distance forthe destination point is equal to rp l where l is the lengthof the line that can be easily calculated from the availableparameters:pl R2 h2 rc ͕ĚLJͿƌĐ;Đdž͕ĐLJͿFigure 4. Relationships renderingAnother factor to be taken into account are the set relationships, that link an unique parent feature to a set of childfeatures with a common cardinality. As the cardinality ofa set relationship must be drawn, if we used lines to linkchild features in a set relationship to their parent feature,and placed text in any of the lines, it will be impossible tofigure out the boundaries of the set relationship. As a solution to this problem, we propose creating an intermediatenode (sphere) containing the cardinality of the set relationship that links to the upper parent node and the lower childnodes. This way we avoid the misunderstanding a floatingcardinality could cause in a complex feature diagram.3.4Aesthetics AspectsFeature Diagrams mainly represent three kinds of information, namely: i) features, ii) which are the related features and iii) how they are linked (mandatory, optional, setrelationships, .). By now, we propose a method to represent the features (spheres) and how they are related (lines).Although we have already proposed a representation of setrelationships, we must also provide information regardingthe kind of relationship of binary relationships, mainly optional and mandatory ones.Carriere and Kazman [6] propose using colours, shapesor text to provide extra information to cone trees. In ourcase we are already using text within the spheres to represent the feature names. We have opted for using colours todistinguish between optional and mandatory relationships.However, instead of changing the colour of the line that represents the relationship, we change the colour of the sphereof the child feature that is affected by the relationship.Colour selection is critical, because the selected colourmust be easily discriminated and must induce to a fast association to the represented information, in our case, thekind of relationship. We have used red for the root and anymandatory feature; white for optional features; and yellowto fill a set-relationship cardinality sphere and white for itschild features. This is our first approach and testing othercolour palettes that could help on easily discriminating therelationships is an important issue on our future work. Evencolouring the relationship lines may be useful when it iswanted to remark information relevant such as an erroneousrelationship [16].We have proposed the usage of semitransparent sphereswhich is different from the original proposals on cone trees[6, 13]. It allows to place a text with the name of a featurewithin an sphere, instead of the side of the node, getting themost out of the drawing space. We use billboarding [2] todraw text in the three-dimensional space. It moves the texteverytime the camera or the tree rotates so it will be alwaysstaring at the users point of view.3.5Introducing Dynamic Behaviour intoFeature Cone TreesThe real benefit of using cone trees to represent largehierarchical structures comes when techniques to interactwith them are introduced to get the best user experience.Although the main goal of this paper is presenting a processto transform feature diagrams into cone trees, we want toremark some of the existing techniques to interact with conetrees.Visualizing the whole FCT gives a first understanding ofthe underlying topology of the feature diagram. For a complex or large hierarchy, users focus on the part of the FCT
that is relevant for their current work. While some information becomes relevant, others become irrelevant. Gardeningoperations such as pruning and growing the tree are proposed in the literature [13] to reduce the complexity andincrease the usability of large hierarchies. Carriere andKazman[6] propose using fish-eye viewing to display onlythose nodes whose degree of interest (DOI) is greater thana threshold. A node DOI is calculated from the positions inthe tree where the user focus is and that node. Filtering onlytakes into consideration the structure of the tree but ignoresany semantics within the model. For our purpose, we coulduse DOI to draw the cross–tree constraints, which have notbeen considered in this paper, just when the focus is on anode that is affected by one of them. This way, the visualcutter derived from drawing all the cross-tree constraints ina FCT may be reduced and could be drawn just on demand.FCTs are subject to change as the user may modify thefeature diagram and execute queries to filter the informationwithin the diagram[3]. Anytime a FCT changes, the layoutmust be rebuilt (transforming the new feature diagram intoanother FCT) or rearranged. To avoid the user loosing thescope of this changing operations, movement through thecone tree must be smooth enough. As an example, Mackinlay et al.[9] propose a technique to move a viewpoint to apoint of interest smoothly.4. ImplementationA prototype of the described mapping from feature diagrams to cone trees has been implemented and integratedinto our FAMA tool [4]. As we wanted the implementationto be easily reproduced and integrated into third-party tools,we opted for developing a prototype that used X3D [1] torepresent an FCT. X3D is an ISO open standard file formatto represent 3D scenes and objects. They can be reproducedby a set of tools which are frequently integrated into common web browsers. X3D is an XML-inpired format that isgenerated from FAMA with few effort.FCTs in Figures 5(a),6(a) and 8 represent three featurediagrams. They have different sizes so the effects of using FCT can be evaluated by the reader. Figure 5(a) represents a Home-Integration System(HIS) from [3]; Figure6(a) is a top view from SAUCE feature diagram [16] thatdescribes an ERP software product line; Figure 8 depictsa random feature model with 1000 features where we canappreciate its topology at first glance. These and more examples of the models obtained from FAMA can be found athttp://www.lsi.us.es/ trinidad/fct.5. DiscussionWe have presented a proposal to draw FCT as an alternative to traditional 2D feature diagrams representation. As(a) Feature Cone Tree vicescontrolR8R5Choose 1 R11R7light tionR9floodappliancescontrolR13plcvideo ondemandChoose1R12adslMandatory FeatureOptional ifi(b) Feature Diagram Classical RepresentationFigure 5. HIS feature diagram representationsan evaluation of our proposal depends on building a complete tool that also integrates dynamic behaviour, we relyon other studies where cone trees have been applied to othercontexts. In [6], an empirical study on cone trees performance tries to find their limitations. Although there aresome factors such as drawing speed, hardware accelerationand screen space and resolution that may affect the obtainedresults, they suggest that with cone trees containing morethan 1000 nodes or 10 layers, distant nodes cannot be identifiable as can be appreciated in Fig. 8. However, dynamicbehaviour techniques and gardening techniques considerably increase the limit to up to 5000. A small user test ispresented to show how cone trees helped users to find someinformation in a large file system faster than using traditional shell utilities.Although the results were very promising, Cockburn andMckenzie [7] show an sceptical point of view of this improvement due to the results of another case study. In thisstudy, cone trees are demonstrated to be faster for sometasks while traditional browsers performed better for othertasks. However, users were already familiar to traditionalbrowsers and the lack of training in using cone trees affected the experiment. These contradictorial results suggest
(a) Feature Cone Tree, no colouring (top view)SAUCEBasicSecurityData le(b) feature diagram classical representation (61 features collapsed)Figure 6. SAUCE ERP RepresentationsSurveyMapsserver50 features 11 featuresUserCartographyInfoPreferencesCrayfish
Figure 8. Top view of a 3D representation containing 1000 featuresus to adopt an eclectic position in the evaluation of the bestchoice. As cone trees may improve some tasks with largehierarchies, other tasks may be performed faster using traditional 2D representations.FCT seem to be an alternative to traditional 2D techniques as they are able to rearrange the structure to bring therelevant features nearer the focus using gardening and fisheye techniques when users work with large feature models. Existing feature diagram tools commonly deal withfile-system-like editors where scrollbars are used to navigate on a structure that needs several screens to be completely drawn. As an example, in our FAMA tool weneeded scrolling through 11 screens (Figure 7) to visualize the whole SAUCE feature diagram in Figure 6(b). Thissituation is similar to the one in the experiment presentedby Carrier and Kazman[6]. In their study, they validatecone trees against traditional file-system editors by proposing some unexperienced users performing some traditionalfile-system tasks using both systems. Therefore we expectobtaining similar results in our future work, where we willreplicate this experiment to obtain results specifically forFCTs but considering different feature diagram sizes.Figure 7. SAUCE feature diagram in FAMAtoolFCTs don’t intend to overcome 2D techniques but to propose an alternative to large feature diagrams. Traditional2D techniques can be the best choice for small feature diagrams such as the HIS in Figures 5(a) and 5(b). Furthermore, Robertson et al.[5] argue about the effectiveness ofcone trees for balanced hierarchies, where it is difficult todistinguish the subtrees by their topology. In these cases,2D techniques exploit the space in a better manner that FCT.However, handling large set relationships with many childfeatures is not trivial in 2D layouts. In these cases, FCTsreduce the needed space in Figure 6(b) as they surround the
parent node space an can be a better choice.6. Conclusions and Future WorkThis is the first step (Fig. 1) towards a full integrationof 3D interaction to feature modeling. Our intention is presenting an alternative in a field that we think that has notbeen sufficiently explored such as feature diagrams visualization. We want to highlight that our contribution bringsseveral solutions that have succeeded in other research areas to the software product lines context.This paper cannot be understood without taking into account any further work. As a final goal, we want to evaluatethe user interaction with FCT so we can compare currentfeature modeling tools visualization to our proposal. Toachieve it, we will develop a tool that extends our prototype with a dynamic behaviour, as already approached inthis paper. Techniques such as fish-eye view, different DOIformulae, colouring and rotations may increase the usability of FCT. However, they will not only improve its usability but also increase our tool functionality as we might incorporate cross-tree constraints to FCT. As they break thetree-like structure, some techniques should be developedto avoid constraint relationship lines crossing and passingnode spheres.We are aware that our proposal is by no means exhaustive while no evaluation is provided. In this paper we haveevaluated our proposal relying on previous case studies inother contexts. Whenever we finish our tool implementation, we want to evaluate our proposal by making a full userexperience study similar to those commented in this nts[14]This work has been partially supported by the European Commission (FEDER) and Spanish Government under CICYT project Web-Factories (TIN2006-00472) and bythe Andalusian Government under project ISABEL (TIC2533).[15]References[1] .org/x3d/specifications.[2] Computer Graphics: Principles and Practice, second edition. Addison-Wesley Professional, 1990.[3] D. Benavides, A. Ruiz-Cortés, and P. Trinidad. Automatedreasoning on feature models. LNCS, Advanced Information Systems Engineering: 17th International Conference,CAiSE 2005, 3520:491–503, 2005.[4] D. Benavides, S. Segura, P. Trinidad, and A. Ruiz-Corts.FAMA: Tooling a framework for the automated analysis offeature models. In Proceeding of the First International[16]Workshop on Variability Modelling of Software-intensiveSystems (VAMOS), pages 129–134, 2007.S. K. Card, G. G. Robertson, and J. D. Mackinlay. The information visualizer, an information workspace. In CHI ’91:Proceedings of the SIGCHI conference on Human factors incomputing systems, pages 181–186, New York, NY, USA,1991. ACM Press.J. Carriere and R. Kazman. Research report: Interactingwith huge hierarchies: beyond cone trees. infovis, 1995.A. Cockburn and B. Mckenzie. An evaluation of cone trees,2000.G. A. Korn and T. M. Korn. Mathematical Handbook forScientists and Engineers. McGraw- Hill, New York, 1968.J. D. Mackinlay, S. K. Card, and G. G. Robertson. Rapidcontrolled movement through a virtual 3d workspace. SIGGRAPH Comput. Graph., 24(4):171–176, August 1990.J. D. Mackinlay, G. G. Robertson, and S. K. Card. The perspective wall: detail and context smoothly integrated. InCHI ’91: Proceedings of the SIGCHI conference on Humanfactors in computing systems, pages 173–176, New York,NY, USA, 1991. ACM Press.E. B. Messinger, L. A. Rowe, and R. R. Henry. A divideand-conquer algorithm for the automatic layout of large directed graphs. Systems, Man and Cybernetics, IEEE Transactions on, 21(1), 1991.D. Nestor, L. O’Malley, P. Healy, A. Quigley, and S. Thiel.Visualisation techniques to support derivation tasks in software product line development. In CASCON ’07: Proceedings of the 2007 conference of the center for advanced studies on Collaborative research, pages 315–325, New York,NY, USA, 2007. ACM.G. G. Robertson, J. D. Mackinlay, and S. K. Card. Conetrees: animated 3d visualizations of hierarchical information. In CHI ’91: Proceedings of the SIGCHI conference onHuman factors in computing systems, pages 189–194, NewYork, NY, USA, 1991. ACM.P.-Y. Schobbens, P. Heymans, J.-C. Trigaux, and Y. Bontemps. Generic semantics of feature diagrams. ComputerNetworks, 51(2):456–479, February 2007.S. Thiel, P. Healy, A. Quigley, D. Nestor, and L. O’Malley,editors. 1st International Workshop on Visualization in Software Product Line Engineering (ViSPLE 2007), 2007.P. Trinidad, D. Benavides, A. Durán, A. Ruiz-Cortés, andM. Toro. Automated error analysis for the agilization of feature modeling. Journal of Systems and Software, 81(6):883–896, 2008.
Three-Dimensional Feature Diagrams Visualization . Few effort has been made on improving the techniques to get the most out of drawing space and current feature modeling tools either use file-system-like trees or 2D graphs that must be scrolled to l