Transcription
Fogler Web Ch18.fm Page 1 Monday, October 9, 2017 1:58 PMModels for NonidealReactors18Success is a journey, not a destination.—Ben SweetlandUse the RTD toevaluateparameters.Overview. Not all tank reactors are perfectly mixed nor do all tubular reactors exhibit plug-flow behavior. In these situations, some means must beused to allow for deviations from ideal behavior. Chapter 17 showed howthe RTD was sufficient if the reaction was first order or if the fluid waseither in a state of complete segregation or maximum mixedness. We usethe segregation and maximum mixedness models to bound the conversionwhen no adjustable parameters are used. For non-first-order reactions in afluid with good micromixing, more than just the RTD is needed. These situations compose a number of reactor analysis problems and cannot beignored. For example, we may have an existing reactor in storage and wantto carry out a new reaction in that reactor. To predict conversions and product distributions for such systems, a model of reactor flow patterns and/orRTD is necessary.After completing this chapter you will be able to Discuss guidelines for developing one- and two-parameter models(Section 18.1). Use the tanks-in-series (T-I-S) one-parameter model to predictconversion (Section 18.2). Use the dispersion one-parameter model to predict conversion(Section 18.3). Use the RTD to evaluate the model parameters (e.g., Da, n) forone-parameter models. Develop equations to model flow, dispersion, and reaction (Section18.4).18-1
Fogler Web Ch18.fm Page 2 Monday, October 9, 2017 1:58 PM18-2Models for Nonideal ReactorsChapter 18 Discuss dispersion and reaction in tubular reactors (Section 18.6). Suggest combinations of ideal reactors to model the nonideal reactor to predict conversion (Section 18.7). Use RTD data to evaluate the model parameters (e.g., , ) fortwo-parameter models (Section 18.8).Using the above models, we will first measure the RTD to characterize thereactor at the new operating conditions of temperature and flow rate. Afterselecting a model for the reactor, we use the RTD to evaluate the parameter(s) in the model after which we calculate the conversion.18.1 Some Guidelines for Developing ModelsThe overall goal is to use the following equationRTD Data Model Kinetics PredictionConflicting goalsA Model must Fit the data Be able toextrapolatetheory andexperiment Have realisticparametersThe choice of the particular model to be used depends largely on the engineering judgment of the person carrying out the analysis. It is this person’s job tochoose the model that best combines the conflicting goals of mathematicalsimplicity and physical realism. There is a certain amount of art in the development of a model for a particular reactor, and the examples presented here canonly point toward a direction that an engineer’s thinking might follow.For a given real reactor, it is not uncommon to use all the models discussed previously to predict conversion and then make comparisons. Usually,the real conversion will be bounded by the model calculations.The following guidelines are suggested when developing models for nonideal reactors:1. The model must be mathematically tractable. The equations used to describea chemical reactor should be able to be solved without an inordinateexpenditure of human or computer time.2. The model must realistically describe the characteristics of the nonideal reactor.The phenomena occurring in the nonideal reactor must be reasonably described physically, chemically, and mathematically.3. The model should not have more than two adjustable parameters. This constraint is often used because an expression with more than twoadjustable parameters can be fitted to a great variety of experimentaldata, and the modeling process in this circumstance is nothing morethan an exercise in curve fitting. The statement “Give me four adjustable parameters and I can fit an elephant; give me five and I caninclude his tail!” is one that I have heard from many colleagues.Unless one is into modern art, a substantially larger number of adjustable parameters is necessary to draw a reasonable-looking elephant.1A one-parameter model is, of course, superior to a two-parametermodel if the one-parameter model is sufficiently realistic. To be fair,however, in complex systems (e.g., internal diffusion and conduction,1J. Wei, CHEMTECH, 5, 128 (1975).
Fogler Web Ch18.fm Page 3 Monday, October 9, 2017 1:58 PMSection 18.1Some Guidelines for Developing Models18-3mass transfer limitations) where other parameters may be measuredindependently, then more than two parameters are quite acceptable.Table 18-1 gives some guidelines that will help your analysis and model building of nonideal reaction systems.A PROCEDURE FOR CHOOSING A MODELPREDICT THE OUTLET CONCENTRATION AND CONVERSIONTABLE 18-1TO1. Look at the reactor.a.Where are the inlet and outlet streams to and from the reactors? (Isby-passing a possibility?)b.Look at the mixing system. How many impellers are there? (Could there bemultiple mixing zones in the reactor?)c.Look at the configuration. (Is internal recirculation possible? Is the packingof the catalyst particles loose so channeling could occur?)2. Look at the tracer data.a.Plot the E(t) and F(t) curves.b.Plot and analyze the shapes of the E(Θ) and F(Θ) curves. Is the shape of thecurve such that the curve or parts of the curve can be fit by an ideal reactormodel? Does the curve have a long tail suggesting a stagnant zone? Does thecurve have an early spike indicating bypassing?c.Calculate the mean residence time, tm, and variance, σ 2 . How does the tmdetermined from the RTD data compare with τ as measured with a yardstickand flow meter? How large is the variance; is it larger or smaller than τ 2 ?3. Choose a model or perhaps two or three models.4. Use the tracer data to determine the model parameters (e.g., n, Da, υb).5. Use the CRE algorithm in Chapter 5. Calculate the exit concentrations and conversionfor the model system you have selected.The GuidelinesWhen using the algorithm in Table 18-1, we classify a model as being either aone-parameter model (e.g., tanks-in-series model or dispersion model) or atwo-parameter model (e.g., reactor with bypassing and dead volume). In Sections 18.1.1 and 18.1.2, we give an overview of these models, which will be discussed in greater detail later in the chapter.18.1.1 One-Parameter ModelsHere, we use a single parameter to account for the nonideality of our reactor.This parameter is most always evaluated by analyzing the RTD determinedfrom a tracer test. Examples of one-parameter models for nonideal CSTRsinclude either a reactor dead volume, VD, where no reaction takes place, or volumetric flow rate with part of the fluid bypassing the reactor, υb, thereby exiting unreacted. Examples of one-parameter models for tubular reactors includethe tanks-in-series model and the dispersion model. For the tanks-in-seriesmodel, the one parameter is the number of tanks, n, and for the dispersionmodel, the one parameter is the dispersion coefficient, Da.† Knowing theparameter values, we then proceed to determine the conversion and/or effluentconcentrations for the reactor.†Nomenclature note: Da1 (or Da2) is the Damköhler number and Da is the dispersioncoefficient.
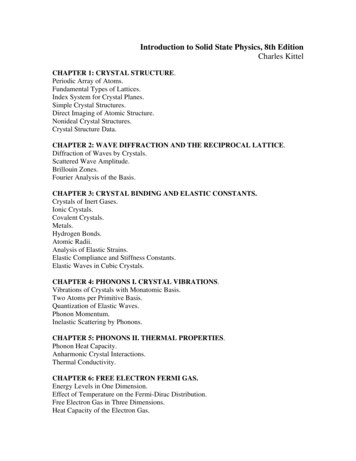
Fogler Web Ch18.fm Page 4 Monday, October 9, 2017 1:58 PM18-4Models for Nonideal ReactorsNonideal tubularreactorsChapter 18We first consider nonideal tubular reactors. Tubular reactors may beempty, or they may be packed with some material that acts as a catalyst,heat-transfer medium, or means of promoting interphase contact. Until Chapters 16–18, it usually has been assumed that the fluid moves through the reactor in a piston-like flow (i.e., plug flow reactor), and every atom spends anidentical length of time in the reaction environment. Here, the velocity profile isflat, and there is no axial mixing. Both of these assumptions are false to someextent in every tubular reactor; frequently, they are sufficiently false to warrantsome modification. Most popular tubular reactor models need to have themeans to allow for failure of the plug-flow model and insignificant axial mixingassumptions; examples include the unpacked laminar-flow tubular reactor, theunpacked turbulent flow reactor, and packed-bed reactors. One of twoapproaches is usually taken to compensate for failure of either or both of theideal assumptions. One approach involves modeling the nonideal tubular reactor as a series of identically sized CSTRs. The other approach (the dispersionmodel) involves a modification of the ideal reactor by imposing axial dispersion on plug flow.18.1.2 Two-Parameter ModelsThe premise for the two-parameter model is that we can use a combination ofideal reactors to model the real reactor. For example, consider a packed bedreactor with channeling. Here, the response to a pulse tracer input would showtwo dispersed pulses in the output as shown in Figure 16-1 and Figure 18-1.vChannelingvC(t)vS(a)Figure 18-1vtz Lz 0Dead zonesVSVD(b)(c)(a) Real system; (b) outlet for a pulse input; (c) model system.Here, we could model the real reactor as two ideal PBRs in parallel, with thetwo parameters being the volumetric flow rate that channels or by passes, υb ,and the reactor dead volume, VD. The real reactor volume is V VD VS withentering volumetric flow rate υ0 υb υS.18.2 The Tanks-in-Series (T-I-S) One-ParameterModeln ?In this section we discuss the use of the tanks-in-series (T-I-S) model todescribe nonideal reactors and calculate conversion. The T-I-S model is aone-parameter model. We will analyze the RTD to determine the number ofideal tanks, n, in series that will give approximately the same RTD as the nonideal reactor. Next, we will apply the reaction engineering algorithm developedin Chapters 1 through 5 to calculate conversion. We are first going to developthe RTD equation for three tanks in series (Figure 18-2) and then generalize to
Fogler Web Ch18.fm Page 5 Monday, October 9, 2017 1:58 PMSection 18.218-5The Tanks-in-Series (T-I-S) One-Parameter Modeln reactors in series to derive an equation that gives the number of tanks inseries that best fits the RTD data.18.2.1 Developing the E-Curve for the T-I-S ModelThe RTD will be analyzed from a tracer pulse injected into the first reactor ofthree equally sized CSTRs in series.Pulse1Pulse23(a)Figure 18-2(b)Tanks in series: (a) real system; (b) model system.Using the definition of the RTD presented in Section 16.2, the fraction of material leaving the system of three reactors (i.e., leaving the third reactor) that hasbeen in the system between time t and t t isC3 ( t )υC3 ( t ) t- --------------------------- tE (t ) t --------------------- N0C3 ( t ) dtIn Figure 2-9, wesaw how tanks inseries could approximate a PFR. 0ThenC3 ( t )E (t ) -------------------------- (18-1)C3 ( t ) dt0In this expression, C3 (t ) is the concentration of tracer in the effluent from thethird reactor and the other terms are as defined previously.By carrying out mass balances on the tracer sequentially for reactors 1, 2,and 3, it is shown on the CRE Web site in the Expanded Material for Chapter 18that the exit tracer concentration for reactor 3 isC0 t 2 tC3 --------e2τi2τi(18-2)Substituting Equation (18-2) into Equation (18-1), we find that22 t/τiC0t /( 2τi )eC3 ( t )E (t ) --------------------- --------------------------------- 2 t/τi C0 t eC3( t )dt------------------- dt2002τi t2 t -------3- e2τi τi(18-3)
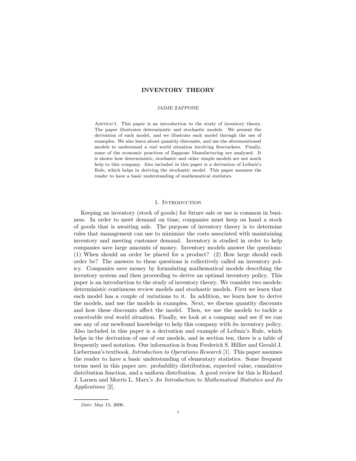
Fogler Web Ch18.fm Page 6 Monday, October 9, 2017 1:58 PM18-6Models for Nonideal ReactorsChapter 18Generalizing this method to a series of n CSTRs gives the RTD for nCSTRs in series, E (t ): tt n 1E ( t ) -----------------------n e( n 1 )!τiRTD for equal-sizetanks in seriesτi(18-4)Equation (18-4) will be a bit more useful if we put in the dimensionless form interms of E( ). Because the total reactor volume is nVi , then τi τ / n, where τrepresents the total reactor volume divided by the flow rate, υ , we haven ( n )n 1E ( ) τE(t) ----------------------- e n( n 1 )!(18-5)where t / τ Number of reactor volumes of fluid that have passed throughthe reactor after time t.Here, (E( ) d ) is the fraction of material existing between dimensionlesstime and time ( d ).Figure 18-3 illustrates the RTDs of various numbers of CSTRs in series ina two-dimensional plot (a) and in a three-dimensional plot (b). As the numberbecomes very large, the behavior of the system approaches that of a plug-flowreactor.n 1.41.2En 1011.5n 40.8 n 20.610.4150.20n10010.55032(a)Figure 18-31234(b)Tanks-in-series response to a pulse tracer input for different numbers of tanks.We can determine the number of tanks in series by calculating thedimensionless variance 2 from a tracer experiment.22 -----2 τ ( 1)2 E ( ) d 2E()d 202 0 0(18-6)02 E()d 1E( ) d E( ) d(18-7)0(18-8)
Fogler Web Ch18.fm Page 7 Monday, October 9, 2017 1:58 PMSection 18.218-7The Tanks-in-Series (T-I-S) One-Parameter Model 022n ( n )n 1 n----------------------- ed 1( n 1 )!nn -----------------( n 1 )! n 1 e nd 1(18-9)0nn( n 1 )!- 1 ------------------ ----------------( n 1 )! nn 2As the number oftanks increases, thevariance decreases.21 --n(18-10)The number of tanks in series isτ21n ------2- -----2(18-11)This expression represents the number of tanks necessary to model the realreactor as n ideal tanks in series. If the number of reactors, n, turns out to besmall, the reactor characteristics turn out to be those of a single CSTR orperhaps two CSTRs in series. At the other extreme, when n turns out to belarge, we recall from Chapter 2 that the reactor characteristics approachthose of a PFR.18.2.2 Calculating Conversion for the T-I-S ModelIf the reaction is first order, we can use Equation (5-15) to calculate theconversion1X 1 -----------------------n( 1 τi k )(5-15)whereVτi --------υ0 nIt is acceptable (and usual) for the value of n calculated from Equation (18-11)to be a noninteger in Equation (5-15) to calculate the conversion. For reactionsother than first order, an integer number of reactors must be used and sequential mole balances on each reactor must be carried out. If, for example,n 2.53, then one could calculate the conversion for two tanks and also forthree tanks to bound the conversion. The conversion and effluent concentrations would be solved sequentially using the algorithm developed in Chapter5; that is, after solving for the effluent from the first tank, it would be used asthe input to the second tank and so on as shown on the CRE Web site forChapter 18 Expanded Materials.
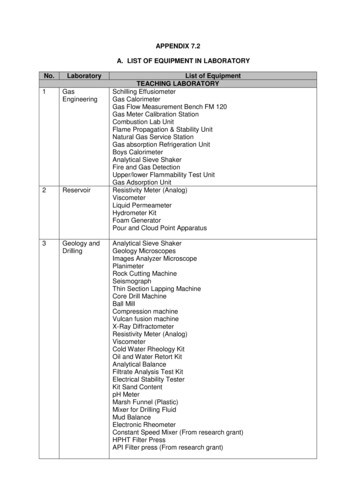
Fogler Web Ch18.fm Page 8 Monday, October 9, 2017 1:58 PM18-8Models for Nonideal ReactorsChapter 1818.2.3 Tanks-in-Series versus Segregation for a First-Order ReactionWe have already stated that the segregation and maximum mixedness modelsare equivalent for a first-order reaction. The proof of this statement was left asan exercise in Problem P17-3B. We can extend this equivalency for a first-orderreaction to the tanks-in-series (T-I-S) model(18-12)XT-I-S Xseg XmmThe proof of Equation (18-12) is given in the Expanded Materials on theCRE Web site for Chapter 18 (http://www.umich.edu/ elements/5e/18chap/expandedch18 example1.pdf).18.3 Dispersion One-Parameter ModelThe dispersion model is also often used to describe nonideal tubular reactors.In this model, there is an axial dispersion of the material, which is governed byan analogy to Fick’s law of diffusion, superimposed on the flow as shown inFigure 18-4. So in addition to transport by bulk flow, UAcC, every componentin the mixture is transported through any cross section of the reactor at a rateequal to [–DaAc(dC/dz)] resulting from molecular and convective diffusion. Byconvective diffusion (i.e., dispersion), we mean either Aris-Taylor dispersion inlaminar-flow reactors or turbulent diffusion resulting from turbulent eddies.Radial concentration profiles for plug flow (a) and a representative axial andradial profile for dispersive flow (b) are shown in Figure 18-4. Some moleculeswill diffuse forward ahead of the molar average velocity, while others will lagbehind.Plug FlowDispersion(a)(b)Tracer pulse withdispersionFigure 18-4Concentration profiles: (a) without and (b) with dispersion.To illustrate how dispersion affects the concentration profile in a tubularreactor, we consider the injection of a perfect tracer pulse. Figure 18-5 showshow dispersion causes the pulse to broaden as it moves down the reactor andbecomes less concentrated.Recall Equation (14-14). The molar flow rate of tracer (FT ) by both convection and dispersion isCFT Da -------T- UCT Acz(14-14)In this expression, Da is the effective dispersion coefficient (m2/s) and U (m/s)is the superficial velocity. To better understand how the pulse broadens, werefer to the concentration peaks t2 and t3 in Figure 18-6. We see that there is aconcentration gradient on both sides of the peak causing molecules to diffuse
Fogler Web Ch18.fm Page 9 Monday, October 9, 2017 1:58 PMSection 18.318-9Dispersion One-Parameter ModelTracer pulse withdispersiont1t2t3t4t5MeasurementpointFigure 18-5 Dispersion in a tubular reactor. (Levenspiel, O., Chemical ReactionEngineering, 2nd ed. Copyright 1972 John Wiley & Sons, Inc. Reprinted bypermission of John Wiley & Sons, Inc. All rights reserved.)dCTdzdCTdzt2Figure 18-6t3Symmetric concentration gradients causing the spreading bydispersion of a pulse input.away from the peak and thus broaden the pulse. The pulse broadens as itmoves through the reactor.Correlations for the dispersion coefficients in both liquid and gas systemsmay be found in Levenspiel.2 Some of these correlations are given in Section18.4.5.An unsteady state mole balance on the inert tracer T givesFTCT -------- Ac -------zt(18-13)Substituting for FT and dividing by the cross-sectional area Ac , we have2C( UCT )C- -------TDa ---------2T- ----------------ztzPulse tracer balancewith dispersionThe plan(18-14)Once we know the boundary conditions, the solution to Equation (18-14) willgive the outlet tracer concentration–time curves. Consequently, we will have towait to obtain this solution until we discuss the boundary conditions in Section 18.4.2.We are now going to proceed in the following manner: First, we willwrite the balance equations for dispersion with reaction. We will discuss thetwo types of boundary conditions, closed-closed and open-open. We willthen obtain an analytical solution for the closed-closed system for the conversion for a first-order reaction in terms of the Peclet number, Pe (dispersion2O. Levenspiel, Chemical Reaction Engineering (New York: Wiley, 1962), pp. 290–293.
Fogler Web Ch18.fm Page 10 Monday, October 9, 2017 1:58 PM18-10Models for Nonideal ReactorsChapter 18coefficient) and the Damköhler number. We then will discuss how the dispersion coefficient can be obtained either from correlations in the literature or fromthe analysis of the RTD curve.18.4 Flow, Reaction, and DispersionNow that we have an intuitive feel for how dispersion affects the transport ofmolecules in a tubular reactor, we shall consider two types of dispersion in atubular reactor, laminar and turbulent.18.4.1 Balance EquationsIn Chapter 14 we showed that the mole balance on reacting species A flow in atubular reactor was2dCd CA- U --------A rA 0Da ---------2dzdz(14-16)Rearranging Equation (14-16) we obtainDa d2CA dCA rA- -------- ---- 0------ ---------U dz2dzU(18-15)This equation is a second-order ordinary differential equation. It is nonlinearwhen rA is other than zero or first order.When the reaction rate rA is first order, rA –kCA, then Equation (18-16)Flow, reaction, anddispersionDa d2CA dCA kCA- -------- -------- 0------ ---------U dz2dzU(18-16)is amenable to an analytical solution. However, before obtaining a solution, weput our Equation (18-16) describing dispersion and reaction in dimensionlessform by letting ψ CA / CA0 and z / L2Da DispersioncoefficientDa1 DamköhlernumberDamköhler numberfor a first-orderreaction1d ------ -------2- d ------ Da1 0Per dd(18-17)The quantity Da1 appearing in Equation (18-17) is called the Damköhlernumber for a first-order conversion and physically represents the ratioRate of consumption of A by reactionDa1 ----------------------------------------- kτRate of transport of A by convection(18-18)The other dimensionless term is the Peclet number, Pe,Rate of transport by convectionUlPer ---- -----Rate of transport by diffusion or dispersionDa(18-19)in which l is the characteristic length term. There are two different types ofPeclet numbers in common use. We can call Per the reactor Peclet number; it
Fogler Web Ch18.fm Page 11 Monday, October 9, 2017 1:58 PMSection 18.418-11Flow, Reaction, and DispersionFor open tubesPer 106,Pe f 104For packed bedsPer 103,Pe f 101uses the reactor length, L , for the characteristic length, so Per UL / Da . It is Perthat appears in Equation (18-17). The reactor Peclet number, Per , for mass dispersion is often referred to as the Bodenstein number, Bo, in reacting systemsrather than the Peclet number. The other type of Peclet number can be calledthe fluid Peclet number, Pe f ; it uses the characteristic length that determines thefluid’s mechanical behavior. In a packed bed this length is the particle diameterdp , and Pe f Udp / Da . (The term U is the empty tube or superficial velocity.For packed beds we often wish to use the average interstitial velocity, and thusU / is commonly used for the packed-bed velocity term.) In an empty tube,the fluid behavior is determined by the tube diameter dt , and Pe f Udt / Da . Thefluid Peclet number, Pe f , is given in virtually all literature correlations relatingthe Peclet number to the Reynolds number because both are directly related tothe fluid mechanical behavior. It is, of course, very simple to convert Pe f to Per :Multiply by the ratio L / dp or L / dt . The reciprocal of Per , Da / UL , is sometimescalled the vessel dispersion number.18.4.2 Boundary ConditionsThere are two cases that we need to consider: boundary conditions for closedvessels and for open vessels. In the case of closed-closed vessels, we assume that thereis no dispersion or radial variation in concentration either upstream (closed) ordownstream (closed) of the reaction section; hence, this is a closed-closed vessel, as shown in Figure 18-7(a). In an open vessel, dispersion occurs bothupstream (open) and downstream (open) of the reaction section; hence, this isan open-open vessel as shown in Figure 18-7(b). These two cases are shown inFigure 18-7, where fluctuations in concentration due to dispersion are superimposed on the plug-flow velocity profile. A closed-open vessel boundarycondition is one in which there is no dispersion in the entrance section butthere is dispersion in the reaction and exit sections.(b) Open-open vessel(a) Closed-closed vesselFigure 18-7Types of boundary conditions.18.4.2A Closed-Closed Vessel Boundary ConditionFor a closed-closed vessel, we have plug flow (no dispersion) to the immediateleft of the entrance line (z 0–) (closed) and to the immediate right of the exitz L (z L ) (closed). However, between z 0 and z L–, we have dispersionand reaction. The corresponding entrance boundary condition isAt z 0:FA(0–) FA(0 )
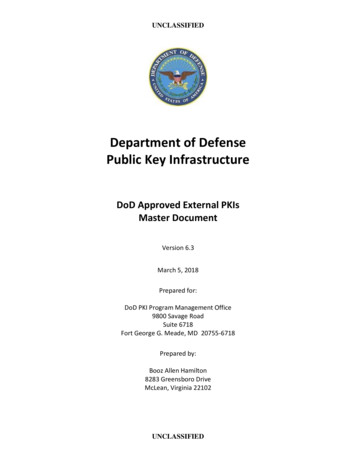
Fogler Web Ch18.fm Page 12 Monday, October 9, 2017 1:58 PM18-12Models for Nonideal ReactorsFA 0 0 Chapter 18Substituting for FA yields dC UAc CA (0 )UAc CA (0 ) Ac Da --------A dz z 0 z 0Solving for the entering concentration CA(0–) CA0Concentrationboundaryconditions at theentrance DCA0 -----------aU dCA CA ( 0 ) -------- dz z 0 (18-20)At the exit to the reaction section, the concentration is continuous, and thereis no gradient in tracer concentration.Concentrationboundaryconditions at theDanckwertsBoundaryConditionsAt z L:CA ( L ) CA ( L )(18-21)dCA-------- 0dzThese two boundary conditions, Equations (18-20) and (18-21), firststated by Danckwerts, have become known as the famous Danckwerts boundaryconditions.3 Bischoff has given a rigorous derivation by solving the differentialequations governing the dispersion of component A in the entrance and exitsections, and taking the limit as the dispersion coefficient, Da in the entranceand exit sections approaches zero.4 From the solutions, he obtained boundary conditions on the reaction section identical with those Danckwertsproposed.The closed-closed concentration boundary condition at the entrance isshown schematically in Figure 18-8 on page 857. One should not be uncomfortable with the discontinuity in concentration at z 0 because if you recallfor an ideal CSTR, the concentration drops immediately on entering from CA0to CAexit. For the other boundary condition at the exit z L, we see the concentration gradient, (dCA/dz), has gone to zero. At steady state, it can be shown thatthis Danckwerts boundary condition at z L also applies to the open-open system at steady state.18.4.2B Open-Open SystemFor an open-open system, there is continuity of flux at the boundaries at z 0FA(0–) FA(0 )CC Da --------A- UCA( 0 ) Da --------A- UCA( 0 )z z 0 z z 0 Open-openboundary condition34P. V. Danckwerts, Chem. Eng. Sci., 2, 1 (1953).K. B. Bischoff, Chem. Eng. Sci., 16, 131 (1961).(18-22)
Fogler Web Ch18.fm Page 13 Monday, October 9, 2017 1:58 PMSection 18.418-13Flow, Reaction, and Dispersion( )DCA0 CA 0 aUdCA 0dzz LdCA dz z 0 CA0CA (L )CA (0 )CA (L )(z)Prof. P. V. Danckwerts,CambridgeUniversity, U.K.0 0 z 0L L z L(a)(b)Figure 18-8Schematic of Danckwerts boundary conditions: (a) entrance; (b) exit.At z L, we have continuity of concentration anddCA-------- 0dz(18-23)18.4.2C Back to the Solution for a Closed-Closed SystemWe now shall solve the dispersion reaction balance for a first-order reaction21d ------ -------2- d ------ Da1ψ 0Per dd(18-17)For the closed-closed system, the Danckwerts boundary conditions in dimensionless form areAtAtDa1 τkPer UL/DaNomenclature noteDa1 is theDamköhlernumber for afirst-orderreaction, τkDa is the dispersion coefficient in cm2/sPer UL/Da1 d 0 then 1 ------ ------ Per d 0 ψ(0 )d 1 then ------ 0d(18-24)(18-25)At the end of the reactor, where λ 1, the solution to Equation (18-17) isCAL L ------- 1 XCA04q exp ( Per 2 ) ---------22( 1 q ) exp ( Per q 2 ) ( 1 q ) exp ( Per q/2)where q 1 4Da1/Per(18-26)
Fogler Web Ch18.fm Page 14 Monday, October 9, 2017 1:58 PM18-14Models for Nonideal ReactorsChapter 18This solution was first obtained by Danckwerts and has been published inmany places (e.g., Levenspiel).5,6 With a slight rearrangement of Equation(18-26), we obtain the conversion as a function of Da1 and Per .4q exp ( Per 2 )X 1 ---------22( 1 q ) exp ( Per q 2 ) ( 1 q ) exp ( Per q/2)(18-27)Outside the limited case of a first-order reaction, a numerical solution of theequation is required, and because this is a split-boundary-value problem, aniterative technique is needed.To evaluate the exit concentration given by Equation (18-26) or the conversion given by (18-27), we need to know the Damköhler and Peclet numbers.The first-order reaction rate constant, k, and hence Da1 τk, can be foundusing the techniques in Chapter 7. In the next section, we discuss methods todetermine Da by finding the Peclet number.18.4.3 Finding Da and the Peclet NumberThree ways tofind DaThere are three ways we can use to find Da and hence Per1. Laminar flow with radial and axial molecular diffusion theory2. Correlations from the literature for pipes and packed beds3. Experimental tracer dataAt first sight, simple models described by Equation (18-14) appear tohave the capability of accounting only for axial mixing effects. It will be shown,however, that this approach can compensate not only for problems caused byaxial mixing, but also for those caused by radial mixing and other nonflat velocity profiles.7 These fluctuations in concentration can result from different flow velocities and pathways and from molecular and turbulent diffusion.18.4.4 Dispersion in a Tubular Reactor with Laminar FlowIn a laminar flow reactor, we know that the axial velocity varies in the radialdirection according to the well-known parabolic velocity profile:r 2u(r) 2U 1 --- R where U is the average velocity. For laminar flow, we saw that the RTD function E(t) was given by 0 for t --τ2 E(t) τ2τ ------3 for t --2 2t5L τ -- U P. V. Danckwerts, Chem. Eng. Sci., 2, 1 (1953).Levenspiel, Chemical Reaction Engineering, 3rd ed. (New York: Wiley, 1999).7 R. Aris, Proc. R. Soc. (London), A235, 67 (1956).6(16-47)
Fogler Web Ch18.fm Page 15 Monday, October 9, 2017 1:58 PMSection 18.418-15Flow, Reaction, and DispersionIn arriving at this distribution E(t), it was assumed that there was no transfer ofmolecules in the radial direction between streamlines. Consequently, with theaid of Equation (16-47), we know that the molecules on the center streamline(r 0) exited the reactor at a time t τ/2, and molecules traveling on thestreamline at r 3R/4 exited the reactor at timeτLt L-- ----------------------------------- -------------------------------u 2U[ 1 ( r R )2 ] 2[ 1 ( 3 4 )2 ] 8--- τ7The question now arises: What would happen if some of the moleculestraveling on the streamline at r 3R/4 jumped (i.e., diffused) onto the streamline at r 0? The answer is that they would exit sooner than
3 (t) is the concentration of tracer in the effluent from the third reactor and the other terms are as defined previously. By carrying out mass balances on the tracer sequentially for reactors 1, 2, and 3, it is shown on the CRE Web site in the Expanded Material for Chapter 18 that the exit trac