Transcription
Basic Soil ScienceW. Lee DanielsSee http://pubs.ext.vt.edu/430/430-350/430-350 pdf.pdffor more information on basic soils!wdaniels@vt.edu; 540-231-7175http://www.cses.vt.edu/revegetation/
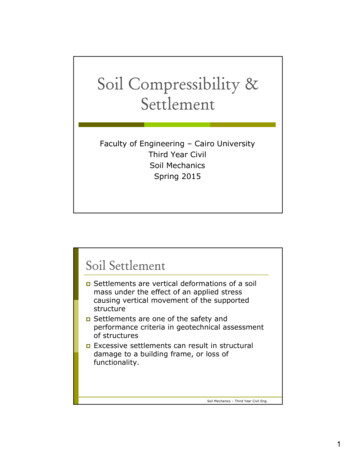
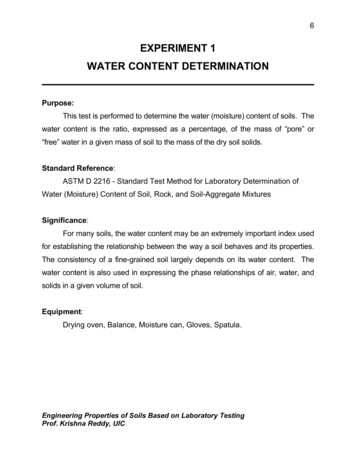
Well weathered(red, clayey) soilfrom thePiedmont ofVirginia. This soilhas formed fromlong termweathering ofgranite into soillike materials.A Horizon -- TopsoilB Horizon SubsoilC Horizon (deeper)
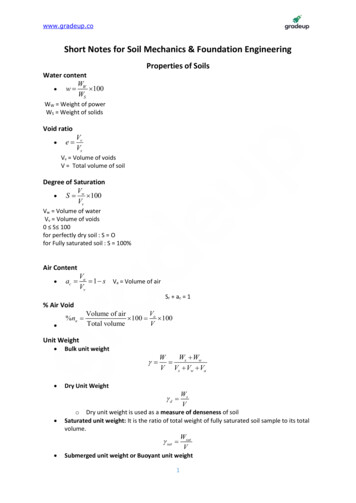
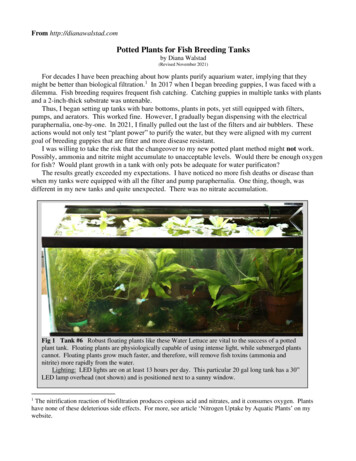
Native Forest SoilLeaf litter and roots ( 5T/Ac/year are “bioprocessed” to formhumus, which is the darkblack material seen inthis topsoil layer. In theprocess, nutrients andenergy are released toplant uptake and thehigher food chain. Theseare the “natural soilcycles” that we attemptto manage today.
Soil ProfilesSoil profiles are two-dimensional slicesor exposures of soils like we can viewfrom a road cut or a soil pit.Soil profiles reveal soil horizons, whichare fundamental genetic layers,weathered into underlying parentmaterials, in response to leaching andorganic matter decomposition.
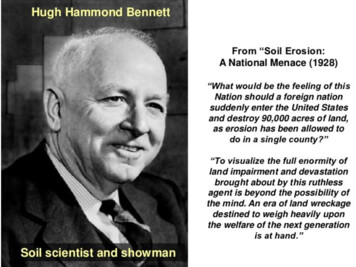
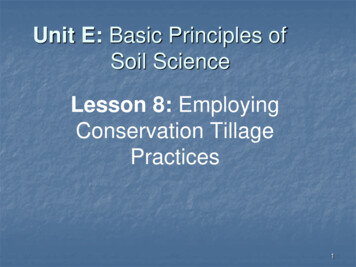
Fig. 1.12 -- Soils develophorizons due to thecombined process of (1)organic matter depositionand decomposition and (2)illuviation of clays, oxidesand other mobilecompounds downward withthe wetting front. In moistenvironments (e.g. Virginia)free salts (Cl and SO4 ) areleached completely out ofthe profile, but theyaccumulate in desert soils.
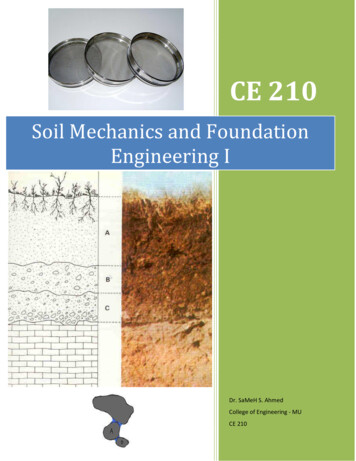
Master HorizonsOA O horizonA horizonE horizonB horizonC horizonR horizonEBCR
Master Horizons O horizono predominantly organic matter (litter and humus) A horizono organic carbon accumulation, some removal of clay E horizono zone of maximum removal (loss of OC, Fe, Mn, Al, clay ) B horizono forms below O, A, and E horizonso zone of maximum accumulation (clay, Fe, Al, CaC03, salts )o most developed part of subsoil (structure, texture, color)o 50% rock structure or thin bedding from water deposition
Master Horizons C horizono little or no pedogenic alterationo unconsolidated parent material or soft bedrocko 50% soil structure R horizono hard, continuous bedrock
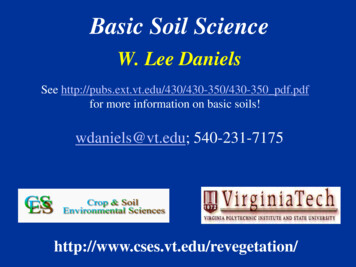
A vs. E horizonAAEBEB
A vs. B horizonSubscriptsApBw1Bw2ApBt1Bt2Bt3
What’s In Soil?Soil is a three-phase systemcontaining solids, liquids, andgasses that strongly interact witheach other.Soil contains four components,mineral fragments, organic matter,soil air, and water.
Figure 1.17
Mineral Constituents The majority of soil solids are primarymineral fragments like quartz andfeldspars along with synthesizedsecondary minerals like clays and ironoxides. Particles 2 mm are largely unreactiveand are called coarse fragments.
Some important soil Physical PropertiesColor - as defined by the Munsellsoil color bookTexture – the size distribution ofthe particlesStructure – how the particles areheld together as aggregatesDensity – pore space vs. solidspace is in the soilConsistence – resistance ofaggregates to pressure
Soil TextureParticle size distribution.The relative proportions of sand, silt and clay.Size separates (USDA)Sand 2 to 0.05 mmgrittySilt0.05 to 0.002 mmflouryClay 0.002 mmstickyFine earth fraction sand, silt and clayCoarse fragments are particles 2 mm.Soil texture describes the fine earth fraction!
TheTexturalTriangleExample:(see circle)15% sand15% clay70% silt
MontmorilloniteclayQuartz sand
Soil Structure Primary soil particles (sands, silts,clays) become cemented together byorganic matter and/or electrostaticforces over time. These groupings are called aggregatesor peds. The strength and shape of the pedsgreatly influence pore sizedistributions, water holding, gasexchange, and rooting.
Strong, coarse, crumbstructure (very rare)
Weak, fine, granular(common in sandy soils)
Moderate, medium, subangular blocky
Prismaticmacrostructurethat subdividesinto moderatemediumsubangularblocky structure.Note rootsconcentratedalong macropores on pedfaces.
Prism broken apartPrism intact
Compacted, platy replaced topsoil over highlycompacted tails/slimes subsoil.
Pasture, silt loamDb 1.45 Mg/m3Forest, silt loamDb 1.2 g/cm3
Factors promoting aggregation Polyvalent cations (Al3 or Ca2 ) ratherthan monovalent exchangeable cationslike Na . Forces that act to physically pushparticles together, such as wet-dry(shrink-swell) and freeze-thaw cycles. Active microbial biomass generatinghumic substances that “glue” particlestogether. Physical binding effects of fine roots andfungal mycelia. Burrowing animals move soil particles,and mix organic matter with mineralparticles in their guts producing stable
Soil Bulk Density (Db)dry mass of soiltotal soil volumeg3cmORMg3mTotal soil volume volume of soil solids and pore spacefor a sample as it would occur naturally in the ground.Soil Particle Density (Dp)dry mass of soilvolume of soil solidsAverage soil particledensity is 2.65 Mg/m3.
Figure 4.14 a
Db 1.75 Mg/m3
1.401.75Root limitingDb rangesfrom 1.4 to1.75!Figure 4.14 b
Db 1.75 Mg/m3 at bottom of plow layer.See the roots turn sideways!
Total pore spacedoes notindicate the sizedistribution ofpores!Packing poresInterpedporesBioporesPacking and texture affects soilporosity.Micropores are the packing voidsbetween fine clay and fine siltgrains.Macropores are found between pedsof fine-textured soils or betweensand grains in coarse textured soils.
Effects of lime and appropriate tillage in a garden soil.Lime tillage when soilwas moist (not wet).Lime tillagewhen soil was wet.
Tillage has mixed effects on aggregation. In general, itdecreases macropores. However, if we add lime plusorganic matter as we till, the overall effects can bebeneficial.
No-till corn crop withthick surface layer ofdead rye straw (killedin spring at planting)which serves as amulch. This drasticallylimits erosion andpromotes waterinfiltration, but alsohas significant effectson soil temperature!
Soil Organic MatterHumus is the dark brown to blackcomplex decomposition product oforganic matter turnover in soils. It iscolloidal, much more highly chargedthan clay on a weight basis, and istypically what we report as organicmatter content in soil testingprograms.
What Controls SOM Levels? Climate/Vegetation: Moist cool climatesgenerate more OM inputs. Cool and/or wetsoils limit microbial decomposition, leadingto OM accumulation Grasslands vs. trees add detritus in differingways: deeper thicker A’s in Mollisols vs.distinct litter layers (O’s) in Alfisols
Figure 12.21
What Controls SOM Levels? Texture: Sandy soils allow ready losses ofCO2 while clayey soils retain OM viahumus clay associations. So, SOM increaseswith clay content! Drainage: Poorly drained wet soils retainSOM due the slow nature of anaerobicdecomposition
Figure 12.22;SOM vs Texturefor a group ofsimilar soils.
Figure 12.17
Figure 12.24
So, our ability to maintain SOM depends ondynamics of climate, drainage, texture, and perhapsmost importantly, how we manage OM inputs vs.losses from the soil.
Managing Organic Matter Maintain a continuous supply of freshinputs. You can only maintain a certain level ofOM in any soil based on climate,drainage, texture, etc. You can waste alot of energy and money trying to “force”OM levels above their equilibrium point!
Managing Organic Matter Adequate N must be available in soils tosequester significant amounts of C.Without N, CO2 losses dominate. Higher levels of plant growth generallyincrease SOM levels Tillage decreases SOM levels Perennial vegetation increases SOMlevels
Soil Hydrology Soil and soil-landscape propertiesdirectly influence runoff/infiltrationpartitioning The soil is the major reservoir for waterreleased back to the atmosphere viaevapotranspiration The chemical quality of groundwater isdirectly controlled by soil chemistry
Runoff vs. Infiltration Precipitation falling on a soil landscape willfirst be subject to interception losses onvegetation of anywhere from 5 to 30% (lightrain on thick canopy). When the rate of rainfall exceeds theinfiltration rate of the soil, net runoff results. The infiltration rate is direct function of thedegree of macroporosity of the surface soil.
Runoff increaseswith slope (notshown)On a given slope,vegetation soilstructure enhanceinfiltration.
Drainage, Storage and ET Once water infiltrates the soil, water inlarge macropores will continue to movedownward due to gravity via drainage. Thisis the same concept as gravitational water. Water held up against leaching (see fieldcapacity later) is referred to as “soilstorage” available for evaporation (E) andtranspiration (T) by plants.
Figure 5.2
Water cycles fromthe soil to the plantand then back tothe atmosphere dueto differences inwhat is known as“water potential” or“free energy”.Basically, thedemand for waterin the atmosphere(very low waterpotential) suckswater up the plantfrom the soil.
Figure 6.15 a
Practical Applications Water moves throughout the soil-plant-atmosphericsystem due differences in free energy – alwaystowards a more negative potential. Soils exert a much more negative potential on waterthan gravity, so the soil holds water until the plantroot pulls it out due to atmospheric stress/suction. During the growing season in Virginia, particularlyonce we get plant canopy developed, it is very difficultto drive a wetting front all the way through the solumdue to net ET demands of the vegetation.
Water and Plant Growth When the soil is saturated, all macroporesare filled, but gravitational water rapidlypercolates downward from macropores. This state of saturation is also calledmaximum retentive capacity and is themaximum amount of water the soil canhold.
Water and Plant Growth Once the soil loses its’ gravitational waterdownward (usually in minutes to hours),water that is held up the soil againstleaching is bound there by matric forceswhich range from –0.1 to –0.3 bars in thethicker portions of water films extendinginto macropores. The soil is now at fieldcapacity.
Water and Plant Growth As water continues to be evapotranspiredaway from the soil, the films of wateraround the soil surfaces become muchthinner, so the matric forces holding waterget much stronger (more negative). Finally,at about –15 bar potential (very thin waterfilms), plants wilt because they can’t pullwater off the soil. This is the wilting point.
Figure 5.32 a0 bars- 0.1 to 0.3 bars- 15 bars
Water and Plant GrowthSo, overall, the most importantconcept here is that “plantavailable water” in a soil istaken as the differencebetween water held at FieldCapacity and Wilting.
Figure 5.35
Figure 5.36
Important Points Sandy soils hold relatively low amounts( 10%) of total water at field capacity,but the vast majority of that water isplant available. Clayey soils hold relatively high amounts( 40%) of total water at field capacity,but the majority of that water is held atsuctions below the wilting point, makingit unavailable.
Soil pH Range. Note that the common range of soil pH undernatural conditions is from 5.0 to 9.0. For each pH change of 1 unit,the concentration of H changes 10X. So, how much more acidic isa pH 4.0 soil when compared with a pH 7.0 soil?
Note that the“normal extremerange” of pH is from3.8 up to 8.5. Soilsmore acid than thisare usually due to Soxidation; soilshigher in pH aresodium dominated.
Most soils in Virginia are highlyacidic with pH 5.5 due tothousands of years of organicmatter decomposition andleaching.
Well weathered soilwith a variety ofcharged clay mineralsurfaces present. TheBt horizon here isdominated bykaolinite, which isextensively coatedwith Fe-oxides likegoethite and hematite.
Types of Charged Surfaces(Colloids) in Soils Layer Silicate Clays like Kaolinite Poorly crystalline minerals like allophaneand imogolite in Andisols Iron (Fe00H or Fe203) or Aluminum[Al(OH)3] oxides or hydroxides. Theseusually coat other mineral grains Humus (organic compounds produced bymicrobial decomposition of OM)
kaolinitefine grained micamontmorillonitefulvic acid
Adsorption Properties The colloidal surface attracts both chargedcations (Al3 , Ca2 , etc.) and anions (NO3, SO42- , etc.) into a diffuse cloud of ionsthat is retained against leaching very close,but not attached to, the colloid’s surface. Water is also held against the surface bythese same charges and by the attractiveosmotic force of the ions here.
Cation Exchange Capacity Is measured in hundredths of moles (cmol) ofcharge (cmol ) per kilogram (kg) dry soil. So, our units of expression are cmol /Kg! CEC’s usually range from 5 to around 30 cmol for natural soils. This is the same unit as meq/100 g, just gyratedaround to fit the international system of units (SI).Many labs and books still report CEC as meq/100 g.
Soils are 3-dimensionalPolypedon Oneil B odyoSdetaenlipe U nit or DeacsdnaLiloSPolypedon TwoPedonProfileSolumexcludesCzyAExBtPedon(3 dimensionalsampling unit)CThreedimensionalProfileincludes CTwodimensional
Soil maps delineate different types of soil. In the example belowthe label # represents the type of soil or soils found in that area,and the letter indicates the slope.
What’s in a delineation?The soil within a given delineation on a soil map may be almostexclusively one series, or it may be a combination of series.Soil series are subdivisions of the “family” level of classificationby Soil Taxonomy.A soil series consists of soils that are similar in all major profilecharacteristics. The soils look, classify, and behave alike.Soil series descriptions can be found udes: a typical profile description, range in characteristics,competing series, associated series, and more .
Example - Pamunkey SeriesClassification - Fine-loamy, mixed, semiactive, thermicUltic HapludalfsLooks like thisSome whole soil propertiesslope 0 - 15%drainage class wellDepth to bedrock 80”Occur on nearly level to sloping streamterraces.
Phases of Soil SeriesPhases are used to specify the properties unique tothe survey area. Examples:Slope Class(2 to 7% slopes)Erosion(1- slight; 2 – moderate, etc.)Stoniness, flooding, etc.PaB2: Pamunkey loam, 2-7% slope, moderately eroded
3-DLandscapemodel22-DSoil map125413364
Major Map Unit TypesSoils that occur in relatively pure units ( 85%) on theoriginal field map and are mapped as consociationsThe dominant soil series is named but may includeother soils similar in use & management.Consociation of Alpha soilmight occur on auniform parent material
Complexes2 or 3 dominant dissimilar components that consistently occurnext to each other in a predictable pattern are named in mapunits called complexes.The components cannot be separated at the scale of 1:24,000.ABAComplex of Alpha-Betasoils might occur on aheterogeneous parentmaterial
Spot SymbolsIf a soil or feature is very uniquebut too small to be separated by apolygon, you can identify thefeature on a map by using aspecial symbol.Example: A rock outcrop orwet soil 20 ft across.This feature is not a soil, it iscalled a miscellaneous landtype. Other examples are:beaches, gravel bars, andurban land.
SpotSymbolsThis legend isfound on the2nd folded mapin the publishedsurvey
The map unit legend willlist all soil X phasecombinations that appearin that county survey. Insurveys since the early1980’s, the map unit codesare #s; in earlier soilsurveys letter codes aremore typical.
1. Pick a county (example pp/
2. Pick an area of interest – see aerial photo
3. Display soils map
4. Display soil ratings for application of interest.This example shows septic field limitations:red very limited, yellow somewhat limited
Native Forest Soil . Leaf litter and roots ( 5 T/Ac/year are “bio-processed” to form humus, whi