Transcription
Electronic Supplementary Material (ESI) for Chemical Communications.This journal is The Royal Society of Chemistry 2017Supplementary Materials forPSMA-Targeted Contrast Agents for Intraoperative Imaging of Prostate CancerKai Bao1,2, Jeong Heon Lee1, Homan Kang1, G. Kate Park1, Georges El Fakhri1,and Hak Soo Choi1**1Gordon Center for Medical Imaging, Department of Radiology, Massachusetts General Hospitaland Harvard Medical School, Boston, MA 02114, USA2Key Laboratory of Structure-Based Drug Design & Discovery, Ministry of Education,Shenyang Pharmaceutical University, Shenyang 110016, China.**Correspondence to H.S.C. @ hchoi12@mgh.harvard.eduThe PDF file includes:Supplementary MethodsFigure S1. Physicochemical properties of PEG-linked KUE conjugates.Figure S2. UPLC and MALDI analysis of KUE-PEGx-ZW800-1 (x 2, 4, 12, 24).Figure S3. UPLC analysis and ESI-TOF ( ) mass spectrum of PEG4-linked KUEconjugates.Figure S4. UPLCanalysisandESI-TOF( )massspectrumofPEGx-linkedKUE-ZW800 3C conjugates (x 0, 2, 4, 12, 24).Figure S5. In vitro PSMA targeting assay of KUE-PEG4-linked NIR fluorophores andKUE-PEGx-linked ZW800 3C conjugates (x 0, 2, 4, 12, or 24).Figure S6. In vivo biodistribution of ZW800 3C and KUE-PEG4-ZW800 3C in mice.1
Supplementary MethodsReagents: Unless otherwise noted, all the materials were American Chemical Society grade orhigher, and obtained from commercially available sources and were used without purification.HPLC-grade solvents were purchased from Fisher Scientific (Pittsburgh, PA) and Sigma-Aldrich(Saint Louis, MO). Ultra dry DMSO was purchased from Acros Organics (Geel, Belgium).Cy5.5 and Cy7 were purchased from GE Healthcare (Piscataway, NJ), while ZW800-1,ZW800-3C, and ZW800 3C were synthesized as previously reported.1-3KUE conjugation: Generally, the synthesis of the KUE-fluorophores involved one or two xy)carbenium hexafluorophosphate (HSPyU) was utilized togenerate the NHS ester forms of the NIR fluorophores in the presence of diisopropylethylamine(DIEA) in dimethyl sulfoxide (DMSO). The separation and purification of the NHS ester wereperformed smoothly by using simple precipitations in different solvents system, without thechromatographic process. The conjugation of KUE and PEG spacer with the NIR fluorophoreshad minimal impact on the spectral properties of each NIR fluorophore.HPLC purification: HPLC purification of compounds was performed on a Waters (Milford,MA) prepHPLC 150 mL fluid handling unit equipped with a symmetry Prep C18 column (19 x150 mm, 7 µm particle size), a dual-wavelength absorbance detector (254 and 700 nm), a manualinjector (Rheodyme 3725i) and a 2487 dual wavelength absorbance detector outfitted with asemi-preparative flow cell. Solvent A was water with 0.1% formic acid and solvent B wasabsolute methanol 0.1% formic acid. The purification utilized a linear gradient from 10% to 90%solvent B over 30 min. Mobile phase flow rate was 15 mL/min.ES-TOF mass spectroscopic analysis: The purity of all compounds was measured usingultra-performance liquid chromatography (UPLC, Waters) combined with simultaneous ELSD,2
absorbance (photodiode array), fluorescence and electrospray time-of-flight (ES-TOF) massspectrometry (MS). UPLC analyses were carried out using a Waters ACQUITY UPLC HSS C18column (2.1x50 mm, 1.8 µm) and Xevo G2 QTof detector connected to a PC with a MassLynx4.1 workstation. The mobile phase was solvent A 0.1% formic acid in water, solvent B 0.1%formic acid in methanol with a linear gradient from 10% to 90% (from A to B for 5 minutes).The flow rate was 0.6 mL/min and all compounds were identified by mass to charge ratio.Physicochemical and optical property analyses: The partition coefficient (logD at pH 7.4),topological polar surface area (TPSA), and net charges of each fluorescent conjugate werecalculated using JChem Calculator plugins (ChemAxon, Budapest, Hungary). All opticalmeasurements were performed at 37 C in 100% fetal bovine serum (FBS) buffered with 50 mMHEPES, pH 7.4. Absorbance and fluorescence spectra for all fluorescent conjugates werecollected using online fiberoptic HR2000 absorbance (200-1100 nm) and USB2000FLfluorescence (350-1,000 nm) spectrometers (Ocean Optics, Dunedin, FL). Excitation light wasprovided by a 5 mW of 650 nm red laser pointer (Opcom Inc., Xiamen, China) and 8 mW of 765nm NIR laser diode light source (Electro Optical Components, Santa Rosa, CA) coupled througha 300 µm core diameter, NA 0.22 fiber (Fiberguide Industries, Stirling, NJ). In silico calculationsof the partition coefficient (logD at pH 7.4), 2D and 3D stabilized structures were calculatedusing JChem calculator plugins (ChemAxon, Budapest, Hungary). The 3D conformer ofbioconjugates was calculated by using MarvinSketch 16.12.12 software (ChemAxon) to generatebioactive ligand geometries in minimally sized conformer sets.In vitro PSMA targeting assay: Human prostate cancer cells (PC-3 and LNCaP) werepurchased from the ATCC (Manassas, VA). The cells lines were cultured at 37 C, in ahumidified atmosphere containing 5% CO2, in RPMI 1640 medium (Mediatech Cellgro)supplemented with 10% of fetal bovine serum (Gemini Biotech Products, Woodland, CA) and5% of penicillin/streptomycin (Cambrex Bio Science, Walkersville, MD). Exponentially growing3
LNCaP and PC-3 cells at a confluence of 75% on glass coverslips were incubated for 60 min at 4 C with 0.2 mL of TBS containing 2 µM of each fluorophore. The cells were washed three timeswith TBS, and imaged on a previously described four-channel NIR fluorescence microscope.In vivo biodistribution and clearance: Animals were housed in an AAALAC-certified facilityand were studied under the supervision of BIDMC IACUC in accordance with the approvedinstitutional protocol (#057-2014). Male CD-1 mice weighing roughly 20 g were purchased fromCharles River Laboratories (Wilmington, MA) and male NCr nu/nu mice 5 to 6 weeks of ageweighing 22 g 3 g were purchased from Taconic Farms (Germantown, NY). Animals wereanesthetized with 100 mg/kg ketamine and 10 mg/kg xylazine intraperitoneally (WebsterVeterinary, Fort Devens, MA). 10-25 nmol (0.4-1.0 mg/kg) of the NIR fluorophore conjugate insaline were administered intravenously, and animals were imaged with our real-timeintraoperative imaging system.4-10 In this study, 670 nm excitation and 760 nm excitation fluencerates used were 4.0 and 11.0 mW/cm2, respectively, with white light (400 to 650 nm) at 40,000lx. Color video and 2 independent channels (700 nm and 800 nm) of NIR fluorescence imageswere acquired simultaneously with custom FLARE software at rates up to 15 Hz over a 15 cmdiameter field of view (FOV). The imaging system was positioned at a distance of 18 inchesfrom the surgical field. A custom filter set (Chroma Technology Corporation, Brattleboro, VT)composed of a 750 25 nm excitation filter, a 785 nm dichroic mirror, and an 810 20 nmemission filter were used to detect 800 nm fluorophores. For Cy5.5 detection, we used 650 22nm and 710 25 nm excitation and emission filters. For each experiment, camera exposure timeand image normalization was held constant. To quantify the blood clearance rate and urinaryexcretion, intermittent sampling from the tail vein was performed over the 4 h period followingintravenous administration. Approximately 10-20 µL of blood were collected using glasscapillary tubes at the following time points: 0, 1, 2, 5, 10, 15, 30, 60, 90, 120, 180, and 240 min.Custom intraoperative fluorescence imaging system was used to measure the fluorescenceintensity of each sample, and the concentration was calculated based on the image SBR using a4
standard curve for each fluorophore. To measure total body excretion in mice, animals weresacrificed at 30, and 240 min, and major tissues and organs were resected and imaged. Usingcapillary tubes, the amount of NIR fluorophore in each organ/tissue was quantified by measuringfluorescent intensity (photons/s/cm2/sr).H&E histology and NIR fluorescence microscopy: Resected tumor tissues were placed in 2%paraformaldehyde solutions in phosphate-buffered saline (PBS) for 30 minutes before mountingin Tissue-Tek OCT compound (Fisher Scientific, Pittsburgh, PA) and flash-freezing in liquidnitrogen. Frozen samples were cryosectioned (10 mm per slice), analyzed by NIR fluorescencemicroscopy, and also stained with hematoxylin and eosin (H&E). NIR fluorescence microscopywas performed on a 4-filter Nikon Eclipse TE300 microscope system as previously described.31,41Images were acquired on an Orca-AG apparatus (Hamamatsu, Bridgewater, NJ). Imageacquisition and analysis was performed using iVision software (BioVision Technologies, Exton,PA). Custom filter set (Chroma Technology Corporation, Brattleboro, VT) with 750 25 nmexcitation filters, 785 nm dichroic mirrors, and 810 20 nm emission filters were used to detectimaging signals in the frozen tissue samples.Quantitative analysis: At each time point, the fluorescence and background intensity of a regionof interest (ROI) over each tissue was quantified using custom imaging software and ImageJv1.48 (NIH, Bethesda, MD). The signal-to-background ratio (SBR) was calculated as SBR fluorescence/background, where background is the signal intensity of neighbouring tissues suchas muscle or skin obtained over the period of imaging time. All NIR fluorescence images for aparticular fluorophore were normalized identically for all conditions of an experiment. At leastthree animals were analysed at each time point. Statistical analysis was carried out using theunpaired Student’s t-test or one-way analysis of variance (ANOVA). Results are presented asmean standard deviation, and curve fitting was performed using the Prism version 4.0a software(GraphPad, San Diego, CA).5
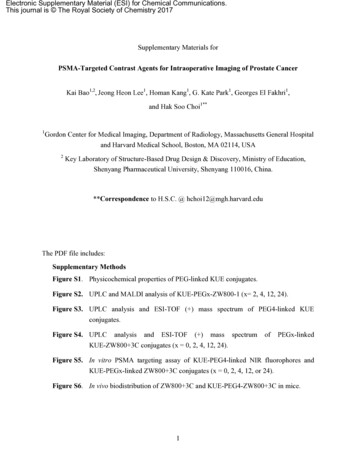
A.PEG linkerB.C.MW (Da)AtomsLength acid1145.687689KUE conjugateMW (Da)LogD, pH 7.4TPSA 00-12374.24-9.74562.63KUE conjugateMW (Da)LogD, pH 7.4TPSA (Å)KUE-ZW800 3C1302.40-9.00401.50KUE-PEG2-ZW800 3C1460.48-9.96449.06KUE-PEG4-ZW800 3C1549.54-13.65483.20KUE-PEG12-ZW800 3C1901.75-10.43541.36KUE-PEG24-ZW800 3C2430.06-11.00652.12Figure S1. Physicochemical properties of PEG-linked KUE conjugates. Polar surface area andhydrophobicity distributions were depicted using MarvinSketch 6.2.2 (ChemAxon). LogD partition coefficient; TPSA topological polar surface area.6
UPLC AnalysisMALDI MSDiode ArrayPDA@770 nmKUE-PEG2-ZW800-1C70H99N8O18S2 Exact Mass: 1405.67Diode ArrayDiode ArrayPDA@770 nmKUE-PEG4-ZW800-1C74H107N8O20S2 Exact Mass: 1493.72KUE-PEG12-ZW800-1Diode ArrayDiode ArrayPDA@770 nmC90H139N8O28S2 Exact Mass: 1845.93KUE-PEG24-ZW800-1Diode ArrayDiode ArrayPDA@770 nmC114H187N8O40S2 Exact Mass: 2374.24Figure S2. UPLC and MALDI analysis of KUE-PEGx-ZW800-1 (x 2, 4, 12, 24).7
KUE-PEG4-Cy5.5Diode ArrayPDA@770 nmC64H84N6O25S4Exact Mass: 1465.44TOF-MS KUE-PEG4-ZW800-1Diode ArrayPDA@770 nmC70H96N6O25S4 Exact Mass: 1549.54TOF-MS KUE-PEG4-ZW800 3CDiode ArrayPDA@770 nmC74H109N8O133 Exact Mass: 1317.81TOF-MS Diode ArrayPDA@770 nmKUE-PEG4-Cy7TOF-MS C58H82N6O19S2Exact Mass: 1230.51Figure S3. UPLC analysis and ESI-TOF mass spectrum ( ) of PEG4-linked KUE conjugates.8
KUE-ZW800 3CDiode ArrayPDA@770 nmC59H76N5O20S4 Exact Mass: 1302.40KUE-PEG2-ZW800 3CDiode ArrayPDA@770 nmC66H88N6O23S4 Exact Mass: 1460.48KUE-PEG4-ZW800 3CDiode ArrayPDA@770 nmC70H97N6O25S4 Exact Mass: 1549.54Diode ArrayPDA@770 nmKUE-PEG12-ZW800 3CC86H129N6O33S4 Exact Mass: 1901.75Diode ArrayPDA@770 nmKUE-PEG24-ZW800 3CC110H177N6O45S4 Exact Mass: 2430.06Figure S4. UPLC analysis and ESI-TOF ( ) mass spectrum of PEGx-linked KUE-ZW800 3Cconjugates (x 0, 2, 4, 12, 24).9
Figure S5. In vitro PSMA targeting assay on living prostate cancer cells: A series of (a)KUE-PEG4-linked NIR fluorophores and (b) KUE-PEGx-linked ZW800 3C conjugates (x 0,2, 4, 12, or 24) were incubated at a concentration of 2 µM in PSMA-negative PC3 cells at 4 Cfor 60 min prior to washing and image acquisition. Fluorescence images have identical exposuretime and normalization. Scale bars 100 µm.Abdominal cavityZW800 3CKUE-PEG4ZW800 3CThoracic cavityResected organsHe LuLiInKiSkBlKiInBlMuKiLiDu InLiDuHeHeKiDu InLuGBLuBlPaKiKiHeKiLi Pa/SpLuLi Pa/SpLuKiKiBlDuInMuKiLiFigure S6. In vivo biodistribution of ZW800 3C and KUE-PEG4-ZW800 3C in mice. EachNIR fluorophore was intravenously injected into 20 g CD-1 mice (10 nmol; 0.4 mg/kg) 4 h priorto imaging. Images are representative of n 3 independent experiments. Abbreviations used are:Bl, bladder; Du, duodenum; He, heart; In, intestine; Ki, kidney; Li, liver; Lu, lung; Mu, muscle;Pa, pancreas; Sp, spleen. Scale bars 1 cm.10
References1. H. S. Choi, S. L. Gibbs, J. H. Lee, S. H. Kim, Y. Ashitate, F. Liu, H. Hyun, G. Park, Y. Xie,S. Bae, M. Henary and J. V. Frangioni, Nat Biotechnol, 2013, 31, 148-153.2. H. Hyun, M. W. Bordo, K. Nasr, D. Feith, J. H. Lee, S. H. Kim, Y. Ashitate, L. A. Moffitt,M. Rosenberg, M. Henary, H. S. Choi and J. V. Frangioni, Contrast Media Mol Imaging,2012, 7, 516-524.3. H. Hyun, E. A. Owens, L. Narayana, H. Wada, J. Gravier, K. Bao, J. V. Frangioni, H. S.Choi and M. Henary, RSC Adv, 2014, 4, 58762-58768.4. H. S. Choi, W. Liu, P. Misra, E. Tanaka, J. P. Zimmer, B. Itty Ipe, M. G. Bawendi and J. V.Frangioni, Nat Biotechnol, 2007, 25, 1165-1170.5. H. S. Choi, B. I. Ipe, P. Misra, J. H. Lee, M. G. Bawendi and J. V. Frangioni, Nano Lett,2009, 9, 2354-2359.6. H. S. Choi, Y. Ashitate, J. H. Lee, S. H. Kim, A. Matsui, N. Insin, M. G. Bawendi, M.Semmler-Behnke, J. V. Frangioni and A. Tsuda, Nat Biotechnol, 2010, 28, 1300-1303.7. H. Hyun, M. Henary, T. Gao, L. Narayana, E. A. Owens, J. H. Lee, G. Park, H. Wada, Y.Ashitate, J. V. Frangioni and H. S. Choi, Mol Imaging Biol, 2016, 18, 52-61.8. H. Hyun, E. A. Owens, H. Wada, A. Levitz, G. Park, M. H. Park, J. V. Frangioni, M. Henaryand H. S. Choi, Angew Chem Int Ed Engl, 2015, 54, 8648-8652.9. H. Hyun, M. H. Park, E. A. Owens, H. Wada, M. Henary, H. J. Handgraaf, A. L. Vahrmeijer,J. V. Frangioni and H. S. Choi, Nat Med, 2015, 21, 192-197.10. H. Hyun, H. Wada, K. Bao, J. Gravier, Y. Yadav, M. Laramie, M. Henary, J. V. Frangioniand H. S. Choi, Angew Chem Int Ed Engl, 2014, 53, 10668-10672.11
rates used were 4.0 and 11.0 mW/cm2, respectively, with white light (400 to 650 nm) at 40,000 lx. Color video and 2 independent channels (700 nm and 800 nm) of NIR fluorescence images were acquired simultaneously with custom FLARE software at rat