Transcription
AN INTRODUCTION TO THE SHOCK RESPONSE SPECTRUMRevision SBy Tom IrvineEmail: tomirvine@aol.comJuly 9, 2012INTRODUCTIONSpacecraft and launch vehicle components encounter mechanical shock from a variety ofsources. Components must be designed and tested accordingly to ensure reliability.For example, engineers must anticipate transportation and shipping shock. Consider anavionics component encased in foam packing material inside a shipping container. Thecontainer is placed on a truck which runs over a speed bump or a railroad track at animprudent speed. The avionics component may receive a half-sine shock pulse. This typeof pulse can be readily represented in the time domain by its duration and peak amplitude.Also, reproduction of this pulse in an environmental test lab is usually straightforward.Eventually, the avionics component is integrated into a spacecraft. The component mustnow withstand a series of flight shock pulses. These pulses result from rocket motorignition, staging, and deployment events. Linear shape charge and pyrotechnic devices aretypically used to initiate staging events. These devices produce high-frequency, highamplitude shock energy as a by-product. A typical pyrotechnic pulse is shown in Figure 1.The corresponding shock response spectrum is given in Figure 2.TYPICAL SPACE VEHICLE PYROTECHNIC SHOCK300ACCEL (G)2001000-100-200-30000.010.020.03TIME (SEC)Figure 1.10.040.050.06
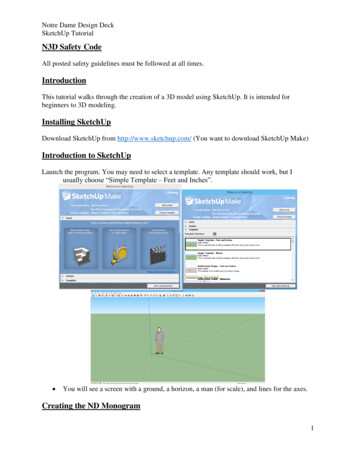
SHOCK RESPONSE SPECTRA Q 10 TYPICAL SPACE VEHICLE PYROTECHNIC SHOCK10000NegativePositivePEAK ACCEL (G)100010010110100100010000NATURAL FREQUENCY (Hz)Figure 2. Shock Response Spectrum of a Pyrotechnic Input PulseNote that the shock response spectrum is displayed in terms of its positive and negativespectral curves. This format is sometimes used to evaluate the integrity of the pulse.Ideally, the two curves should be approximately equal, as is the case in this example. Notethat the input pulse was measured during a pyrotechnic development test.The pyrotechnic pulse in Figure 1 was measured during a nosecone fairing separation testperformed on the ground. It is the result of ordnance detonation and the sudden release ofstrain energy from a clamp band.One of the purposes of this test was to measure shock levels at component mountinglocations so that proper component test levels could be derived.Note that pyrotechnic shock energy is a serious concern for electronic components. Thisenergy could cause a crystal oscillator to shatter, for example. It could also cause arelatively large component, such as a DC-to-DC converter, to detach from a circuit board.The pyrotechnic pulse in Figure 1 is a complex waveform. It tends to oscillate in asomewhat symmetric manner about the zero baseline. Its overall envelope has anexponential decay, although some lingering reverberation is also present.Unlike the transportation shock pulse, this pyrotechnic pulse is too complicated torepresent by a time domain mathematical function. Engineers need some other tool tounderstand the effect of the pyrotechnic shock on spacecraft components.2
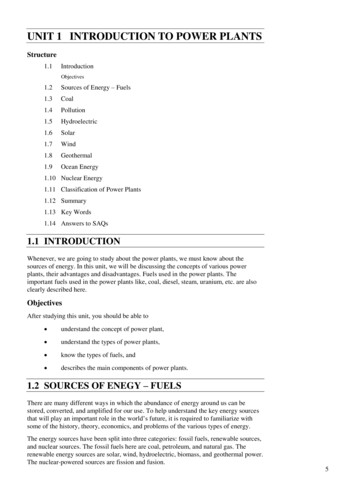
Furthermore, reproduction of the pyrotechnic pulse for a component qualification testwould be virtually impossible. This is particularly true if a mechanical test method is usedto simulate the pyrotechnic event. Another approach is needed for testing.The shock response spectrum is a useful tool for estimating the damage potential of ashock pulse, as well as for test level specification. Note that MIL-STD-1540C and MILSTD-810E require this format for certain shock environments.The purpose of this report is to explain the shock response spectrum and to give aderivation of a calculation method. The calculation method is carried out in the timedomain via a convolution integral.1 The end result is represented in terms of the naturalfrequency domain, however, as shown in Figure 2.SHOCK RESPONSE SPECTRUM MODELThe shock response spectrum is a calculated function based on the acceleration timehistory. It applies an acceleration time history as a base excitation to an array of singledegree-of-freedom (SDOF) systems, as shown in Figure 3 Note that each system isassumed to have no mass-loading effect on the base input.MK1M2C11.3fn2MKC2 XK3K2fn.X3X2M1.X1L.LY (Base Input)CC3 fn3 . LfnLLFigure 3. Shock Response Spectrum Model is the common base input for each system, and X is the absolue response of each systemYito the input. The double - dot denotes acceleration. M i is the mass, C i is the dampingcoefficient, and K i is the stiffness for each system. f n i is the natural frequency for eachsystem.1There is an equivalency between the convolution integral and the multiplication of Fouriertransforms. Thus, the calculation process can be carried out in terms of Fourier transforms. Thisequivalent process requires additional calculation steps, however. The industry preference is thusthe convolution method.3
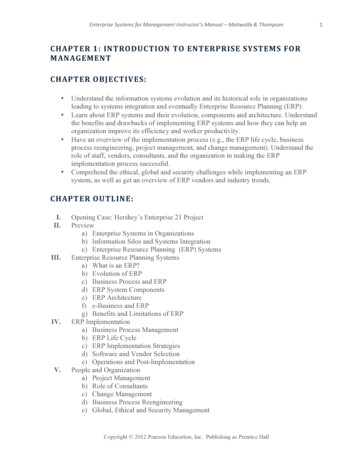
The damping of each system is typically assumed as 5%, which is equivalent to Q 10.The natural frequency is an independent variable. Thus, the calculation is performed for anumber of independent SDOF systems, each with a unique natural frequency.Any arbitrary set of unique natural frequencies can be used for the shock responsespectrum calculation. A typical scheme, however, is based on a proportional bandwidth,1/6such as 1/6 octave. This means that each successive natural frequency is 2times theprevious natural frequency. Thus, a sample set of N calculation frequencies in units of(1/6)(N-1)Hertz would be 10, 11.2, 12.6, 14.1, . , [10][2]. Note that the bandwidthincreases with frequency.Each of the natural frequencies in the above example represents the center frequency of anoctave band. Continuing with the 1/6 octave format, the following relationships hold forthe upper frequency fu and the lower frequency fl:fl [fc]/[ 2fu [fc ][21/121/12],], where fc is the center frequency.The 14.1 Hz band thus has lower and upper limits of 13.3 Hz and 14.9 Hz, respectively.The peak acceleration for a particular frequency is the exact value for that exact frequency,however.2 For simplicity, the peak value may be assumed to be the same for anyfrequency in a given band, or the peak for an off-center frequency may be found byinterpolation between two adjacent center frequencies.HALF-SINE EXAMPLEEach SDOF system has a unique time history response to a give base input. An example isshown in Figure 4. Note that the response calculation is carried out via a convolutionintegral, as explained later in the text.The shock response spectrum is the peak absolute acceleration response of each SDOFsystem to the time history base input.3 As an alternative, this function can be representedin terms of its peak positive and peak negative responses. The dimensions are peakresponse (G) versus natural frequency (Hz).Figure 5 shows the shock response spectrum corresponding to the example in Figure 4.2In contrast, the level at a center frequency in a random vibration power spectral density representsthe average mean square level across the band.3Another shock response spectrum format is based on the relative displacement of the mass. An“acceleration” is then calculated by multiplying the relative displacement by 2n , where n , isthe natural frequency in radians per second. This format is seldom used in the aerospace industry,however.4
RESPONSE (fn 30 Hz, Q 10)100BASE INPUT HALF-SINEPULSE (11 msec, 50 G)ACCEL (G)50100ACCEL E (SEC)-50RESPONSE (fn 80 Hz, Q 10)-10000.010.020.030.040.050.06100TIME (SEC)ACCEL IME (SEC)RESPONSE (fn 140 Hz, Q 10)100ACCEL (G)500-50-100Figure 3. SDOF Response to Half-sine Base Input500.010.020.03TIME (SEC)0.040.050.06
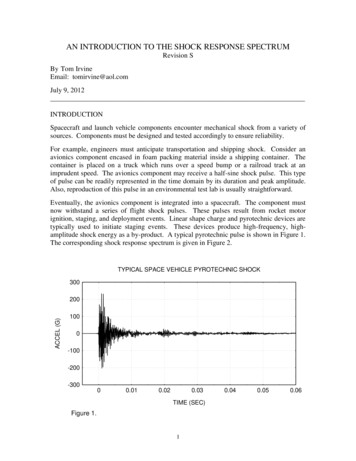
SHOCK RESPONSE SPECTRUM Q 10 BASE INPUT: HALF-SINE PULSE (11 msec, 50 G)200(80 Hz, 82 G)100(140 Hz, 70 G)PEAK ACCEL (G)(30 Hz, 55 G)502010510100NATURAL FREQUENCY (Hz)Figure 5. Corresponding Shock Response SpectrumNote that coordinate pairs are given explicitly for three natural frequency cases. Each ofthese coordinates represents the peak absolute response for one of the examples in Figure4.61000
DERIVATIONNewton’s law can be applied to a free-body diagram of an individual system, as shown inFigure 6.xMc(y - x )k(y-x)Figure 6. Free-body DiagramA summation of forces yields the following governing differential equation of motion:m x cx kx cy ky(1)A relative displacement can be defined as z x-y. The following equation is obtained bysubstituting this expression into equation (1):m z cz kz m y (2)Additional substitutions can be made as follows, n 2 km2 n (3)cm(4)Note that is the damping ratio, and that n is the natural frequency in radians per second.Furthermore, is often represented by the amplification factor Q, where Q 1/(2 Substitution of these terms into equation (2) yields an equation of motion for the relativeresponse z 2 n z n 2 z - y (t)7(5)
Equation (5) does not have a closed-form solution for the general case in which y (t) is anarbitrary function. A convolution integral approach must be used to solve the equation.The convolution integral is then transformed into a series for the case where y (t) is in theform of digitized data. Furthermore, the series is converted to a digital recursive filteringrelationship to expedite the calculation. A complete derivation is given in Appendix A.The resulting formula for the absolute acceleration is x i 2 exp n t cos d t x i 1 exp 2 n t x i 2 2 n t y i n t exp n t n 1 2 2 sin d t 2 cos d t y i 1 d (6)Equation (6) was used to calculate the shock response spectrum in Figure 2. Note that thisequation must be used for each natural frequency.ALTERNATE CALCULATION METHODAn alternate method for calculating the shock response spectrum is given in Appendix B.The alternate method is based on Fourier transforms.SAMPLING RATE CRITERIAA rule-of-thumb states that the sampling rate for the input time history should be at leastten times greater than the highest shock response spectrum calculation frequency.The Institute of Environmental Sciences and Technology has published the "IES Handbookfor Dynamic Data Acquisition and Analysis." This reference gives the followingguideline:Unlike other spectral quantities evolving from the discrete Fourier transformcomputations, the SRS is essentially a time domain quantity. Hence, the digitalsampling rate given by Rs 1/(delta t), introduces errors beyond those associatedwith aliasing about the Nyquist frequency. Thus, Rs must be high enough toaccurately describe the response of the SRS oscillators. To minimize potentialerror, it is recommended that the SRS computations be performed with a samplingrate of Rs 10 fh, where fh is the highest natural frequency of the SRScomputation.8
Likewise, the sampling rate should be at least ten times greater than the highest spectralcomponent in the input data. This is a data acquisition issue. An analog lowpass filter canbe used in the data stream to ensure that this criterion is met. Note that the filter should beanalog so that the filtering is performed prior to digitization.ERROR SOURCESBaseline ShiftNumerous problems can affect the quality of accelerometer data during pyrotechnic shockevents. A baseline shift, or zero shift, in the acceleration time history is perhaps the mostcommon error source.Chu notes in Reference 2 that this shift can be of either polarity and of unpredictableamplitude and duration. He has identified six causes of zero shift:a.b.c.d.e.f.Overstressing of sensing elementsPhysical movement of sensor partsCable noiseBase strain induced errorsInadequate low-frequency responseOverloading of signal conditioner.Accelerometer resonant ringing is a special example of causes "a" and "e.” This is aparticular problem if the accelerometer has a piezoelectric crystal as its sensing element.A piezoelectric accelerometer may have its amplification factor Q well above 30 dB atresonance. This resonance may be excited by high-frequency pyrotechnic shock energy.Resonant ringing causes higher element stresses than expected.Chu notes that this may cause the signal conditioner to overload, as followsWhen a signal conditioner attempts to process this signal, one of its stages isdriven into saturation. Not only does this clipping distort the in-band signalsmomentarily, but the overload can partially discharge capacitors in theamplifier, causing a long time-constant transient.This overload causes zero shift in the acceleration time history. This shift distorts the lowfrequency portion of the shock response spectrum.Piersol gives criteria for determining whether a signal has a zero shift in References 3 and4. Briefly, it involves integrating the acceleration time history to obtain a velocity timehistory. The velocity time history is then inspected for any unexpected net change.ExampleSaturated SignalAn accelerometer signal from a pyrotechnic shock test is shown in Figure 7. The velocitytime history and the shock response spectrum are also shown. Note that the velocity signal9
diverges from the zero baseline. Also, there is a wide margin between the positive andnegative spectral curves, particularly near 100 Hz. These problems indicate accelerometersaturation.Good SignalA similar set of plots for a good signal is given in Figure 8. Note that the velocity signaloscillates about the zero baseline. Also, the positive and negative spectral curves arenearly equal.SolutionAn analog lowpass filter can be placed before the first input stage of the signal conditionerto prevent overloading the electronics. Note that this filter can also be used to meet thesample rate criterion, as previously mentioned.A more effective solution, however, is to use an accelerometer which has a mechanical lowpass filter. The purpose of this filter is to prevent excitation of the accelerometer naturalfrequency.10
ACCEL (G)PYROTECHNIC SHOCK ACCELERATION TIME HISTORY SATURATED 0000.0100.0200.0300.040TIME (SEC)PYROTECHNIC SHOCK VELOCITY TIME HISTORY SATURATED SIGNALVELOCITY E (SEC)SHOCK RESPONSE SPECTRUM Q 10 PYROTECHNIC SHOCK SATURATED DATA5104PEAK (G)10NegativePositive310210110010101001000NATURAL FREQUENCY (Hz)Figure 7. Saturated Data Set1110000
ACCEL (G)PYROTECHNIC SHOCK ACCELERATION TIME HISTORY GOOD 0000.0100.0200.0300.040TIME (SEC)PYROTECHNIC SHOCK VELOCITY TIME HISTORY GOOD SIGNALVELOCITY (IN/SEC)500-5000.0100.0200.0300.040TIME (SEC)SHOCK RESPONSE SPECTRUM Q 10 PYROTECHNIC SHOCK GOOD DATA5104PEAK (G)10NegativePositive310210110010101001000NATURAL FREQUENCY (Hz)Figure 8. Good Data Set1210000
SHOCK RESPONSE SPECTRUM SLOPEConstant Velocity LineThe slope on a shock response spectrum curve is considered as a constant velocity line if itis equal to 6 dB/octave.A one-octave difference in frequency means that the higher frequency is twice the lowerfrequency.An amplitude difference of 6 dB means that the higher amplitude is twice the loweramplitude. Note that the difference in dB between two amplitudes A and B is calculatedby A dB 20 log B (7)Note that the log function is base ten.The slope N of a line on a log-log plot is given by A log 2 A1 N f log 2 f1 (8)where (f1, A1) and (f2, A2) are the two endpoint coordinates of the line.The slope is a constant velocity line if N 1, which corresponds to 6 dB/octave.Pyrotechnic shock response spectra tend to have an overall slope which represents aconstant velocity line. Local peaks, however, may have much higher slopes. The slopemay transition to a flat plateau in the higher frequency domain.13
Velocity FormulaThis section explains the calculation of velocity from acceleration. Harmonic oscillation istypically represented as followsx(t ) X exp( j t )(9)wherex(t)Xj is the displacement as a function of timeis the displacement amplitudeis the square root of –1is the oscillation frequencyThe velocity and acceleration terms are derived as followsx (t ) j X exp( j t )(10) x (t ) 2 X exp( j t )(11)Substitute equation (9) into (11). x (t ) j x (t )(12)The j term indicates phase. The magnitude relationship between acceleration and velocityis x (t ) x (t )(13)The frequency term can be converted as follows x (t ) 2 f x (t )(14)The velocity magnitude is thusx ( t ) 1 x ( t )2 f(15)Note that equation (15) is approximate for a transient response.14
Half-Sine Pulse Slope ExampleBase InputAn acceleration half-sine pulse is shown in Figure 9. The amplitude of the pulse is 1 G.The duration is 11 milliseconds. The net velocity change of this input pulse is 2.7 in/sec,as calculated by integration.BASE INPUT: 1 G, 11 msec HALF-SINE PULSEACCEL (G)1.00.5000.0050.0100.0150.020TIME (SEC)Figure 9. Half-Sine Base Input PulseAcceleration and Velocity Time History Responses for a Half-Sine Base InputConsider a single-degree-of-freedom system with a natural frequency of 10 Hz, and anamplification factor of Q 10. The acceleration time history response of this system to thebase input pulse is shown in Figure 10. The absolute peak acceleration response is about0.4 G.Note that a full set of acceleration response time histories must be generated to obtain thepeak response for each natural frequency. Again, these peak acceleration values determinethe shock response spectrum.The absolute and relative velocity responses are shown in Figure 11. Equation (15)assumes oscillation about a zero baseline for both acceleration and velocity. Thus, therelative velocity curve response should be used for this analysis. The peak velocity valueis thus approximately 2.5 in/sec.15
INPUT AND RESPONSE FOR HALF-SINE PULSE1.0SDOF Response, fn 10 Hz, Q 10Base Input, 1 G, 11 msec, Half-sineACCEL (G)0.50-0.500.050.100.150.200.250.300.35TIME (SEC)Figure 10. Half-Sine Base Input and Acceleration ResponseSDOF VELOCITY RESPONSE (fn 10 Hz, Q 10)6Absolute VelocityRelative Velocity5VELOCITY (IN/SEC)43210-1-2-300.050.100.150.20TIME (SEC)Figure 11. Velocity Response to Half-Sine Pulse160.250.300.35
Shock Response Spectrum of a Half-Sine Base InputA full shock response spectrum for the base input is given in Figure 12. Note that theshock response spectrum amplitude is 0.4 G at 10 Hz, as expected from Figure 10. Also,note that the initial slope of the spectrum is 6 dB/octave. This slope represents a constantvelocity of 2.5 in/sec, in agreement with Figure 11.ABSOLUTE ACCELERATION SHOCK RESPONSE SPECTRUM1 G, 11 msec HALF-SINE SHOCK BASE INPUT102.5 in/secconstant velocity6 dB/octavePEAK (G)10.10.01110100100010000NATURAL FREQUENCY (Hz)Figure 12. Shock Response Spectrum of Half-Sine PulseThe constant velocity of 2.5 in/sec is verified via equation (15) for three cases in Table 1.Table 1. Peak Velocity for Half-Sine SRSNaturalSRSPeak .550.22.5100.42.517
Pyrotechnic Pulse Slope ExampleAcceleration and Velocity Responses to Pyrotechnic Base InputRecall the pyrotechnic shock pulse from Figure 1. The response of 50 Hz system with anamplification factor of Q 10 is shown in Figure 13. The peak response magnitude is about8.5 for both the positive and negative polarities.The velocity response of the same system is shown in Figure 14. The peak velocity isabout 10.5 in/secSDOF ACCELERATION RESPONSE (fn 50 Hz, Q 10) TO PYROTECHNIC SHOCK BASE INPUT10ACCEL (G)50-5-1000.020.040.060.080.100.120.14TIME (SEC)Figure 13. Acceleration Response to Pyrotechnic Pulse180.160.18
SDOF VELOCITY RESPONSE (fn 50 Hz, Q 10) TO PYROTECHNIC SHOCK BASE INPUT15VELOCITY .160.18TIME (SEC)Figure 14. Velocity Response to Pyrotechnic PulseShock Response Spectrum of Pyrotechnic Base InputThe pyrotechnic pulse shock response spectrum from Figure 2 is shown again in Figure 15,with an expanded range and domain. Note that the amplitude is about 8.5 G at 50 Hz forboth the positive and negative curves, in agreement with Figure 13.Two slope curves are superimposed on the plot. The overall trend is 6 dB/octave. Thecorresponding velocity is 11.1 in/sec, which is approximately equal to the 10.5 in/sec valuein Figure 14.The respective slopes of individual peaks, however, take on a variety of values. Forexample, the slope is 12 dB/octave from 10 Hz to 20 Hz. The slope in the 40 Hz to 50 Hzdomain is higher yet.19
SHOCK RESPONSE SPECTRUM Q 10BASE INPUT: PYROTECHNIC SHOCK PULSE10000negative SRSpositive SRS11.1 in/secconstant velocity6 dB/octavePEAK (G)100010012 dB/octavevariable velocity1010.15101001000NATURAL FREQUENCY (Hz)Figure 15. Shock Response Spectrum of Pyrotechnic Pulse2010000
COMPONENT QUALIFICATION TEST METHODSPurposeThe purpose of component qualification testing is to verify that the component can survivethe shock event. Furthermore, some components are required to operate properly duringthe event itself. These components must be powered and monitored during the test.ExplosivesConsider that a shock response spectrum specification has been derived for a component.There are several possible methods for performing the test.A component could be mounted to a plate. The opposite side of the plate could be excitedby an explosive device or by a mechanical impact. Explosive devices may be required ifthe specification has a plateau above 10,000 G. The plate method often allows thespecification to be satisfied simultaneously in all three orthogonal axes, regardless ofexcitation source.Mechanical ImpactMechanical impact methods are typically used if the specification has a plateau between1000 G and 10,000 G. The impact device could be a pendulum hammer or a pneumaticpiston. An example of a test set-up using a pneumatic device to excite a beam is shown inFigure 16.Shaker MethodCertain specifications can be met on an electromagnetic shaker. Note that the mainadvantage of the shaker method is repeatability. The shaker method typically requires thespecification level to be below 1000 G. Furthermore, the maximum frequency should beless than or equal to 2000 Hz. At higher frequencies, the shaker resonant and anti-resonantfrequencies would interfere with the control algorithm.21
Figure 16. Shock Test Set-upAndy Trudgen and Rick Baird, the author’s colleagues, devised this set-up. A pneumatic gun is inthe foreground. The gun is powered by shop air. The black, vertical cylinder is a solenoid valve.The pressure is set at 10 to 30 psig, depending on the required shock level. The gun fires a steelrod into a plate or beam, at point blank range. In this case, the test item was a small couplerdevice which was mounted on top of the beam. A triaxial accelerometer was mounted on thebeam adjacent to the test item.22
Testing LimitationsAccelerationThe shock response spectrum method is an excellent method for characterizing the accelerationresponse of a system.Acceleration input is easy to measure. Acceleration is an “across variable.” It is analogous tovoltage measurement. The voltage potential across two points of circuit can be easily measured,with negligible effect on the circuit.ForceForce is also a significant variable, however. Force is a “through variable.” Force is analogous tocurrent. Electrical current is awkward to measure because the circuit must be broken in order tomake the measurement. The current meter becomes a significant part of the circuit. Mechanicalforce is likewise difficult to measure because the “mechanical circuit” must be broken in order toinsert the force sensor.Dynamic force is seldom measured in component shock testing.4Mechanical ImpedanceConsider an avionics component mounted to a compliant bulkhead in a space vehicle. The shocklevel at the mounting location is measured during a ground separation test. A shock level is thenderived in terms of acceleration. For the qualification test, the component is mounted on a thickmetal plate. The mechanical impedance of the test plate is much greater than that of the bulkhead.The force input to the box during the component test may be entirely different than the force inputduring flight, even if the acceleration is similar in each case.AgonyAuthors such as Luhrs in Reference 5 have agonized over this lack of realism in testing. Heclaims, for example, that mechanical impact methods are overly severe for satisfying a shockresponse spectrum specification.“Real-world” schedule and financial pressures seldom allow engineers the opportunity to pursuesuch lofty goals as impedance-matching and force measurements.COMPONENT ISOLATIONReturn to the shock response spectrum in Figure 2. Consider that it is the expected flight level fora particular component. Consider that the component has a natural frequency of 1000 Hz. Notethat the peak level at 1000 Hz is about 55 G for both the positive and negative curves. The designengineer could reduce this peak level to 10 G by shifting the natural frequency to 200 Hz. Onepossible approach to achieve this is to mount the component with isolator bushings, made fromrubber or plastic material.4An exception is modal testing where the force input from a hammer or shaker is measured. Modal testinghas a different purpose than component qualification testing, however.23
Isolator mounts are used to break metal-to-metal contact between the avionics componentmounting foot5 and the vehicle mounting structure, as shown in Figure 17.BoltWasherAvionicsBoxIsolator GrommetAvionics Box FootMounting Surface(locking insert not shown)Figure 17. Typical Isolator ConfigurationThe bolt may be a shoulder bolt in order to control the initial compression of the isolator.Usually, four isolator grommets are used for mounting an avionics component. Note that smallcomponents should be mounted via an isolated base plate, where the base plate serves as ballastmass.Isolators typically have the following effects:1. The isolators render the avionics component as a single-degree-of-freedom-system.2. The isolators reduce the fundamental frequency of the avionics component.3. The isolators add damping.The first effect tends to be the most important. A single-degree-of-freedom system attenuatesenergy above 2 times its natural frequency. The isolators thus filter out high-frequencypyrotechnic energy.The reduced natural frequency effect, which is the second effect, is almost always desirable. Areduced natural frequency improves the lowpass filtering capability of the single-degree-offreedom system. A possible drawback is that the isolators might bring the natural frequency of theavionics component down to within one octave6 of a bulkhead natural frequency or a forcingfrequency. The isolators could thus cause some dynamic amplification at the avionics componentnatural frequency. The isolator damping, however, would minimize this amplification.5There are many varieties of isolator mounting schemes. For example, some avionics boxes are mountedon brackets which are in turn mounted via isolators to a structure. In this case, the intermediate bracketshould be fairly rigid to avoid dynamic coupling effects with the isolators.6The octave rule is a rule-of-thumb. It states that the respective natural frequencies of two systems shouldbe at least one octave apart if the systems are to be joined together. A one-octave separation means that thehigher of the two frequencies is twice the value of the lower frequency.24
PYROTECHNIC SHOCK PROPAGATIONSource shock data for explosive devices is given in Reference 6. The data is given in the form ofshock response spectra.Attenuation relationships are also given in this reference. These relationships give the attenuationas the shock energy propagates through material and across joints. The relationships areempirical.APPLICATION IN OTHER INDUSTRIESNotesThe aerospace industry is perhaps the prime user of the shock response spectrum method.Nevertheless, other industries also use this tool.Earthquake EngineeringEquipment mounted in buildings must be designed and tested to withstand seismic excitation.This is particularly true if the building is located in California or in some other earthquake-pronearea.Seismic shock response spectra are similar to spacecraft shock response spectra except for twodifferences1. Seismic shock response spectra are typically represented in terms of peak velocityrather than peak acceleration.2. Qualitatively, the seismic spectrum is dominated by low-frequency energy, whereas thespacecraft spectrum is dominated by high-frequency energy.Reference 7 gives examples of seismic shock response spectra.Transportation and ShippingThe shock response spectrum method is also used to characterize certain transportationenvironments. MIL-STD-810E, for example, specifies a crash hazard shock response spectrumfor certain components. This specification can be used to verify that a radio in a military vehiclewould still function even after the vehicle was involved in a moderate collision.Computer IndustryHard disk drives are particularly susceptible to shock. The drives may receive shock during avariety of environments1. Handling. For example, a drive may be dropped a few inches onto a worktable duringthe manufacturing process.2. Chassis installation. A power tool may be used to install the mounting screws.3. Transportation and shipping.The computer industry is moving toward the shock response spectrum method to characterizethese environments. Examples are given in Reference 8.25
FORCE SHOCKThe methods in this report have been applied to an SDOF system excited by a base excitationacceleration pulse. The same methods can be adapted to a system excited by an applied force asshown in Appendix C. Note that force impulses are used to excite structures for modal testing.SHOCK SEVERITYShock is usually measure
the upper frequency fu and the lower frequency fl: fl [fc]/[ 2 1/12], fu [fc ][2 1/12], where fc is the center frequency. The 14.1 Hz band thus has lower and upper limits of 13.3 Hz and 14.9 Hz, respect