Transcription
Embracing DiversityClayton County Community Services Authority, Inc.Head Start & Early Head Start Program2016 -2017 Annual Report
TABLE OF CONTENTSHISTORY/MISSION STATEMENT3PUBLIC AND PRIVATE FUNDS RECEIVED4BUDGETARY EXPENDITURES4-8PROPOSED BUDGET8ENROLLMENT/ATTENDANCE8 -10RESULT OF MOST RECENT REVIEW10OHS MonitoringPARENT ENGAGEMENT ACTIVITIES11-18CHILD OUTCOMES/TRANSITION TO KINDERGARTEN18- 26COMMUNITY ASSESSMENT UPDATE26-30ANNUAL AUDIT REPORT31 -442
Dear Community Partners,Welcome to our annual report. On December 12, 2007 the Improving HeadStart for School Readiness Act was passed and Head Start Programs aremandated to annually publish a report to the community they serve.The Clayton County Community Services Authority, Inc. Head Start Programwas established in the summer of 1965 as a summer program with 60 childrenand shortly afterwards became a 10 month center based program. Since theinception the program has increased from an enrollment of 60 children to acurrent enrollment of 352 Head Start, 72 Early Head Start – Child ChildcarePartnership children. We are a center based program with 3 centers - SouthAvenue has 219 Head Start & 24 Early Head Start children,Brookwoodcenter has 133 Head Start children & 16 Early Head Start children, and Phyl’sAcademy which is the partnership site has 32 Early Head Start – ChildcareExpansion (EHS-CCP) children.MISSION STATEMENTThe Clayton County CSA, Inc. Head Start / Early Head Start – Child CarePartnership and Pre- K Program provides quality, comprehensive services tolow income families with children ages Birth to Five years old, includingchildren with special needs. We empower families to become self sufficient inorder to achieve their life goals; and, we promote school readiness, familyliteracy, social competency, and parental involvement.3
Public and Private Funds Received 2016 -2017FUNDING STREAMSSOURCEFUNDINGHead Start FederalPublic 2,493,390.00Early Head Start –Childcare Public 1,126,440.00PartnershipBright From the Start - StatePublic 540,706.88Bright From the Start –Public 97,200.00Public 393,133.79Summer Program - StateUSDAIn-Kind Contributions –Head Volunteers 623,348.00StartIn-Kind Contributions – Early VolunteersHeadStart-Child 281,610.00CarePartnershipsTotal Funding 5,555,828.67Explanation of the budget expenditures and proposed budget for the fiscalyear:Head StartClayton County CSA, Inc. Head Start’s proposed budget dollar amounts abovereflect the program funding streams. The actual dollar amounts represent thebudget at the end of the grant year - 2,493,390. The stated budget for HeadStart federal funds includes an itemized budget for 56 staff salaries 1,138,607.33 fringe benefits - 422,299.92; totaling - 1,560,907.25; and 4nutrition service staff paid by USDA for a total of 60 Head Start employees;contractual services which includes health, mental health & disabilities 17,075.00, dental – N/A; service agreements: computer, fire systems, Xeroxcopiers, exterminating, safety rugs, communication, drug free workplace,4
grease removal - 41,369.26, transportation services / vehicle insurance 117,391.74 totaling 158,761.00. Also included in the budget are supplies:office - 28,553.61, janitorial - 17,182.39 and classroom - 175,071.31totaling - 220,807.31.Other expenditures are insurance: liability for the centers that we operate 2,024.00 for 352 children that we serve, general liability - 15,378.00; spacerental for program operations – Clayton County EOA, South Avenue 30,343.50; advertising - 695.00, utilities for all centers - 57,249.05;telephones for all centers - 7,025.13; parent activity funds for educationalactivities - 1,056.00; parent services during monthly meetings - 876.17;monthly Male Engagement Program - 998.36; membership dues - 3,193.29;staff travel to conduct home visits & other local trips - 3,403.10; and, repairs& maintenance of buildings - 14,298.96,training & staff development - 4,736.71, totaling - eandprofessionaldevelopment through quality trainings, therefore our staff is provided withtraining based on individual needs throughout each fiscal year. The sum of 33,558 is allocated for training & technical assistance.Indirect cost rates for all federal grants and contracts are periodically reviewedand negotiated with our cognizant federal agency, The Department of Health &Human Services. Approval of the rate is received annually. The program,over the years, has proven to be fiscally sound. The sum of 361,004.17 isallocated for indirect cost to the Grantee - Clayton County Community ServiceAuthority, Inc. Indirect costs are real costs incurred by the agency in support offederal activities which cannot be directly identified with a specific grant orcontract.These costs result from shared services such as administrativepersonnel, supplies, postage, utilities, rent, advertising, and depreciation forbuildings and equipment. These are real costs built into the agency budget.The indirect cost dollars received are not extra dollars, but are part of thebudget and are fully used to make the system work.5
In-Kind Services: 623,348.00 (Actual Recorded 650,532.23)The program derives volunteer services from community partners, parents andothers individuals throughout the year. These services are provided throughparent involvement, classroom literacy through the Clayton County PublicLibraries, medical services from the Clayton County Board of Health & ClaytonState University Nurses, dental services from Zoom, Health AdvisoryCommittee, trainings by Peach State Health Plan, Amerigroup, etc.Early Head Start- Child Care Partnership:Clayton County CSA, Inc. Early Head Start – Child Care Partnership proposedbudget dollar amounts above reflect the program funding streams. The actualdollar amounts represent the 12 month budget between 9/1/2016 -8/31/2017year - 1,126,400. The stated budget for Head Start federal funds includes anitemized budget for 21 staff and 10 support staff salaries - 562,351.37; fringebenefits - 206,172.01; temporary labor substitutes - 9,520.73, totaling 778,044.11; and 4 nutrition service staff paid by USDA for a total of 27 EarlyHead Start employees.Contractual services consist of Child Care partners services which coversrental for 4 classrooms and 1 office space rental at Phyl’s Academy totaling 35,026.00.Contractual services which includes health, mental health &disabilities & nutrition - 8,000.00, dental – N/A. Contractual totaling 43,026.00.Others services and expenditures are – Office supplies - 10,094.04,Janitorial Supplies - 5,301.17, Classroom supplies 51,721.56, staff travel forhome visits - 837.91, service agreements 8,920.55 , space rental at SouthAvenue center for 3 EHS classrooms and 2 staff offices 8,076.00, utilities 13,123.28, telephone 1,675.91, membership dues - 505.34, Parent services- 190.09, Parent Engagement - 696.00, liability insurance for 72 children6
413.95, Liability Insurance – General 5,314.00, Repairs and maintenance 4,352.80 totaling - geandprofessionaldevelopment through quality trainings, therefore our staff is provided withtraining based on individual needs throughout each fiscal year. The sum of 27,000.00 is allocated for training & technical assistance.Indirect cost rates for all federal grants and contracts are periodically reviewedand negotiated with our cognizant federal agency, The Department of Health &Human Services. Approval of the rate is received annually. The program,over the years, has proven to be fiscally sound. The sum of 167,147.29 isallocated for indirect cost to the Grantee - Clayton County Community ServiceAuthority, Inc. Indirect costs are real costs incurred by the agency in support offederal activities which cannot be directly identified with a specific grant orcontract.These costs result from shared services such as administrativepersonnel, supplies, postage, utilities, rent, advertising, and depreciation forbuildings and equipment. These are real costs built into the agency budget.The indirect cost dollars received are not extra dollars, but are part of thebudget and are fully used to make the system work.In-Kind Services: - 281,610 (Actual recorded 290,455.93)The program derives volunteer services from community partners, parents andothers individuals throughout the year. These services are provided throughparent involvement, classroom literacy through the Clayton County PublicLibraries, medical services from the Clayton County Board of Health & ClaytonState University Nurses, dental services from Zoom, Health AdvisoryCommittee, trainings by Peach State Health Plan, Amerigroup, etc.Bright From the Start:The sum of 540,706.88 from Bright from the Start was allocated for 90% of16 Pre-K staff salaries - 355,671.10 fringe benefits - 113,462.87, and costallocated funds of- 71,572.91 for two new classrooms start – up,office7
supplies, classroom supplies, repairs and maintenance, employees travel,rent, utilities, telephone, service agreements and administrative cost.Bright From the Start –Summer ProgramThe sum of 97,200 from Bright from the Start was allocated for 8 Pre-K staff,and 4 part time Transition Coaches salaries - 54,793.73, fringe benefits 16,546.32,staff travel – N/A, classroom supplies - 1,302.17, transportation 18,525.78, parent services - 200.00, administrative cost - 5,832.00.USDA:Out of 353,837.18 received from the Department of Agriculture (USDA) andcarryover funds from prior year of 18,247.06, 93,897.57 was allocated for 4nutrition staff salaries, 39,115.43 for fringe benefits, 21,566.09 for kitchenand program supplies, 170,844.19 for nutritious foods and snacks for thechildren that we serve, and 46,660.96 for administrative cost.The proposed budget for the fiscal year of 2017 - 2018Head Start Continuation 2,517,988.00Early Head Start -CCP 1,137,434.00Bright From the Start for Pre-K 564,591.00Bright From the Start –Summer Program 97,200.00USDA 379,056.00In-Kind Contributions -HS 629,497.00In-Kind Contributions –EHS 284,359.00Total Funding 5,610,125.00Enrollment information for Head Start 2016- 2017 school yearTotal number of families served – 430This number includes Head Start Pre-K blended services and those that wereenrolled and left the program before the school year end.Average monthly enrollment – 84.12%8
This is the average monthly enrollment when school was in operation fromAugust 2017- May 2018.Percentage of eligible children served – 99.2%The graph below reflects the number of Head Start eligible families servedduring the 2016– 2017 school yearPercentage of enrolled children that received medical and dental exams:MedicalDental96%96.3%Enrollment information for Early Head Start –CCP 2016- 2017 school yearTotal number of families served – 84This number includes 40 Expansion children serve at South Avenue &Brookwood centers, 32 serve at Phyl’s Academy centers, and also those thatwere enrolled but left the program before the school year end.Average monthly enrollment – 80.73%This is the average monthly enrollment when school was in operation fromAugust 2016 - July 2017. Inclement weather make –up days drasticallyaffected our average monthly enrollment9
Percentage of eligible children served – 100%The graph below reflects the number of Early Head Start – Child CarePartnership eligible families served during the 2016 – 2017 school year.Percentage of enrolled children that received medical exams and dentalhomes:MedicalDental100%100%Most Recent reviews / Audit reports:Our Head Start program is now on a 5-year grant cycle. Based on theMonitoring Cycle Schedule, our second review was conducted on February 22-23, 2017 on Early Head Start –Child Care Partnership (EHS –CCP) andexpansion program. The report received, showed no findings as we are incompliance. TheHead Start & Early Head Start – Child Care Partnershipprogram will be reviewed during the Fiscal year 2018.Our annual report of July 2016 was in compliance with only technicalassistance information from the auditors. (See document attached).10
Parent Engagement and Activities:Every center in our program has parent committees and all parents whosechildren are enrolled in Head Start are members. Meetings are held on amonthly basis. Parents conduct elections at each center and select parentsbased on the formula of every 40 children to one parent to serve on the PolicyCouncil. Alternates are also elected from every center should a member beabsent from the Policy Council meeting.Parents are involved in all facets of the programs activities – from curriculumplanning to making decisions on how to use parent activity funds, planningevents, monthly meetings, and providing in-put on staff selection/hiring.In addition to the above named activities the program recognizes fatherhoodand male involvement as a vital part of their child’s growth and development;hence, we have monthly meetings for our fathers/male participation. Thesemeetings are always planned by them with speakers based on approvedtopics. The program has planned monthly sports activities geared towards ourmale family’s interests. Some of the activities previously planned were T-BallDay, Kite Day, Soccer Day and Basketball Shoot out.Our program is highly diverse and annually we celebrate our diversity. Ourparents and the community play an important role in initiating our InternationalDay Celebration.During the weeks leading up to the event, parents areexcitedly assisting with decorating the classrooms to reflect the country thatwas chosen by their child’s teacher. Parents learn along with their child aboutthe culture of the different countries selected.11
Parents are encouraged to volunteer in the classroom on a daily basis. Alarge emphasis is placed on them reading to their children to strengthen andbuild language and literacy skills for the child as well as themselves. Parentsare asked to chaperone on field trips to provide extra safety precautions.Annually, our parents complete a Parent Questionnaire which assists us inevaluating our program. Parents are made aware that they may volunteer inany capacity of the program within the guidelines of the Center’s Policies andProcedures and Program Performance Standards.12
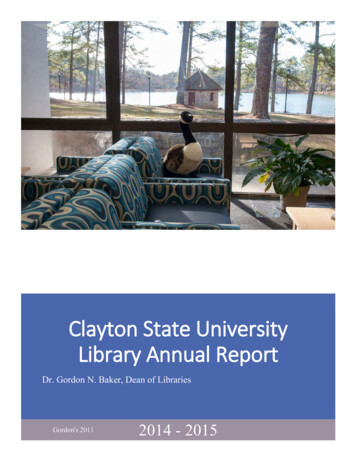
Curriculum Day - Male EngagementParent Engagement Survey Graph 2016-20172016 – 2017 FAMILY OUTCOMESHead Start & Pre-K13
The Clayton County Community Services Authority Inc., Head Start / Pre-K program,has conducted its final Family Outcomes Analysis for the 2016 – 2017 school yearusing the Child Plus Monitoring System. The outcomes listed in the above graph,shows a comparison between the parent outcomes for the Fall, Winter and Springcheckpoints. The above graphs (Fall, Winter & Spring Checkpoints) also shows theprogress families have made in obtaining their established goals from the beginning ofthe school year. During the 1st (Fall) Checkpoint, approximately (318) families settheir goals in reference to the Family Partnership Agreement (FPA). During the 2nd(Winter) Checkpoint, approximately (296) families set goals in reference to the FPA.During the 3rd (Spring) Checkpoint, approximately (246) families set their goals inreference to the FPA. From graphed information above as well as the information14
listed below, shows the aggregated data based on accumulative percentage of eachfamily goal for the final total combined (Fall, Winter & Spring Checkpoint).1. FAMILY WELL-BEING: Out of 246 families (21 being the highest scorethat can be obtained on this goal), 200 (18.7) met and 5 did not meet(2.3%). The agency will continue to support parents and families related tosafety, maintaining good health, and showing an increase toward financialsecurity.2. POSITIVE PARENT-CHILD RELATIONSHIP: Out of 246 families(12 being the highest score that can be obtained on this goal), 230 (10.6) metand 2 families did not meet (0.9%). The agency will continue to supportparents & families toward improving parenthood along with increasing awarm relationship that nurture their child’s learning & development.3. FAMILIES AS LIFELONG EDUCATORS: Out of 246 families (18being the highest score that can be obtained on this goal), 210 (14.9) metand 3 families did not meet (1.4%). The agency will continue to supportparents and families observe, guide, promote and participate in the everydaylearning of their children at home, school, and in their communities.4. FAMILIES AS LEARNERS: Out of 246 families (12 being the highestscore that can be obtained on this goal), 222 (9.9) met and 2 families did notmeet (1%). The agency will continue to support and encourage parents andfamilies to advance their own learning interests through education, trainingor other experiences that support their parenting, career, and life goals.5. FAMILIES ENGAGEMENT IN TRANSITIONS: Out of 246 families(12 being the highest score that can be obtained on this goal), 222 (9.6) metand 2 families did not meet (0.8%). The agency will continue to supportparents & families with advocating for their child’s learning anddevelopments as they transition from Head Start to Kindergarten.6. FAMILY CONNECTION TO PEERS AND COMMUNITY: Out of246 families (12 being the highest score that can be obtained on this goal),224 (8.9) met and 2 families did not meet (0.9%). The agency will continueto support parents and families connections with peers and mentors informal or informal social networks that are supportive and educational,along with enhancing social well-being and community life.7. FAMILIES AS ADVOCATES AND LEADERS: Out of 246 families (18being the highest score that can be obtained on this goal), 212 (14.3) metand almost 2 families did not meet (1%). The agency will continue tosupport parents and families participating in leadership development,decision-making, program policy development, and community and stateorganizing activities to improve children’s development and learningexperiences.15
At the end of the 2016-2017 school year, a total of (287) familiescompleted their goals (83 %). This leaves total of (8) families (17%) still inthe goal setting process. Since more than (50%) of our families were able tocomplete their goals, the Family Partnership Agreement Process was asuccess. The Family Service Workers will continue to communicate andengage with the parents of returning children, on a regular basis as itpertains to their family goals, as well as with new families entering theprogram for the 2017-2018 school year.EHS Parent Engagement Survey Graph2016 – 2017 FAMILY OUTCOMESEHS Head Start/ CCP201816141210Met8Not Met6420PositiveFamilies asFamily WellParent-ChildLifelongBeing(18.4 of 21) Relationship Educators(10.8 of 12) (15.3 of 18)FamilyFamilyFamilies asEngagement ConnectionsLearners(10.2 of 12) in Transitions to Peers and(9.7 of 12) Community (9of 12)Families asAdvocatesand Leaders(13.9 of 18)16
The Clayton County Community Services Authority Inc., Head Start / Early HeadStart /Pre-K program, has conducted its final Family Outcomes Analysis for the 2016– 2017 school year using the Child Plus Monitoring System. The outcome listed in theabove graph, shows a comparison between the parent outcomes for the Fall, Winter,and Spring checkpoints. The above graph (Fall, Winter & Spring Checkpoints) alsoshows the progress families have made in obtaining their established goals from thebeginning of the school year. During the 1st (Fall) Checkpoint, approximately (64)families set their goals in reference to the Family Partnership Agreement (FPA).During the 2nd (Winter) Checkpoint, approximately (63) families set goals inreference to the FPA .During the 3rd (Spring) Checkpoint, approximately (63) familiesset their goals in reference to the FPA. From graphed information above as well as theinformation listed below, shows the aggregated data based on accumulative percentageof each family goal for the (overall combined Fall, Winter & Spring Checkpoints).1. FAMILY WELL-BEING: Out of 63 families (21 being the highest scorethat can be obtained on this goal), 57 (19) met and 1 did not meet (1.3%).The agency will continue to support parents and families related to safety,maintaining good health, and showing an increase toward financial security.2. POSITIVE PARENT-CHILD RELATIONSHIP: Out of 63 families (12being the highest score that can be obtained on this goal), 57 (11.3) met and4 families did not meet (0.9%). The agency will continue to support parents& families toward improving parenthood along with increasing a warmrelationship that nurture their child’s learning & development.3. FAMILIES AS LIFELONG EDUCATORS: Out of 63 families (18 beingthe highest score that can be obtained on this goal), 53 (16) met and 2families did not meet (1.5%). The agency will continue to support parentsand families observe, guide, promote and participate in the everydaylearning of their children at home, school, and in their communities.4. FAMILIES AS LEARNERS: Out of 63 families (12 being the highestscore that can be obtained on this goal), 53 (10.6) met and 4 families did notmeet (0.9%). The agency will continue to support and encourage parentsand families to advance their own learning interests through education,training or other experiences that support their parenting, career, and lifegoals.5. FAMILIES ENGAGEMENT IN TRANSITIONS: Out of 63 families(12 being the highest score that can be obtained on this goal), 52 (10.2) metand 1 families did not meet (1.1%). The agency will continue to supportparents & families with advocating for their child’s learning anddevelopments as they transition from Head Start to Kindergarten.17
6. FAMILY CONNECTION TO PEERS AND COMMUNITY: Out of 63families (12 being the highest score that can be obtained on this goal), 58(9.2) met and 6 families did not meet (0.5%). The agency will continue tosupport parents and families connections with peers and mentors in formalor informal social networks that are supportive and educational, along withenhancing social well-being and community life.7. FAMILIES AS ADVOCATES AND LEADERS: Out of 63 families (18being the highest score that can be obtained on this goal), 58 (14.6) met andalmost.4 families did not meet (0.7%). The agency will continue to supportparents and families participating in leadership development, decisionmaking, program policy development, and community and state organizingactivities to improve children’s development and learning experiences.At the end of the 2016-2017 school year, a total of (63) families completedtheir goals (75%). This leaves total of (8) families (23 %) still in the goalsetting process. Since more than (50%) of our families were able tocomplete their goals, the Family Partnership Agreement Process was asuccess. The Family Service Workers will continue to communicate andengage with the parents of returning children, on a regular basis as itpertains to their family goals, as well as with new families entering theprogram for the 2017-2018 school year.Child Outcome/Transition to Kindergarten:The Clayton County Community Services Authority, Inc. Head Start Programschool readiness goal is to ensure that all children enrolled in our programreceives quality education skills that will ensure their readiness to enterKindergarten.Our program curriculum is Creative Curriculum and our assessment tool isTeaching Strategies Goal. We assess children birth to five, 3 times a year (Fall- August through November, Winter - November through February, and Spring- February through May); Hence children are assessed every 60 days of 180days of Head Start (1170 hours) and 67 days of 203 days of Early Head Start– Child Care Partnership (1384 hours) programs operations.18
At every assessment checkpoint data is collected, aggregated and graphed forresults and outcomes. Based on the outcomes, program plans and goals willchange to meet the academic expectations of the children.The program’s school readiness classroom goals for the year has beenestablished and are designed to ensure continued academic learning andviable social skills, which are necessary for a smooth transition intoKindergarten. These goals may change according to the results yielded duringcheckpoints to meet the academic expectations of the children.Transitioning to Kindergarten Children ChartSocial & Emotional DevelopmentSocial & Emotional DevelopmentSocial & Emotional Development(Fall)(Winter)(Spring)20% Below2% Below1% Below60% Meeting Program Expectation61% Meeting Program Expectation20% Meeting Program Expectation20% Exceeds Program Expectation.37% Exceeds Program Expectation.79% Exceeds Program Expectation.Physical Development & HealthPhysical Development & HealthPhysical Development & Health15% Below2% Below0% Below79% Meeting Program Expectation74% Meeting Program Expectation62% Meeting Program Expectation6%Exceeds Program Expectation.24%Exceeds Program Expectation.38%Exceeds Program Expectation.Language & LiteracyLanguage & LiteracyLanguage & Literacy11%Below4%Below1%Below75%Meeting Program Expectation67%Meeting Program Expectation41%Meeting Program Expectation14% Exceeds Program Expectation.29% Exceeds Program Expectation.58% Exceeds Program Expectation.Cognition & General KnowledgeCognition & General KnowledgeCognition & General Knowledge25% Below6% Below3% Below67% Meeting Program Expectation61% Meeting Program Expectation32% Meeting Program Expectation8% Exceeds Program Expectation.33% Exceeds Program Expectation.65% Exceeds Program Expectation.Approaches to LearningApproaches to LearningApproaches to Learning1% Not Yet0% Not Yet0% Not Yet59% Emerging21% Emerging5% Emerging40% Meets Program Expectation79% Meets Program Expectation95% Meets Program Expectation19
Social & Emotional DevelopmentPhysical Development & Health20
Language & LiteracyCognition & General Knowledge21
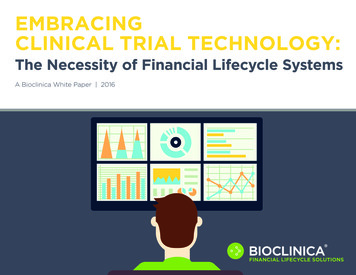
Approaches to LearningEnglish Language Acquisition (65 - Fall) (64 - Winter) (66 - Spring)22
Summary: Based on the above graphed data for the 3rd and finalcheckpoint for the 2016-17 school year, the children’s greatest areas ofstrengths are Approaches to Learning. Approaches to Learning includethe areas of Science, Social Studies and Creative Arts. Ninety-fivepercent (95%) of the children are Exceeding Program Expectations inthis area. There are no children in the Below/Not Yet category. Thesecond area of strength is Social Emotional Development, with 79% ofthe children Exceeding Program Expectations. Only 1% are in theBelow/Not Yet category.While there are no major concerns of weaknesses in any of the areas, thegraphed data reflects that there are minor weaknesses in areas ofCognition. Although 65% are Exceeding Program Expectations, 3%are in the Below/Not Yet category.English Language Acquisitions: of the 66 transitioning Dual LanguageLearners, 84% are at the level of 5 or higher at the 3rd and finalcheckpoint for the 2016-17 school year. This shows that these childrenhas successfully attained and understand the English language to a degreethat they are able to master the necessary skills needed to excel inKindergarten.Program Improvement Plans for the 2017 - 2018 school year are asfollows:1. The Program will provide the Head Start Teaching Staff withmore T & TA assistance through the efficiency and expertise of aMentor Coach. The Mentor Coach will provide ongoingmonitoring and classroom observations, for better implementationof Lesson Plans. The Education Specialist will continue to conductCLASS Observations and monitor the outcomes of the TeachingStrategies Assessment Tool and share concerns with the Mentor23
Coach to assist in the areas of need and to support higher learningand child development in the classroom.2. The Program will continue to provide classrooms with more ageappropriate materials to execute activities on weekly Lesson Plansand the monthly Home Center Activities worksheet to strengthenthe child’s abilities to master the skills necessary to progress in thisdomain. The Home Center Activity will be a continual tool toprovide a means for parents to be engaged in their child’s HeadStart Learning experiences.3. School Readiness Goals for the next school year will be revisedwith more emphasis on the Birth to Five Head Start Early LearningOutcomes Framework, to meet the needs of the 3-year olds that willbe transitioning to the Pre-K classrooms as well as the 4-year oldsthat will be transitioning to Kindergarten. Weekly Lesson Planswill be revised using the new framework as well providingmeaningful learning activities to assist children in reaching thenecessary school readiness goals. All School Readiness Goals willbe incorporated into and implemented from the Weekly classroomLesson Plans to ensure that at least 80% or more of the childrenwill be able to reach their attainable the goals.Transition to Kindergarten24
Prior to spring our education personnel staff attended Pre-K CollaborativeMeetings monthly throughout the year where they were provided usefulinformation that helped our children and families to transition from Head Startto Kindergarten. To speed up the transitioning exercise our program invitedClayton County Public School staff to our monthly parent meetings, and also toconduct on-site registration.Our teaching staff used the KindergartenReadiness Skills template to prepare children for Kindergarten. Teaching staffalso visited some schools as part of the transition plan to allow children andfamilies to observe the kindergarten classrooms and ensure a smoothtransition.Children with disabilities went through the same plan but families attended endof the year IEP (Individualized Education Plan) meetings to discuss theirtransition process and plan. The on-site Speech Pathologist transferred files toeach child’s home school.25
COMMUNITY NEEDS ASSESSMENT UPDATE WITH SIGNIFICANT COMMUNITY CHANGESAccording to Southern Regional Medical Center Comm
Avenue center for 3 EHS classrooms and 2 staff offices 8,076.00, utilities 13,123.28, telephone 1,675.91, membership dues - 505.34, Parent services - 190.09, Parent