Transcription
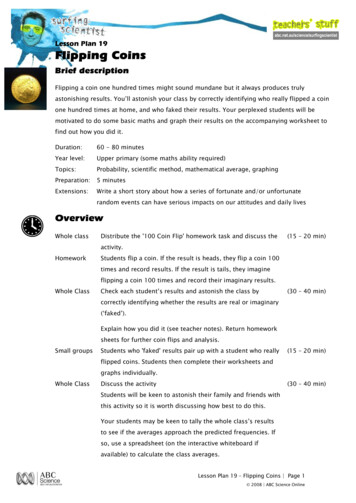
Lesson Plan 19Flipping CoinsBrief descriptionFlipping a coin one hundred times might sound mundane but it always produces trulyastonishing results. You‟ll astonish your class by correctly identifying who really flipped a coinone hundred times at home, and who faked their results. Your perplexed students will bemotivated to do some basic maths and graph their results on the accompanying worksheet tofind out how you did it.Duration:60 - 80 minutesYear level:Upper primary (some maths ability required)Topics:Probability, scientific method, mathematical average, graphingPreparation:5 minutesExtensions:Write a short story about how a series of fortunate and/or unfortunaterandom events can have serious impacts on our attitudes and daily livesOverviewWhole classDistribute the '100 Coin Flip' homework task and discuss the(15 – 20 min)activity.HomeworkStudents flip a coin. If the result is heads, they flip a coin 100times and record results. If the result is tails, they imagineflipping a coin 100 times and record their imaginary results.Whole ClassCheck each student‟s results and astonish the class by(30 – 40 min)correctly identifying whether the results are real or imaginary(„faked‟).Explain how you did it (see teacher notes). Return homeworksheets for further coin flips and analysis.Small groupsStudents who 'faked' results pair up with a student who really(15 – 20 min)flipped coins. Students then complete their worksheets andgraphs individually.Whole ClassDiscuss the activity(30 – 40 min)Students will be keen to astonish their family and friends withthis activity so it is worth discussing how best to do this.Your students may be keen to tally the whole class‟s resultsto see if the averages approach the predicted frequencies. Ifso, use a spreadsheet (on the interactive whiteboard ifavailable) to calculate the class averages.Lesson Plan 19 – Flipping Coins Page 12008 ABC Science Online
Materials and equipmentThese quantities are for 6 separate groupsTotal QuantityDescription30Student Worksheets3010 or 20 cent coinsPreparationPhotocopy sufficient quantity of student worksheets for whole class.This lesson requires the calculation of averages of data sets containing ten results. It isstrongly recommended that you read the student worksheet carefully before deciding whetheryou will use this lesson to teach or reinforce a prior lesson on how to calculate averages.Alternatively, you could calculate the averages of ten results on the whiteboard, or on aninteractive whiteboard for the students to copy onto their worksheets.ObjectivesScience skillsStudents will:Follow worksheet instructions to generate a series of one hundred coinflip results (Activity 1)Tally up clusters of consecutive heads or tails (Activity 2)Calculate average frequency of clusters from ten sets of one hundred coinflips (Activity 3)Graph the observed average frequency of clusters from ten sets of onehundred coin flips (Activity 4)Science conceptsSufficiently large numbers of independent, random events can containsurprising clustersThe frequency of clusters in a series with known probabilities can becalculated using mathematical rulesPositive attitudesStudents willDevelop an appreciation for statisticsRecognise the impact of sample size on the reliability of statisticsWork cooperatively with partners/group members when sharing resultsLesson Plan 19 – Flipping Coins Page 22008 ABC Science Online
ProcedureDay 1Distribute and discuss Homework Activity (5 – 10 min)Distribute the worksheet 'Homework Activity 1' and discuss.Demonstrate how students should flip their coin (toss a coin with your thumb so that itspins during flight - catch the coin in your palm, place it on top of your other hand toreveal the result)To speed up the process, students could ask a parent, guardian or sibling to record theresults on their 'Homework Task' worksheetDemonstrate how to generate the imaginary results by pretending to flip a coin (mimethe action, placing the pretend coin on top of your other hand to reveal the pretendresult)Emphasise that 'imaginary' data sets will be as important as the real resultsIt is worth admitting that you realise flipping a coin one hundred times is a fairlymundane task. To motivate students to complete the task carefully, tell them that theircombined results will reveal astonishing facts about the science of chance and randomevents in the next activity.Day 2Collect and discuss worksheets (15–20 min)Identifying real and imaginary results is incredibly easy. See Teacher Notes (page 5) for samplesof real and imaginary (fake) results. You will be able to tell the difference at a glance.Collect the Homework Activity worksheetsExamine each student‟s results and announce whether the data is real or imagined andask the student if your assessment is correct – repeat this for every student‟s dataYour students will be astonished by the accuracy of your assessments!Ask if anyone knows how you were able to tell real and imaginary results apartAsk two students to transcribe a set of imaginary results onto the whiteboard – onestudent calls out each result while the other places a tick in the heads or tails columnAsk two other students to transcribe a set of real results onto the whiteboardAsk students if they can see any clear difference between the two sets of resultsDiscuss how you were able to identify the real and imaginary results (see Teacher NotesPage 5)Lesson Plan 19 – Flipping Coins Page 32008 ABC Science Online
Procedure (continued)Distribute and discuss remaining worksheet pages (30 – 45 min)After distributing the remaining pages of the worksheet, discuss and demonstrate how tocomplete each activity. Alternatively, distribute one page of the worksheet at a time but beprepared for early finishers.Discuss worksheet 'Activity 2 – Analysis' and demonstrate how to tally up clusters usingthe real results transcribed on the whiteboard.Demonstrate how to calculate the results in the 'Check' column. Be prepared for earlyfinishers – you may need to discuss the next step individually with these students.When the majority of the class has finished 'Activity 2 – Analysis', discuss 'Activity 3 –Combine Results'. Each student will need to share their checked results with nine others.Demonstrate how to calculate Average Frequencies. You should decide in advancewhether students may use calculators or a spreadsheet for this step. Alternatively, youcould calculate the frequencies for ten sets of results on the interactive whiteboardusing a spreadsheet – students can then transcribe and use these results.Discuss the graph and demonstrate how to plot the observed results (ie next topredicted results on the graph).Class discussion (10 – 15 min)When all the students have finished plotting their results on the graph, lead a discussion aboutthe observed outcomes.Were they surprised how often long series of consecutive heads or tails appeared?Could these results teach us anything about life in the real world?Can you think of situations when a series of unrelated or independent random eventsmight make you feel lucky or unlucky?This discussion could lead into a creative writing task about the impact of chance eventson our daily lives and attitudes – a short story is provided as an example in the studentworksheetYour students will be keen to repeat the experiment and astonish their own test groupof people – they can easily do this by asking several family members to perform Activity1 while they are at school.Lesson Plan 19 – Flipping Coins Page 42008 ABC Science Online
Teacher’s notesSpot the difference!Spotting the difference between real and imaginary coin toss results is incredibly easy.To get a sense of how astonished your students will be by your ability to do this, takea close look at the two sets of results below. One of the sets is real, the other is fakedand these are very similar to those your students will present to you for inspection, butwhich is which? Can you see anything funny going on? Turn the page when you areready to find out how to determine the difference easily and quickly.Real and Imaginary HT 100 T 9303132333435363738394041424344454647484950 T 100 T Can you spot the difference here?Lesson Plan 19 – Flipping Coins Page 52008 ABC Science Online
How to spot the differenceYou should have noticed that the results on the left side of the page contain several very longruns of consecutive results. For instance, there were:Five consecutive heads from #4 to #8Seven consecutive heads from #43 to #49Six consecutive tails from #73 to #79These long runs seem so unlikely that most people would suspect this to be the fake resultsbut this is in fact the real set. The imaginary (fake) results on the right contain no more thanthree consecutive heads or tails in a row.You can differentiate real from fake results at a glance by simply looking for these long series(clusters) of consecutive heads or tails.Random doesn’t look so random!Most people find these long series of consecutive results much less likely than they really are. Astring of four heads starts looking like a pattern when in fact, there isn‟t one. A string of eightor nine will have a crowd looking for any cause other than random chance but in reality, thereis a very good chance that at least one of these long runs of consecutive results will appear ifyou continue flipping a coin long enough. In fact, you are almost guaranteed to see at least oneseries of six or more consecutive heads or tails in one hundred coin flips. This is why fakeresults are so easy to spot.We find this very surprising at first because we expect the outcome of consecutive coin tossesto alternate between heads and tails much more than they really do. We easily mistake longseries of consecutive results, or clusters, as patterns when they are in fact truly random. To theuntrained eye, this makes random results appear to be 'fake', and fake results seem more 'real'.Independent, random eventsOur intuition about independent, random events like coin flips does not match reality becausewe rarely look at large enough samples. We expect the 50/50 rule to apply on much shortertime scales than it really does. In reality, the 50/50 rule takes much longer to surface. As aresult, we can easily suspect a long series of consecutive independent or unrelated events to besignificant when they are in fact inherent and quite natural. Public health and safety officialstherefore rely heavily on statistics in order to separate natural variations in population healthfrom those with specific and preventable causes.Lesson Plan 19 – Flipping Coins Page 62008 ABC Science Online
Calculating probabilityA simple diagram like the one below can be used to calculate the probability of anyoutcome. The sum of the probabilities of all possible outcomes for a random eventmust always add to 1. For a coin flip, there are two possible outcomes, either heads ortails. So if the coin is unbiased, and the coin flipping technique is also unbiased, thenthe probabilities are exactly half and half (½ or 0.5 or 50%).So, using the diagram, there are four possible outcomes on the second flip. Theprobability of getting HH on the second flip is ¼ (or 0.25). The probability of HT, TH,or TT are all also ¼. The probability of HHH on the third flip is 1/8 (or 0.125) and HHHHon the fourth is 1/16 (or 0.0625).H1st FlipHH2nd Flip3rd Flip4th TTTTTTTTTHTTTTTHTTHTTHHTTHTTHHTHHHTHHTTHTTHTHTHTTA faster way to calculate the probability of an outcome after any number of flips is tomultiply the probabilities of all the outcomes together. So the probability of HH is ½ ½ ¼. The probability of HHH is ½ ½ ½ 1/8 and of HHHH is ½ ½ ½ ½ 1/16.Calculating the probabilities and expected frequencies of clusters is beyond the scopeof primary school mathematics but students should be able to grasp the concept oftheir expected frequency and notice that their combined results match thesepredictions almost perfectly.The expected frequencies for each cluster size are provided in Table 5 in the StudentWorksheet. Each frequency in the table represents the average number of times youwould expect to see these clusters in a large number of sets of results from onehundred coin flips.Lesson Plan 19 – Flipping Coins Page 72008 ABC Science Online
Expected resultsThe table below contains ten sets of real results. The averages calculated in the table areplotted in pink on the graph JaneSuzie2HeadsBradClusterSizeMy 25ObservedAverage Frequencyfrequency201510512345678910Cluster Size(Number of consecutive heads and consecutive tails)Lesson Plan 19 – Flipping Coins Page 82008 ABC Science Online
Probability in the real worldThe Gambler’s FallacyThe Gambler‟s Fallacy is explained in the student worksheet. It arises when we know theprevious results of a series of random events like coin flips. Because we expect the 50/50 ruleto appear sooner or later, we incorrectly assume that the probability of getting either heads ortails changes over time. After a long series of heads, many people assume that the probabilityof tails on the next flip is higher than ½. In reality, the probability of tails is still exactly ½ everytime we flip the coin, no matter how many heads preceded it.This fallacy can obviously get gamblers into very serious trouble. To make matters worse, theodds of casino games are stacked slightly against the gambler (eg the inclusion of a green zeroon roulette wheels stacks the odds of black/red, or odd/even slightly in favour of the casino –even though every result is independent of the last and truly random, the green zeroguarantees the casino will take more winnings than the gambler given sufficient time).A second problem in addition to the Gambler‟s Fallacy is the tendency to remember large winsand to forget small losses even though those small losses may add up to be significantly higherin value than the occasional large wins.“Littlewood’s Law of Miracles”Renowned University of Cambridge mathematician John Littlewood once famously calculatedthe expected natural frequency of strange coincidences. He defined a 'miracle' as being a onein a million event we might believe to be so unlikely that we deem it to have 'real significance'.He assumes we hear, see and think things at a rate of roughly one per second. In an eight hourday, we experience around 30,000 such 'events' (60 seconds 60 minutes 8 hours 28,800). At this rate, we experience around one million 'events' per 30 day month (864,000 tobe precise). Most of these events are so mundane or expected that pass by unnoticed. Butevery now and then we experience some strange coincidence eg you‟re thinking about an oldfriend seconds before they call, or a song you‟re humming comes on the radio.A series of fortuitous events might make you feel especially lucky eg ten traffic lights turngreen as you approach, each giving you a clear run to an important appointment for which youare running late, followed by a parking space 'magically' opening up just as you arrive. Lessfortunate ones could make you feel 'cursed', such as ten red lights, no parking spaces withinten blocks for an appointment, followed by a toothache and an expensive parking ticket.If we agree that events with probabilities around one in a million could be called 'miracles', thenwe could expect one such 'miracle' around once per month. While 'Littlewood‟s Law of Miracles'shines some light on their statistical probability, it shouldn‟t diminish our enjoyment of thosepleasant, quirky coincidences. It could however, help anyone who endures three or moreunfortunate events in succession to stay positive and motivated, rather than sink into milddepression or suffer unwarranted anxieties.Lesson Plan 19 – Flipping Coins Page 92008 ABC Science Online
Activity 1 - HomeworkTable 1 – One Hundred Coin FlipsNameTossing a coin always results in either heads ortails but never both. No surprises there! Butsomething very strange lurks beyond thissimple fact. To find it, you’d need to flip a cointhousands of times. That would take ages butby contributing just one hundred results each,your class can discover this quirky fact ofnature 2621363Step 11464Flip a coin. Do not record your result.156516661767186819692070under TAILS in step 2.21712272Step 3484358536863787388839894090419142924393If the result is heads, follow the instructionsunder HEADS in Step 2.If the result is tails, follow the instructionsComplete the table on this page by flipping acoin one hundred times. For each toss, place atick in the H column if you flipped heads or theT column if you flipped tails.Please do not make any marks in the lastcolumn. You will use the A column for analysisin the next class activity.TAILSComplete the table on this page by pretendingto flip a coin one hundred times. There is no'right' or 'wrong' way to do this. Just record theresult you would expect each time.For each imaginary toss, mime the action oftossing and catching the coin. Then place a tickin the H column or in the T column.4494Please do not make any marks in the last4595column. You will use the A column for analysis4696in the next class activity.479748982008 ABC ScienceOnline499950100HTA
Activity 2 – AnalysisHow did your teacher know whose results were real and whose werefaked? As you discovered, it was actually very easy! Flipping a coinrepeatedly usually results in surprisingly long sets of heads or tails.These consecutive results are called clusters and they are much morecommon than we expect. In this activity, you will count the number ofdifferent sized clusters in your results.Table 2 – TotalsHeadsTailsStep 1 – Count the totalsFirst, count the total number of Heads and Tails you flipped. Record your#Hresults in Table 2.1 2Step 2 – Circle the clusters3Draw circles around consecutive groups of ticks (clusters) in Table 1 as568Count the number of ticks in each cluster and write this number in9column A. For example, write the number 1 in column A for single ticks.10Write the number 2 in column A for two consecutive ticks. Write the11number 3 in column A for clusters of three ticks, and so on.Count the number of single ticks you circled and write in column A.16Record this total row 1 of the Frequency column in Table 4. Next, countthe number of circles containing two ticks in column A. Record this15171819number in row 2 of the Frequency Column. Continue counting thenumber of circles (clusters) containing 3, 4, 5 and up to 10 ticks until youhave completed Table 2.2112 1314 42112Circle and count thecrosses in each clusterlike thisStep 5 – Check your resultsTable 3– Cluster FrequencyFrequency 12Step 4 – Count the clustersClusterSize 7Step 3 – Count the ticks in each clusterA3 4illustrated. Be sure to group consecutive results for flip #50 and flip #51.TCheck columnThis step will help you check that youcounted all the ticks and tallied all the1 1 clusters correctly.2 2 For each row, multiply the number in3 3 indicated in the „Check‟ column.4 4 5 5 6 6 7 7 clusters.8 8 If your „Check total‟ is not 100, you9 9 10Check total 10 the „Frequency‟ column by the numberFinally, add all the numbers in thecheck column and write the result nextto „Check total‟. If your result is 100,you have correctly counted all themade a mistake in Step 3 but don‟tworry! Just go back to Step 3 and tallythe clusters again until you‟ve foundthe problem.2008 ABC Science Online
Activity 3 – Combine ResultsNow that you have counted the clusters you recorded, it’s time to share your results. Thiswill increase your sample from one hundred results to one thousand results. Yourcombined results will reveal just how common those unexpectedly long clusters really are.Step 1 – Copy your resultsTranscribe your results from Tables 2 and 3 into the column labelled 'My Results' in Table 4 below.Step 2 – Share resultsShare your results with nine other students. Write each person‟s name at the top of the remainingcolumns in Table 4. Then copy their totals from Table 2 into the first two rows, and their results fromTable 3 in the rows labelled 1 to 10.Step 3 – Average resultsAdd all the numbers in the Total Heads row and write the answer in your science journal. To calculatethe average number of heads observed in all 1000 results, simply divide this number by 10. Recordthe result in the average column. Repeat for the Total Heads row.Next, calculate the average frequency of each cluster size observed in your set of data. Again, simplyadd all ten numbers in each row and divide the total by 10. Write these results in the Average column.Table 4 – Combining 1000 ResultsTotalHeadsTotalTails123456789102008 ABC Science Online109876543Average2ClusterSize1 My ResultsFrequency
Activity 4 – Surprisingly PredictableThe probability of getting heads or tails on a fair toss are exactly equal. So we can write theprobability of heads or tails as ½ (or 0.5). The probability of getting two heads in a row is ½ ½ ¼ (or 0.25). The probability of getting three heads in a row is ½ ½ ½ 1/8 and so on. Usingthese rules, mathematicians can calculate the expected frequency of any series of consecutiveresults. The expected frequencies results for 100 coin flips are provided in Table 5 below.Table 5 – Expected Cluster Frequencies for 100 Coin FlipsCluster 60.780.390.190.100.05This table tells you that if you flip a coin 100 times, you should expect to see 25 single (non-consecutive)results. You should also expect 12.5 pairs of consecutive heads or tails, 6.25 triples etc.Remember that real clusters are counted in whole numbers (integers) but their average frequency can be afraction.Step 1 – Comparing your resultsPlot your results from the Average column in Table 3 on the graph below. Use the blank space to theright of each grey bar for each cluster size.How closely did the average results of your combined results (representing 1000 coin flips) match theexpected average frequencies of each cluster size?Do you think the results would match more closely if you combined even more results?
Random doesn’t look randomIn this activity, you discovered that random results don‟t really look like random results to theuntrained eye. Most people are surprised to see five or six consecutive heads or tails in a row but inreality, these clusters are actually quite common. Our intuition about independent, random eventsdoes not match reality very well.Everybody knows the probability of getting heads or tails when you flip a coin are exactly equal. So, ina series of one hundred coin flips, we would expect to see fifty heads and fifty tails. This is whatpeople mean when they say fifty, fifty.For one hundred coin flips, fifty/fifty is roughly what you get but we‟re not too surprised by resultslike 42/58. The problem is that we expect the 50/50 rule to apply on much shorter time scales than itactually does.For ten coin flips, most people expect around five heads and five tails. But you know now that resultslike seven heads and three tails are not unusual. Such results wouldn‟t bother you much unless therewas something riding on the outcome. When there is something valuable at stake however, we caneasily fall into a trap called “The Gambler‟s Fallacy”.The Gambler’s Fallacyfallacynoun, plural fallacies.1. a deceptive, misleading, or false notion, belief, etc.: a popular fallacy.2. a misleading or unsound argument.3. deceptive, misleading, or false nature.4. Logic any of various types of erroneous reasoning that render arguments logically unsound.5. Obsolete deception.(From Macquarie Dictionary)The Gambler‟s Fallacy is an incorrect belief about the probability of independent random events suchas coin flips. We all know the probability of heads is always exactly half, every time you flip a fair coin.The problem arises after a series of three or more heads because we expect the fifty/fifty rule toappear. As a result, we assume that the probability of tails on the next flip must be greater thanfifty/fifty. In reality, the probability of tails is still exactly the same no matter how many headspreceded a flip. Even after ten consecutive heads, the probability of tails on the next flip is still fiftyper cent!Over hundreds of consecutive flips, the fifty/fifty rule holds true but you can never predict theoutcome of an individual flip.A coin toss doesn‟t mean very much unless we have something riding on the outcome. When there issomething valuable at stake however, we can easily become very sensitive about the result. If severalrandom events go the wrong way, we might start feeling „unlucky‟ or become depressed. In somesituations, this can even make us start feeling suspicious or acting completely out of character. To see howeasily this could happen, imagine how you would feel in the following situation:
A Random StoryOne day, you invite a new friend home from school. You walk and chat and stop for a rest inthe park on the way. As you turn the last corner into your street, you both spot something small andshiny lying on the footpath right in front of your house. You race to see what it could be lying thereon the grass. You arrive together to discover that the shiny object is a very expensive looking sportswatch. It has five separate dials controlling all kinds of high-tech functions including GPS, a depthgauge, timers, alarms and even a heart monitor! The shiny stainless steel wrist band is made ofhundreds of intricate, inter-connecting links. It‟s by far the most amazing watch you have ever seen.You pick it up and hurry to your room, close the door and start investigating how all thebuttons work together. The watch beeps and the display changes. The light button illuminates thedial in a cool blue-green glow. Your mother brings you a sandwich and a glass of milk and asks tosee what you‟ve got. She takes a long look at the watch and realising how precious it, decides youshould take it to the police. She drives you and your friend to the local station straight away.The police officer asks lots of questions. Where did you find it? At what time? Was thereanything else nearby? She completes an official form, records both your names and commends youfor your honesty. Then she offers you both a little ray of hope. Judging by the brand, she says shewouldn‟t be surprised if the owner gave you a reward for returning the watch.After three months, the officer calls and invites you to the station with your parents. Nobodyhas collected the watch! To your surprise, your friend is there too. The officer asks who will besigning for the watch. You look at each other and shrug.“Well, I saw it first”, your friend says.“No you didn‟t, we found it together!”, you reply. “And anyway, we found it at my house”, youhasten to add. But the policewoman says where you found it makes no difference at all. Seeing yourdilemma, she suggests you should toss a coin to decide who will keep the watch. It‟s the only fairway to decide. Your heart starts to race. Your eyes meet your friend‟s and suddenly, you don‟t likesuch good friends anymore. Your friend‟s dad takes a coin out from his pocket.“Here, best of three”, he says, handing you the coin. Your flip flies high in the air, the coin is ablur.“Heads”, your friend calls. Blast! It‟s heads. You flip again.“Heads!”, your friend calls again. The coin seems to hover forever. You‟re already one downand it‟s the best watch you‟ve ever seen. It just has to be tails this time! You slap the coin on yourwrist and slowly lift your hand but you can‟t believe your eyes. Heads again!“Well that settles it, I guess?”, the policewoman says. Your face turns bright red and everyonecan tell how disappointed you are. But while your friend‟s dad is signing the release form, youdecide to toss the coin again out of sheer frustration. Heads again. That‟s odd, you think so youtoss it again and this time, you really can‟t believe your eyes. Heads again! That‟s four in a row. Youflip it once more to be sure. Heads again!!!“Hey!”, you exclaim. “This coin is rigged!” Everyone turns to look at you.“I just flipped this coin three more times. That‟s five heads in a row. I want a rematch. Youcheated!”Your friend‟s father asks for the coin and flips it. Tails!“You‟re cheating! I want a new coin”, you protest. The police officer asks for the coin and flipsit three times but says nothing. She just gives you a look that makes you sink. It‟s half pity, halfdisappointment. Your mum has exactly the same expression on her face.“But it‟s true. I got five heads in a row! That‟s impossible. Try it again!” This time, the policeofficer just gives you a sad looking smile and hands the coin back to your friend‟s father. He slipsthe coin back in his pocket and you watch it disappear. Now you‟ll never be able prove the coin wasa fake or was it?2008 ABC Science Online
2008 ABC Science Online Lesson Plan 19 Flipping Coins Brief description Flipping a coin one hundred

