Transcription
Industrial InstrumentationAn IntroductionAN OVERVIEW OF INDUSTRIAL MEASUREMENT AND CONTROL SYSTEMSLevel 1Bryon Lewis
INDUSTRIAL MEASUREMENT AND CONTROL SYSTEMSLevel 1IntroductionThis course will introduce the methods to apply instrumentation andcontrol for use in industrial processes. It will show the proper way toinstall and calibrate basic instruments, as well as the use of controllers,control modes, and control loops.Industrial instrumentation employees the use of applied physics to monitorand regulate processes. Instrumentation can be found in any number ofthe following industries, gas and petrochemical, food processing,pharmacutical, paper and pulp, waste water and water treatment plantsare just a few examples.ObjectivesThe objectives of this course will be as follows 1. Read P&IDs (process and instrumentation diagrams).2. Read instrument loop diagrams.3. To be able to install and calibrate basic instruments.4. Apply basic instrumentation to control an industrial process.5. Apply simple design of control loops used in processes.6. Understand feedback, feedfoward, cascade and ratio control.Industrial InstrumentationLevel 1 – 20021Bryon Lewisall rights reserved
INDUSTRIAL MEASUREMENT AND CONTROL SYSTEMSPart 1 Course Objectives – Basic Instruments1. Instrumentation Symbols and Terminologya. Symbols, nomenclature and usageb. P&IDs, Mechanical Flow Diagramsc. Loop Diagrams2. Basic Measurementsa. Basic Conceptsi. Standard signals used in instrumentationii. Instrument ranging and limitationiii. Span, Upper range value and Lower range valueiv. Constant current and constant voltagev. Static equilibrium in instrument measurementsvi. Open systemsvii. Closed systemsb. Pressure measurementsi. Static pressure and Head measurementsii. Differential pressure and Head measurementsiii. Vacuum measurementsiv. Calibrationc.Level measurementsi. Wet Legsii. Suppressing the Zeroiii. Elevating the Zerod. Temperature measurementsi. Thermocouples1. J type, K type, E type, T type (most commonly used)ii. RTD (resistance temperature detectors)1. 100 ohm platinum (most commonly used)2. Bridge measurement application3. Constant current measurement applicationiii. Capillary tubes and thermometerse. Flow and Mass Flow measurementsi. Differential pressure and Head to measure flowii. Meter Types1. Magnetic2. Orifice3. Venturi4. Vortex5. Turbineiii. Mass Flow measurement1. Electrical and Mechanical2. Pressure Delta Pressure Temperature3. Mass flow is proportional to Force measured3. Open discussions of applications and experiencesIndustrial InstrumentationLevel 1 – 20022Bryon Lewisall rights reserved
INDUSTRIAL MEASUREMENT AND CONTROL SYSTEMSPart 2 Course Objectives – Process Control1. Controla.b.c.d.e.f.loopsPrinciples of operation and terminologyOpen loop controlClosed loop controlSingle loop controlsCascade controls (outer and inter loop)Wiring of instruments and controllers2. Control Modesg. PID control modesi. Proportional control modeii. Integral control modeiii. Derivative control modeiv. Application of the three types of control modesh. Differential Gap Controli. Split Range Controlj. Time Proportioning Control3. Final Correctionk. Valvesi.ii.iii.l. Pumpsi.ii.iii.DevicesType of valvesValve terminology, trim, and characterizationApplications of equal percentage, linear and quick opening valesTypesApplicationsControl and interlocking to process controller1. Alarms2. Starting and stopping3. Shutdown systems4. Applications of measurement, process control and P&IDs5. Open discussions of applications and experiencesEnd of CourseIndustrial InstrumentationLevel 1 – 20023Bryon Lewisall rights reserved
Section 1 – Basic InstrumentsLoop Diagram Symbols and P&IDsP&IDs AND LOOP DIAGRAMSP&IDs and loop diagrams are construction anddocumentation drawings that depict the flowoftheprocessandillustratetheinstrumentation control and measurementinteractions, wiring and connections to theprocess. The process is illustrated in sectionsor subsystems of the process called loops. Aloop diagram will detail the connections ofpneumatics and wiring from the field devicethrough any junction boxes or marshallingcabinet to the controller or computer interfacewhich controls the process a single loop or acascade loop of the process.This section will focus on the standardsymbols, identification tags and terminologyused in the industry.In the areas of engineering, design, drafting,installation and maintenance of an industrialinstrumentation and control system, a solidunderstanding of the symbols and terminologyused to depict the process system is required.This course will use the ISA/ANSI standards shown in this section for all process illustrations.ISA (International Society of Automation) / ANSI (American National Standards Institute).Instrument line symbolsALL INSTRUMENT LINES ARE TO BE DRAWN FINE IN RELATION TO THE PROCESS PIPING LINES.Common connecting linesConnection to process, or instrumentsupply:Pneumatic signal:Electric signal:Capillary tubing (filled system):Hydraulic signal:Electromagnetic or sonic signal(guided):Internal system link(software or data link):Source: Data from ISA S5.1 standardIndustrial InstrumentationLevel 1 – 20024Bryon Lewisall rights reserved
Section 1 – Basic InstrumentsLoop Diagram Symbols and P&IDsTagging nomenclatureThe following table illustrates standard tagging to use for instrument identification.P&ID TAG L TAG NUMBERInstrument Identification or Tag NumberLoop IdentificationLoop numberFunction IdentificationFirst Letter (measured variable – see table 2)Succeeding Letters (modifier, readout or function)EXPANDED TAG NUMBER- Tag Number- Option Prefix- Option SuffixNote: Hyphens are optional as separatorsThe top of the tag will identify the instrument type and the bottom will identify the loop number. Referto tagging nomenclature tables above. Remember the loop number is just a section or sub system of theprocess.General instrument or function symbolsPrimary locationaccessible tooperatorField mountedAuxiliary locationaccessible tooperatorDiscreteinstrumentsShareddisplay,shared controlComputerfunctionProgrammablelogic control1. Symbol size may vary according to the user's needs and the type of document.2. Abbreviations of the user's choice may be used when necessary to specify location.3. Inaccessible (behind the panel) devices may be depicted using the same symbol but witha dashed horizontal bar.Source: Data from ISA S5.1 standardIndustrial InstrumentationLevel 1 – 20025Bryon Lewisall rights reserved
Section 1 – Basic InstrumentsLoop Diagram Symbols and P&IDsThe table below shows the recommended tag identification letters for instruments and control elementdesignations used in P&IDs and Loop Diagrams.Identification lettersFirst letterMeasured orinitiating variableSucceeding lettersModifierReadout orpassive functionAAnalysisAlarmBBurner, combustionUser's choiceCUser's choiceD User's choiceEVoltageFFlow rateOutputfunctionModifierUser's choiceUser's choiceControlDifferentialSensor (primaryelement)Ration(fraction)G User's choiceGlass, viewing deviceH HandHighICurrent (electrical)JPowerScanKTime, time scheduleTime rate ofchangeLLevelM User's choiceIndicationControl stationLightLowMiddle,intermediateMomentaryN User's choiceUser's choiceO User's choiceOrifice, restrictionPPoint (testconnection)Pressure, vacuumQ QuantitySpeed, frequencyTTemperatureRecordSafetySwitchTransmitU MultivariableVUser's choiceIntegrate,totalizerR RadiationSUser's choiceMultifunctionVibration, mechanicalanalysisMultifunctionMultifunctionValve, damper,louverW Weight, forceWellXUnclassifiedX axisUnclassifiedUnclassifiedUnclassifiedYEvent, state, orpresenceY axisRelay, compute,convertZPosition, dimensionZ axisDriver, actuatorSource: Data from ISA S5.1 standardIndustrial InstrumentationLevel 1 – 20026Bryon Lewisall rights reserved
Industrial InstrumentationLevel 1 – 20027Bryon Lewisall rights atureTDRTRSRRRQRPDRPRGauging HLBSHLASHLCombZSLYSLZDSH ZDSLZSHYSHZSHLWDSH WDSL WDSHLWSHVSHTDSH TDSLTSHSSHRSHQSHPDSH PDSLPSHLSHKSHJSHISHFFSH FFSLFQSH FQSLFSHESHBSHASHLowSwitches andAlarm DevicesRecording Indicating CKCHCFFCFCECBCACValvesReadout onDifferentialPRCPressure\VacuumUser' ChoiceUser' ChoiceUser' ser' ChoiceFQRCFlow RatioFRCFlow QuantityERCVoltageFlow RateUser' ChoiceUser' ChoiceARCAnalysisBurner/combustionMeasured Variable Recording Indicating ording Indicating lement Point ProbeComputing Primary VFQVFVEZBZAVDevices ElementSafetyElements and Final Correction DevicesSection 1 – Basic InstrumentsLoop Diagram Symbols and P&IDs
Section 1 – Basic InstrumentsIndustrial InstrumentationLevel 1 – 2002MECHANICAL FLOW (simplified diagram)P&ID (process and instrumentation diagram)Loop Diagram Symbols and P&IDs8Bryon Lewisall rights reserved
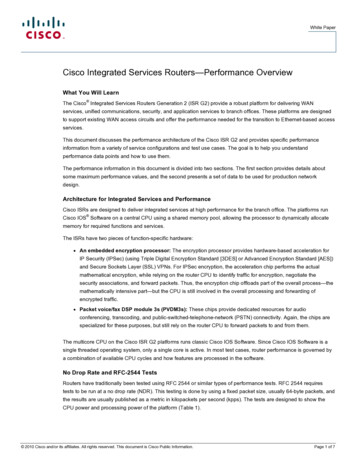
Section 1 – Basic InstrumentsLoop Diagram Symbols and P&IDsBlow-up of the P&IDThis P&ID diagram illustrates the use of software data links between controllers. These controllerscommunicate over a communications bus and pass variables back and forth between the IOP (inputoutput processor) sections of the DCS. The communications processor will then put the information inmemory for the control blocks of the program to use. Some controllers can use Ethernet or Field Bus tocommunicate and pass the process variables back and forth. If the controllers are in the software of thesame DCS (distributed control system) IOP or in the same SCADA (supervisory control and dataacquisition) system RTU (remote terminal unit) or in a stand alone PLC (programmable logic controller)the control variables would be passed in memory.Industrial InstrumentationLevel 1 – 20029Bryon Lewisall rights reserved
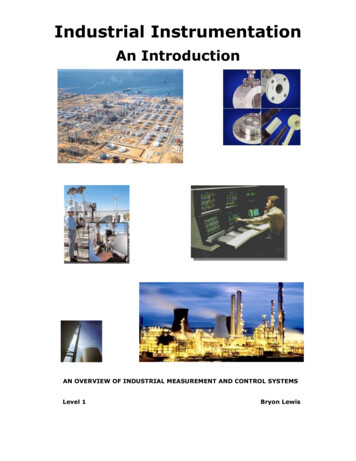
Section 1 – Basic InstrumentsLoop Diagram Symbols and P&IDsLoop DiagramThis Loop diagram illustrates flow loop FT-100 from field to PLC controller and the display.Industrial InstrumentationLevel 1 – 200210Bryon Lewisall rights reserved
Section 2 – Basic InstrumentsMeasurements and Calibration ProceduresStandard process signalsIndustrial processes use standards for the measurement and control signals used throughout allindustries. The signals used in industrial instrumentation are unique. Processes are referred to ormeasured as 0% to 100% of the process range. These signals also typically employee a live zero for 0%of process measurement.A live zero gives insight as to if the process loop is functioning within given parameters or if the controlloop is open or malfunctioning. If the loop is functioning in a proper manor, the signal will indicate ameasurement greater than zero for 0% percent of process. There is also a measurement greater thanzero for 100% percent of the process. For example if the process was using a signal of 3 PSI to 15 PSI,the range of the process is 3 to 15 PSI.In the representation of the process, 3 PSI represents 0% of the process and 15 PSI represents 100% ofthe process. The span of the process is 12 PSI. The span is where the process takes place in a range ofmeasurement.Upper Range Value (URV) – Lower Range Value (LRV) SpanSPAN-25%0%0 psi3 psi100%15 psiRANGEIt can be seen from the chart above that if the process signal equaled 0 PSI or –25%, the loop is openor malfunctioning. This is a great advantage in industrial measurement for the troubleshooting of theprocess loop and identification and elimination of elements that are not associated with the source of theproblem.The chart below shows some of the various standard signals used for industrial instrumentation.MeasurementSensorPV / MVPV / MVmV (millivolts)V (volts)mA (milliamperes)in H20PSIkPa0 -1000-10200-1000-1001-54-200-1010-50Industrial InstrumentationLevel 1 – 20023-1520-100116-30Bryon Lewisall rights reserved
Section 2 – Basic InstrumentsConstant voltage and constant current signalsIndustrial electrical control signals are typically constant current or constant voltage. These signals obeyohm’s law but are not the same as a resister connected in series or parallel with the voltage supply.Ohm’s Law E I x RWith a constant current control device one or more resistive loads may be connected in series withthe control device. The current flowing through the circuit will remain at a constant value of currenteven if the resistance of one or more of the resistive loads is varied at any period of time or frequency.Ohm’s law still applies to this type of circuit. The voltage supply of the circuit must be equal to orgreater than the sum of all maximum resistances in the circuit in ohms multiplied by the maximumcurrent of the circuit in amperes.[20mA x (Rwire Rdevice1 Rdevice2 Rn ] Vs (power supply voltage)2501% PrecisionWireConstant CurrentControl PVDevice - 4-20mA -CurrentMeter-PowerSupply 24 VDC2501% PrecisionNotice the 1% precision resistors. The resistor will produce a 1-5 volt signal for the recorder andcontroller to read as input. (4mA x 250Ω 1v, 20mA x 250Ω 5v)With a constant voltage control device one or more resistive loads may be connected in parallel withthe control device. The applied voltage across the resistances throughout the circuit will remain at aconstant value of voltage even if the resistance of one or more of the resistive loads is varied at anyperiod of time or frequency. Ohm’s law still applies to this type of circuit. The voltage supply of thecircuit must be equal to or greater than the sum of all maximum resistances in the circuit in ohmsmultiplied by the maximum current of the circuit in amperes.[20mA x {1/(1/Rwire 1/Rdevice1 1/Rdevice2 1/Rn )}] Vs (power supply voltage)WireWire -VoltVoltMeterMeter --WireWire 1-5V1-5V-DeviceDevice-- WireWire PVPV--- Device --PowerPowerSupplySupply 24 24 VDCVDC- WireWireNotice the devices and the voltmeter are in parallel. The transmitter is sending a low power outputconstant voltage signal typically 1-5 volt. Notice the wire resistance. The devices must be kept close aspossible not to produce significant error due to voltage drop.Industrial InstrumentationLevel 1 – 200212Bryon Lewisall rights reserved
Section 2 – Basic InstrumentsStatic equilibrium in instrument measurementsMost industrial instrument measuring devices use static equilibrium to measure the error in the process.The error is the difference between the setpoint (SP), the desired value of the process, and the processvariable (PV), the actual value of the process.The sum of forces must equal zero to be in static equilibrium (ΣF 0). Most mechanical instrumentscan be thought of as a balance beam.F1 – F2 0Static equilibrium – no errorF1 – F2 0An error exists in the processF1 represents the setpoint (SP) and F2 represents the process variable (PV). When the sum of thesetpoint and the process variables equal zero (SP – PV 0), the measuring instrument is in staticequilibrium. This applies to the controller as well. When the error is zero SP – PV E (error), the processis said to be at steady state. It is exactly where it should be, but in the real world this is extremely hardto achieve. There are constantly disturbances on the system and this is why constant monitoring of theprocess needed. With constant monitoring and correction of the process, the process can be regulatedwith extremely little or negligible error. The desired process value will be exactly what it should be withinthe tolerances of the system and it’s components.Open and closed systemsIndustrial processes use tanks, device and instruments that are referred to as open and closed systems.These are not to be confused with open and closed control loops.The following examples illustrate the application of open and closed systems. Take a look at the opensystems first, then the closed system. Both level transmitters are in static equilibrium when the tanks areempty. The same applies to flow transmitters. We can measure the unbalanced pressure when a fluid isflowing in the pipes or a level exists in the tanks. This method reveals the energy in the system, storedor kinetic.ONLY THE (HEAD) PRESSURE IS MEASURED IN THE TANKS USING STATIC EQUILIBRIUMCLOSED TOATMOSPHERE30 PSI–30 PSI 0 P 0OPEN TOATMOSPHERE P 0 (HEAD) PRESSURE IS USED FOR FLOW RATE AND STATIC PRESSURE USING STATIC EQUILIBRIUM P THE SQUARE OFTHE PROCESSFLUID’S VELOCITY P THE PROCESSSTATIC PRESSURELOW SIDE IS OPEN TOATMOSPHERECLOSED SYSTEMSIndustrial InstrumentationLevel 1 – 200213OPEN SYSTEMSBryon Lewisall rights reserved
Section 2 – Basic InstrumentsPressure measurementsThe most common measurement used in most industrial processes is pressure. The pressuremeasurement can be used to measure flow, level, mass, weight, and work. This type of measurement isan inferred measurement. An inferred measurement is proportional to the potential and kinetic energy inthe system.By first learning methods to measure pressure, then temperature and then differential pressure, itpossible to control about any type of industrial process.The illustration to left is a simple pressuremeter. It uses a voltage divider to output avoltage that is proportional to the processpressure. At the 50% position it is in staticequilibrium and the voltage out is equal to 0volts. At the 0% position the voltage is equal to–5 volts. At the 100% position the voltage isequal to 5 volts. This design will indicate if thepressure is positive or negative. Pressure istypically referred to as a positive measurementbut not always.Potentiometric Pressure TransducerThe following illustration is of the bourdon tube design. This design is a very popular design for use inpressure gauges.Bourdon Tube DesignsThe following illustration is of sealed diaphragms. This method is very popular in the design of pressuretransducers for process measurement.Pressure Sensor Diaphragm DesignsSection 2 – Basic InstrumentsIndustrial InstrumentationLevel 1 – 200214Bryon Lewisall rights reserved
Pressure measurementsThe following example is of a strain gauge typemeasurement.Incorporating the diaphragmshown previously and sandwiching a strain gaugein between the two diaphragms it produces asensor capable of measuring differential pressure.Notice the high and low sides of the transducer.The high side is designed to withstand a muchhigher pressure than the low side of the transducerto protect the sensor.Strain-Gage Based Pressure CellThis design is the technology behind theRosemount Omega cell differential pressuretransducer. When the transducer is mounted in ahousing complete with signal transmitting andconditioning electronics it is called a transmitter.The pressure transmitter typically conditions thepressure signal and converts the signal to a 1-5volt or the very popular and most widely used 420 milliamp signal. As discussed earlier in thisbook, the 4-20 mA signal does not vary withchange in resistance of wire or resistance of seriescomponents. Later on this book the we willcontinue this discussion of signals and ohm’s lawapplied to signal limitations.Capacitance-Based Pressure CellThe following table illustrates typical pressure ranges for various pressure transducers. Consult themanufacture’s technical data for actual ranging capabilities and limitation of the instrument for theapplication of the process.This range table is onlyoffered as a guideline.Consult manufacturer.Electronic Pressure Sensor RangesIndustrial InstrumentationLevel 1 – 200215Bryon Lewisall rights reserved
Section 2 – Basic InstrumentsIntroduction to Pressure measurements with Flow and Level applicationsThe most common measurement used in most industrial processes is pressure. The pressuremeasurement can be used to measure flow, level, mass, weight, and work. This type ofmeasurement is an inferred measurement. An inferred measurement is proportional to thepotential and kinetic energy in the system.By first learning the methods to measure pressure, differential pressure, and temperature it ispossible to control about any type of industrial process.Example of a Static Pressure TransducerMeasuring the flow of liquids is a critical need in many industrial plants. In some operations, the abilityto conduct accurate flow measurements is so important that it can make the difference between makinga profit or taking a loss.With most liquid flow measurement instruments, the flow rate is determined inferentially by measuringthe liquid's velocity or the change in kinetic energy. Bernoulli determined that an increase in the velocityof a flowing fluid increases its kinetic energy while decreasing its static energy. It is for this reason thata flow restriction causes an increase in the flowing velocity and also causes a drop in the static pressureof the flowing fluid.Velocity depends on the pressure differential that is forcing the liquid through a pipe or conduit. Becausethe pipe's cross-sectional area is known and remains constant, the average velocity is an indication ofthe flow rate. The basic relationship for determining the liquid's flow rate in such cases is: Q V x ALaminar and turbulent flow are two types normallyencountered in liquid flow Measurement operations. Mostapplications involve turbulent flow with R values above3000. Viscous liquids usually exhibit laminar flow with Rvalues below 2000. The transition zone between the twolevels may be either laminar or turbulent.The flow rate and the specific gravity are the inertiaforces, and the pipe diameter and viscosity are the dragforces. The pipe diameter and the specific gravity remainconstant for most liquid applications.Industrial InstrumentationLevel 1 – 200216Bryon Lewisall rights reserved
Section 2 – Basic InstrumentsFlow measurementsMeasuring the flow of liquids is a critical need in many industrial plants. In some operations, the abilityto conduct accurate flow measurements is so important that it can make the difference between makinga profit or taking a loss.With most liquid flow measurement instruments, the flow rate is determined inferentially by measuringthe liquid's velocity or the change in kinetic energy. Bernoulli determined that an increase in the velocityof a flowing fluid increases its kinetic energy while decreasing its static energy. It is for this reason thata flow restriction causes an increase in the flowing velocity and also causes a drop in the static pressureof the flowing fluid.Velocity depends on the pressure differential that is forcing the liquid through a pipe or conduit. Becausethe pipe's cross-sectional area is known and remains constant, the average velocity is an indication ofthe flow rate. The basic relationship for determining the liquid's flow rate in such cases is: Q V x AQ liquid flow through the pipeV average velocity of the flowA cross-sectional pipe areaß beta ratio(pipediameter/orfice diameter)2Ke kinetic energy V /2g2 VΔ P/SGFigure 1-2The permanent pressure loss through a flowmeter is expressed either as a percentage of the totalpressure drop or in units of velocity heads, calculated as V2/2g, where V is the flowing velocity and g isthe gravitational acceleration (32.2 feet/second2 or 9.8 meters/second2 at 60 latitude). For example, ifthe velocity of a flowing fluid is 10 ft/s, the velocity head is 100/64.4 1.55 ft. If the fluid is water, thevelocity head corresponds to 1.55 ft of water (or 0.67 psi). If the fluid is air, then the velocity headcorresponds to the weight of a 1.55-ft column of air.The permanent pressure loss through various flow elements can be expressed as a percentage of thetotal pressure drop (Figure 1-1), or it can be expressed in terms of velocity heads. The permanentpressure loss through an orifice is four velocity heads; through a vortex shedding sensor, it is two;through positive displacement and turbine meters, about one; and, through flow venturis, less than 0.5heads. Therefore, if an orifice plate (Figure 1-2) with a beta ratio of 0.3 (diameter of the orifice to thatof the pipe) has an unrecovered pressure loss of 100 in H 2O, a venturi flow tube could reduce thatpressure loss to about 12 in H2O for the same measurement.Industrial InstrumentationLevel 1 – 200217Bryon Lewisall rights reserved
Section 2 – Basic InstrumentsFlow measurementsDifferential Pressure measurementsMeasuring the flow of liquids is a critical need in many industrial plants. In some operations, the abilityto conduct accurate flow measurements is so important that it can make the difference betweenmaking a profit or taking a loss.The calculation of fluid flow rate by reading the pressure loss across a pipe restriction is perhaps themost commonly used flow measurement technique in industrial applications The pressure dropsgenerated by a wide variety of geometrical restrictions or "head" flow elements come in a wide varietyof configurations, each with specific application strengths and weaknesses. Variations on the theme ofdifferential pressure (d/p) flow measurement include the use of pitot tubes and variable-area meters(rotameters).The pressure differential (h) developed by the flow element is measured, and the velocity (V), thevolumetric flow (Q) and the mass flow (W) can all be calculated using the following generalizedformulas:k is the discharge coefficient of the element (which also reflects the units of measurement), A is thecross-sectional area of the pipe's opening, and D is the density of the flowing fluid. The dischargecoefficient k is influenced by the Reynolds number (see Figure 1-5) and by the "beta ratio," the ratiobetween the bore diameter of the flow restriction and the inside diameter of the pipe.The d/p transmittershould be located asclose to the primaryelement as possible.Lead lines should beas short as possibleand of the samediameter. In cleanliquidservice,theminimum diameter isG", in condensablevapor service, theminimum diameter is0.4". In steam service,the horizontal leadlines should be kept aspossible and be tilted so that condensate can drain back into the pipe. In clean liquid or gas service, thelead lines can be purged through the d/p cell vent or drain connections, and they shouldbe flushed for several minutes to remove all air from the lines. Entrapped air canoffset the zero calibration.Industrial InstrumentationLevel 1 – 200218Bryon Lewisall rights reserved
Section 2 – Basic InstrumentsFlow measurementsOrifice platesThe orifice plate is commonly used in clean liquid, gas, and steam service. It is available for all pipesizes, and if the pressure drop it requires is free, it is very cost-effective for measuring flows in largerpipes (over 6" diameter). The orifice plate is also approved by many standards organizations for thecustody transfer of liquids and gases.The traditional orifice is a thin circular plate (with a tab for handling and for data), inserted into thepipeline between the two flanges of an orifice union. This method of installation is cost-effective, but itcalls for a process shutdown whenever the plate is removed for maintenance or inspection.In order for the velocity profile to fully develop (and the pressure drop to be predictable), straight piperuns are required both up- and downstream of the d/p element. The amount of straight run requireddepends on both the beta ratio of the installation and on the nature of the upstream components in thepipeline.For example, when a single 90 elbow precedes an orifice plate, the straight-pipe requirement rangesfrom 6 to 20 pipe diameters as the diameter ratio is increased from 0.2 to 0.8. In order to reduce thestraight run requirement, flow straighteners (Figure 2-2) such as tube bundles, perforated plates, orinternal tabs can be installed upstream of the primary element.Metering errors due to incorrect installation of the primary element can be substantial (up to 10%).Causes of such errors can be the condition of the mating pipe sections, insufficient straight pipe runs,and pressure tap and lead line design errors.To minimize error (and the need for density correction) when dealing with compressible fluids, the ratioof differential pressure (h) divided by upstream pressure (P) should not exceed 0.25 (measured in thesame engineering units).Industrial InstrumentationLevel 1 – 200219Bryon Lewisall rights reserved
Section 2 – Basic InstrumentsFlow measurementsDifferential pressure metersVenturi tubes are available in sizes up to 72", and can pass 25 to 50% more flow than an orificewith the same pressure drop. The short form venturi (Figure 2-7A). The universal venturi (Figure 2-7B).The flow nozzle (Figure 2-7C) is often been used to measure high flowrates of superheated steam.Pitot Tubes are used to measure air flow in pipes, ducts, and stacks, and liquid flow in pipes, weirs,and open channels for industrial applications (Figure 2-9).Rotameter it’s main application is to contro
instrumentation control and measurement interactions, wiring and connections to the process. The process is illustrated in sections or subsystems of the process called loops. A loop diagram will detail the connections of pneumatics and wiring from the f