Transcription
ECONOMICS & POLITICSVolume 23DOI: 10.1111/j.1468-0343.2010.00372.xMarch 2011No. 1CIVIL WAR EXPOSURE AND VIOLENCEEDWARD MIGUEL, SEBASTIÁ N M. SAIEGH ,ANDSHANKER SATYANATHIn recent years scholars have begun to focus on the consequences of individuals’ exposure to civil war, including its severe health and psychological consequences. Ourinnovation is to move beyond the survey methodology that is widespread in this literature to analyze the actual behavior of individuals with varying degrees of exposureto civil war in a common institutional setting. We exploit the presence of thousands ofinternational soccer (football) players with different exposures to civil conflict in theEuropean professional leagues, and find a strong relationship between the extent ofcivil conflict in a player’s home country and his propensity to behave violently on thesoccer field, as measured by yellow and red cards. This link is robust to region fixedeffects, country characteristics (e.g. rule of law, per capita income), player characteristics (e.g. age, field position, quality), outliers, and team fixed effects. Reinforcing ourclaim that we isolate the effect of civil war exposure rather than simple rule breaking orsomething else entirely, there is no meaningful correlation between our measure ofexposure to civil war and soccer performance measures not closely related to violentconduct. The result is also robust to controlling for civil wars before a player’s birth,suggesting that it is not driven by factors from the distant historical past.1. INTRODUCTIONThe coarsening of human sensibilities that accompanied the [Nigerian] civil war, both on thebattlefront and behind the lines, was being foisted on the general populace. Violence waspalpable in the streets (Soyinka, 2006, p. 175).IN RECENT years, scholars have begun to focus on the consequences of individuals’ exposure to civil war. Many scholars (e.g. Ghobarah et al., 2003) have demonstrated that civilwar has severe health consequences, while others have demonstrated the adverse effects ofwar on psychological states of individuals (Barenbaum et al., 2004). These studies are largelybased on survey responses. The shift from surveys to examining actual behavior is, however,a difficult one. For instance, a convincing examination of the effects of civil war exposure onviolent behavior cannot be conducted simply by comparing violence levels across countries,since the relationship between conflict exposure and weak institutions makes it difficult todisentangle the independent effects of these variables on behavior. Additionally there is ashortage of reliable cross-country crime data, and the quality of data and reporting standards are also arguably endogenous to the level of violence in a society.We attempt to surmount these problems by comparing the behavior of individuals withdifferent degrees of exposure to civil war in a common institutional setting with rich andreliable data on violent conduct. Such an environment is offered by the major professional soccer (football) leagues in Europe. The six major European soccer leagues includeplayers from 70 countries, ranging from countries that have experienced no recent civilwars to countries that have continuously been at war.1 As for empirical measures of Corresponding author: Sebastián M. Saiegh, University of California, San Diego, Department of PoliticalScience, 9500 Gilman Drive #0521, La Jolla, CA 92093, USA. E-mail: ssaiegh@ucsd.edu1We do not consider the World Cup since data are limited to very few matches, in contrast to club play.r 2010 Blackwell Publishing Ltd59
60MIGUEL ET AL.individual violent conduct, there is extensive data on the number of yellow and red cardsearned by each player. According to soccer’s official rules, players who commitexceptionally violent fouls warrant a disciplinary sanction in the form of a caution(indicated by a yellow card) or a dismissal from the match (a red card). Although yellowand red cards may also be granted for certain non-violent acts, the evidence indicates thatan overwhelming majority are given for violent fouls.Our proxy measure for exposure to civil war is the number of years that a player’scountry has been in a state of civil war between 1980 and 2005. This proxy provides alower bound on our estimates of the effects of civil war exposure since many players fromcountries with civil wars were likely outside the country during the fighting, and were thusneither direct participants nor direct observers of the conflict. We obtain a strikingempirical pattern: a strong correlation between the number of years of civil conflict in aplayer’s native country and his likelihood of earning yellow and red cards in Europe. Thismain result is robust to extensive controls for player and country characteristics and teamand continent fixed effects, where we effectively compare nearby countries (e.g. Africancountries with different civil war histories). We also show that our result is robust tocontrolling for civil wars before a player’s birth, suggesting that it is not driven by factorsfrom the distant historical past.In substance, this paper relates most closely to Ghobarah et al. (2003), who identify thelong-lasting adverse effects of civil conflict on public health. Barenbaum et al. (2004)provide a useful survey of the literature in psychology on the effects of war on mentalhealth. Other studies by social scientists have used the sports playing field as a laboratoryfor studying individual decision-making under a clear set of common rules – e.g.Chiappori et al. (2002), Duggan and Levitt (2002), Garicano and Palacios-Huerta(2006), Levitt (2002), Milanovic (2005), Price and Wolfers (2007), Smith (1979a, b),Weinstein et al. (1995), and Witt (2005), among others – but to our knowledge, we are thefirst to apply this strategy to examine the consequences of civil war. The next sectiondescribes the data and estimation, followed by the results and the conclusion.2. DATA AND ESTIMATIONWe analyze the behavior of soccer players to create a revealed preference measure ofindividuals’ proclivity to engage in violent conduct. We argue that the European soccerleagues offer a setting where individual behavior can be studied within a commoninstitutional backdrop and where we can control for alternative explanations forviolence, allowing us to isolate the effect of exposure to violence.Soccer’s official rules, the so-called ‘‘Laws of the Game,’’ are provided centrally by theFédération Internationale de Football Association (FIFA), the international governingbody.2 Every soccer game has one referee with the authority to apply disciplinarysanctions, and the rules establish clear penalties for different types of fouls, misconduct,and aggressive behavior. Most fouls are minor and occur within the natural flow of thegame’s action; these fouls do not earn the player any additional punishment. In contrast,when a more serious offense is committed, the rules stipulate a disciplinary sanction, inparticular a caution or dismissal. A caution earns the player a ‘‘yellow card.’’ In thesecases, the referee stops the match, calls the player over, holds up the yellow card, and2See eration/lotg2006 e 1581.pdf. Referees have incentives to closely adhere to the guidelines: those not enforcing the rules may be assigned to minor games, oreven fired.r 2010 Blackwell Publishing Ltd
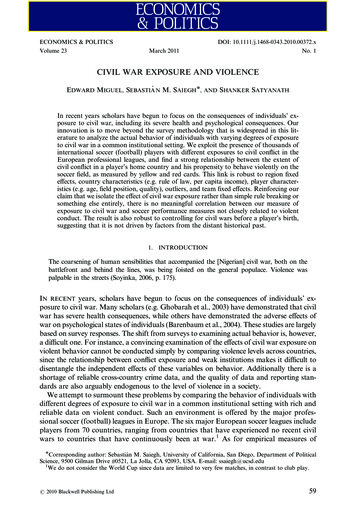
CIVIL WAR EXPOSURE AND VIOLENCE8061Yellow Cards Given in Italy's Serie A70Percent6050403020100Motive(a)AssaultUnsporting BehaviorNon-Violent OffenseYellow Cards Given in UEFA Champions ting BehaviorNon-Violent OffenseFigure 1. Yellow cards according to type of offense.Sources: (a) Research Department of Lega Nazionale Professionisti (Italy); (b) UEFA.writes the player’s name in his notebook. A player who receives a yellow card continuesto play in the match, yet the yellow card serves as the first and last formal warning.Yellow cards are a very good measure of violent conduct. Soccer yellow cards aregranted for many things, including excessively violent fouls; swearing at an opponent;humiliating the opponent after scoring a goal (with excessive celebration); ‘‘diving’’ tofalsely pin a foul on an opponent; or disobeying the referee’s instructions, among otherbehaviors (including time wasting). Yet the available evidence indicates that the vastmajority of yellow cards are granted for violent acts.Figure 1 illustrates the causes of yellow cards in the Italian league during the 2005–2006, 2006–2007, and 2007–2008 seasons, and in the Union of European Football Associations (UEFA) Champions league in 2004–2005 and 2005–2006.3 In the Italianleague, nearly three quarters of all yellow cards were awarded for violent fouls (‘‘assault’’), while in the UEFA data the proportion is close to two thirds. A large share of thenon-violent fouls are for unsporting behavior, some of which is so aggressive as to seek to3The data were generously provided to us by Luca Galvan from the Research Department of the LegaNazionale Professionisti (Italy), and Graham Peaker at UEFA.r 2010 Blackwell Publishing Ltd
62MIGUEL ET AL.provoke a violent response (e.g. humiliating an opponent), and thus could also be interpreted as acts of violence.While we also examine red card fouls as a measure violent conduct in this paper, therelatively low incidence of red cards means that we use it as a secondary measure. Asecond yellow card in the same match leads to a red card dismissal, and in cases ofegregious behavior, a red card may be assigned without the yellow card warning.4 When aplayer is expelled, no replacement is permitted, so his team must complete the matchshort one player. The UEFA Champions league data indicate that 35% of red cards weregiven without prior warnings. In another league where data are available, 40% ofred cards were directly awarded for exceptionally violent fouls (‘‘assault’’), 19% for‘‘professional fouls’’ (a deliberate act of foul play, usually to prevent an opponent scoringand sometimes violent), with the rest for ‘‘other unsporting acts.’’5Our main dataset contains information from the 2004–2005 and 2005–2006 soccerseasons in five national leagues (England, France, Germany, Italy, Spain) and one supranational league (the UEFA Champions league), from ESPN Soccernet website.6 Eachof the national leagues is the top professional league within these countries, and theUEFA Champions league is the top professional league for the continent. We also havedata on each individual player’s quality as measured by his market value. We obtainedthis information from a soccer management simulation video game; the game featuresreal players and real teams, including each player’s transfer fees and salary.7Our sample contains several of the world’s most high-profile soccer leagues and a remarkably international collection of players, drawn to Europe by the world’s highestplayer salaries (Dobson and Goddard, 2001). The mean annual salary in our sampleamounts to US 1,291,517, and the average player is worth US 6,323,515 (Table 1).8 Themain analysis sample includes 5,035 player-year observations for players from 70different countries (see Table A1). To ensure at least a moderate amount of informationper country, we only consider countries with five or more player-seasons represented inour sample though results are nearly identical using other thresholds.As mentioned, there are many more yellow cards (mean 2.43 per player per season, seeTable 1) reported than red cards (mean 0.15 cards).9 We have extensive information onplayers’ place of birth as well as on-field statistics (field position, games played, goalsscored, yellow and red cards). While most players in the European leagues are fromwealthy OECD countries (mainly in Europe), large fractions are from Africa, EasternEurope, and Latin America, with smaller numbers of Asians (Table 1).For some players in our sample, the data source (the Soccernet site) did not provideinformation on their actual place of birth, or indicated a dual nationality. In such cases,we used their participation on a national team to determine nationality. Many playerswho are originally from less-developed countries play for European national teams, and4Beyond expulsion from the current match, a red card often leads to a suspension from future matches;players who accumulate multiple yellow cards in different matches in the same season may also receive latersuspensions.5Source: UEFA Disciplinary Statistics, 2003–2004, p. 6: http://www.uefa.com/newsfiles/249438.pdf. These figuresexclude ‘‘second yellow cards,’’ since the underlying behavior that caused these yellow cards is not reported.6The data were downloaded using a Perl script from http://soccernet.espn.go.com/.7The game is called Worldwide Soccer Manager in the U.S. and Football Manager elsewhere. We use the 2005and 2006 releases. The game was developed by Sports Interactive, and the database is assembled by 2,500researchers worldwide. We searched for news stories regarding many players’ transfer fees to confirm reliability.8The values do not depend on the years when transfers are made; they reflect each player’s market value at thebeginning of the 2004–2005 and 2005–2006 soccer seasons.9These figures are consistent with Garicano and Palacios-Huerta (2006) and Witt (2005).r 2010 Blackwell Publishing Ltd
63CIVIL WAR EXPOSURE AND VIOLENCETABLE 1 DESCRIPTIVE STATISTICSVariableMeanRule infractionsYellow cards per player-season2.43Red cards per player-season0.15Country characteristicsYears of civil war (1980–2005)2.74Rule of law (2005–2006)0.85GNI per capita (2006)26,203Player characteristicsAge26.0Weekly salary (in ’000 USD)24.0Transfer fee (in ’000 USD)6,323.5Games rward0.23Midfield0.36Goals scored per player-season1.65Player region of originAfrica0.07Asia0.004Latin America/Caribbean0.12Eastern Europe0.07OECD0.72Soccer leaguesEnglish league0.17European Champions league0.19French league0.15German league0.14Italian league0.17Spanish league0.16Standard 4.740.8910,9230 : The source of the rule infraction, goals, player characteristics, player country of origin, and soccer leaguesdata are the ESPN Soccernet website. Weekly salaries and transfer fees are expressed in current U.S. dollars.Sources: Football Manager, 2005, and World Soccer Manager, 2006. The source of the civil war data is the PRIO/Uppsala Armed Conflict database, and the source of the rule of law variable is the WGI project. Income per capitais measured in purchasing power parities (PPP) (2006 dollars); World Bank’s World Development Indicators (2007).if anything, using this criterion plausibly leads us to underestimate the effect of homecountry civil war history on violent soccer conduct.10 Since this coding rule is clearly notideal (e.g. because players from civil war torn countries who are playing for France wouldbe classified as not having been exposed to civil war), we also conducted robustnesschecks using the place of birth coding provided by an alternative source (www.playerhistory.com), which offers slightly narrower player coverage than Soccernet. Our resultsare unchanged when we use these data in place of those obtained from Soccernet.10As a robustness check on the statistical findings presented below, we checked whether using this coding rulebiased our results in a downward direction. We created a variable identifying those players for which we did nothave information on their actual place of birth. We found that when this control variable is added to our corespecifications, the point estimate on our measure of violent norms increases, suggesting that our coding criteriatend to attenuate rather than amplify the effect of civil war on soccer violence.r 2010 Blackwell Publishing Ltd
64MIGUEL ET AL.We control for many of the soccer-related factors correlated with fouls and violence onthe field, the most important being the player’s field position – defenders and midfieldersgenerally commit more fouls than forwards, who in turn commit more than goalkeepers –as well as the number of games played as a starter or substitute. A player’s age may alsocorrelate with violent conduct on the pitch and so is included as a further control. We alsocontrol for players’ quality using two different indicators. The first one is his success asa goal scorer, measured by the number of goals scored. The second is a player’s worth,as measured by his transfer fee (which is highly correlated with his salary).We include league fixed effects to address any differences in the calling of cards or foulsacross countries, and team fixed effects (in some specifications) to capture differences inteam quality or playing style and tactics, as these represent a further possible source ofvariation in the incidence of yellow/red cards. The fact that referees have some discretionin calling fouls and awarding cards raises the possibility of bias, and one leading concernis discrimination against players of particular racial or ethnic backgrounds.11 To controlfor any such bias, we include world region fixed effects – for players from Africa, Asia,Latin America, and Eastern Europe – in all specifications. These terms also capture anyother factors, including regional styles of play (‘‘dirty’’ or ‘‘clean’’) or region-wide cultures of violence, allowing us to isolate variation across countries within the same region.Our analysis of violent behavior focuses on the correlation between individual conducton the soccer field and civil war in the player’s home country. Specifically, we use thenumber of years a country suffered from civil war between 1956 and 1996 using thePRIO/Uppsala Armed Conflict dataset.12 Following their conflict classification, we include both ‘‘internal armed conflicts’’ and ‘‘internationalized internal armed conflicts,’’using the comprehensive 25 battle death annual threshold. The former are defined as‘‘conflicts that occur between the government of a state and one or more internal opposition group(s) without intervention from other states,’’ while the latter occur ‘‘withintervention from other states (secondary parties) on one or both sides.’’We use the PRIO dataset rather than using other measures of violent crime (such asmurders per capita) for two reasons. First, even the most extensive (to our knowledge)source of cross-national crime statistics, the United Nations Survey of Crime Trends andOperations of Criminal Justice Systems, has limited country coverage, especially for lessdeveloped countries. Second, as per their own disclaimer, their statistics are ‘‘better indicators of prevalence of law enforcement and willingness to report crime, than actualprevalence.’’ Since our goal is to capture the specific effects of violent attitudes as opposedto other shared standards of appropriate behavior, we also control for the degree of ruleof law using the Worldwide Governance Indicators (WGI) project dataset.13When we analyze the soccer data, given that the dependent variables (yellow card fouls,red card fouls, and goals by player-season) do not take negative values, a count model ismost appropriate. We focus on the negative binomial model (since the Poisson model isrejected at high levels of confidence).14 Standard errors are robustly estimated and thedisturbance terms for each country are allowed to be correlated.11This is not an idle concern: there is evidence of racial bias among U.S. National Basketball Associationreferees (see Price and Wolfers, 2007).12We focus on the 1980–2005 period because it corresponds closely with the age of the players included in oursample. The results are robust when we look at longer periods, including 1960–2005 (see below).13These data are available at http://www.govindicators.org. Summary statistics are in Table 1.14The ‘‘negative’’ denomination of the binomial model comes from applying the general form of the binomialtheorem with a negative exponent. We find overdispersion for yellow cards but not for red cards, but forconsistency, we report negative binomial results for all outcomes.r 2010 Blackwell Publishing Ltd
CIVIL WAR EXPOSURE AND VIOLENCE65Regarding the soccer data, there are three possible sample selection concerns. First, oursample consists exclusively of young men, and young men may differ in values from thegeneral population of their own country. Second, the values and behavior of the talentedyoung men who are in our sample may differ from other young men in the home country.Third, the countries represented in our sample, as well as the number of players from eachcountry, could be correlated with the extent of civil war in the home country.We find that none of these is a major cause for concern. On the first issue, we examinedattitudes toward violence using survey data. Specifically, we analyzed the responses to the1994–1999 wave of the World Values Survey (1995), using a question that capturesjustification for the use of violence.15 We found that the mean responses of young mendiffer on average from the full sample of female and male adults by just 0.1 points ona four-point scale. On the second issue, we find a strong correlation between yellow andred cards acquired by the soccer players in our sample and the average survey responseamong all young men in the home country. On the third issue, there is no statisticallysignificant correlation between the number of years of civil war and the number ofcountry player-years in our sample, or whether the country is represented in our sampleat all (not shown).Moreover, note that the sample selection rule is uniform across countries – therepresentatives of each nation in our sample are young men with exceptional athletic talent –which alleviates most concerns about internal validity. Besides, the fact that physicallyrobust young men are the main perpetrators of violence in nearly all societies today(and historically) makes this a population of exceptional interest for the study of violence.3.EMPIRICAL RESULTSOur main results are presented in Table 2. In all of our specifications, we include bothcountry characteristics as well as individual traits. The inclusion of the latter is, onceagain, one of the main advantages of this paper, since it allows us to use individual-leveldata and observed behavior to identify the effects of exposure to violence.The number of yellow cards earned in 2004–2006 is positively associated with thenumber of years of civil war in the player’s home country between 1980 and 2005 at the99% confidence level (Table 2, regression 1). Our proxy for civil war exposure clearly hasa powerful association with violent conduct on the soccer field.A reasonable way to judge the substantive magnitude is to compare it with the effectsof soccer-related determinants of yellow cards, such as age. The non-linear nature ofour estimator means there is no single marginal effect of greater civil war exposure, so wefocus on particular subpopulations beginning with players from Africa, where civilwar risk is highest. In particular, we consider an African midfielder in the French league(the league with the greatest number of Africans) and set civil war risk and other variablesto the African average. The predicted number of yellow cards for such a player increasesby 3.6% when civil conflict prevalence in his home country increases by one standarddeviation, or 4 years. Player age is also positively correlated with yellow cards andcan serve as a basis for comparison. If the age of the representative African player15Respondents were asked to react to the following statement: ‘‘Using violence to pursue political goals isnever justified.’’ The possible answers are ‘‘Agree Strongly’’ (1), ‘‘Agree’’ (2), ‘‘Disagree’’ (3), and ‘‘DisagreeStrongly’’ (4). Thus higher scores denote a greater tolerance for the use of political violence. This sample includes 27,526 individual respondents from 38 counties in Africa, Asia, North/Latin America, and Western/Eastern Europe.r 2010 Blackwell Publishing Ltd
r 2010 Blackwell Publishing Ltd(5.65) (2.33) (36.09) (10.93) (14.73) (11.06) (12.67) (4.45) (6.37) (6.46) (10.99) Yes5,0350.2640.3130.3520.544 0.031 (0.52) 0.022 (5.81) 0.0130.0320.0670.0411.7151.3971.7290.0076 (2.63) (5.40) (2.22) (37.78) (10.83) (14.79) (11.13) (12.68) (4.27) (6.58) (6.27) (10.75) Yes4,9650.2660.3210.3550.548 0.023 (0.38) 0.022 (6.29) 0.0130.0310.0680.0411.7131.3991.7280.046 (1.06)0.0078 (2.51) Yellow cards(2)(5.64) (2.33) (36.17) (10.89) (14.71) (11.05) (12.66) (4.21) (6.58) (5.11) (9.54) Yes5,0350.2590.3170.3370.534 0.036 (0.63) 0.022 (5.83) 0.0130.0320.0670.0411.7141.3961.728 0.019 (0.40)0.0075 (2.59) Yellow cards(3)(1.74) (2.11) (18.30) (0.89)(7.20) (4.00) (4.45) (2.62) (0.63)(4.57) (6.15) Yes5,0350.2970.0980.6290.648 0.502 (2.43) 0.028 (3.37) 0.0130.0630.0510.0111.1130.7200.889 0.143 (1.46)0.0126 (1.92) Red cards(4)(3.20) (11.88) (40.16) (13.65) (1.24)(4.12) (0.22)(0.03)Yes5,0350.0780.244 0.0120.0020.211 (2.45) 1.647 (21.26) 0.679 (11.31) 18.216 (54.31) 0.0210.3220.0870.0690.006 (0.15)0.0001 (0.02)Goals scored(5)(5.77) (2.34) (36.08) (10.99) (14.70) (11.01) (12.66) (4.15) (6.33) (6.28) (10.09) Yes5,0330.2630.3190.3530.551 0.028 (0.46) 0.022 (5.84) 0.0130.0320.0670.0411.7141.3961.7280.0052 (1.86) 0.0036 (0.73)Yellow cards(6)(1.54)(2.08) (18.42) (0.89)(7.28) (4.06) (4.50) (2.93) (0.68)(7.10) (6.70) Yes5,0330.3340.1120.7490.719 0.453 (2.23) 0.028 (3.27) 0.0100.0620.0510.0111.1190.7260.8920.014 (2.13) 0.004 (0.41)Red cards(7)Notes: The dependent variables are per player-season. Columns (1)–(7) contain the results of negative binomial specifications with disturbance terms clustered at thecountry level. The omitted categories in columns (1)–(4) and (6)–(7) are Goalie (for field position), OECD (for region), and the English Premier league (for league); incolumn (5), the baseline categories are defender (for field position), OECD (for region), and the English Premier league (for league). The region fixed effect results are notshown. Z-statistics are in parentheses. Statistical significance at 90%, 95%, and 99% confidence levels.Regional fixed effectsObservationsSoccer leaguesEuropean ChampionsleagueFrench leagueGerman leagueItalian leagueSpanish leaguePlayer characteristicsAgeLog transfer feeGames lsCountry characteristicsYears of civil warCivil war years postbirthCivil war years prebirthLog GNI per capitaRule of lawYellow cards(1)TABLE 2. EMPIRICAL RESULTS: CIVIL WAR66MIGUEL ET AL.
CIVIL WAR EXPOSURE AND VIOLENCEFigure 2.67Yellow cards and civil war (conditional on control variables in Table 2, regression 1) – all countries.decreases by 2 years, his estimated number of yellow cards decreases by 3.0%, roughlyoffsetting the positive conflict effect. A similar calculation for a representativeLatin American playing in the Spanish league (the league with the most Latin Americans)also yields a predicted 3.6% increase in yellow cards when civil war increases by onestandard deviation.Figure 2 presents a scatterplot relating years of civil war for each country between 1980and 2005 (on the horizontal axis) to the average number of yellow cards earned perplayer-season, both conditional on the control variables included in Table 2, regression 1;the area of the country circles is drawn proportional to the number of player-seasons ofthat nationality represented in the sample. The graphical relationship is visibly positivelysloped. Colombia and Israel are the two sample countries that experienced civil war inevery year since 1980, and their players are remarkably violent on the pitch. Inter Milan’sColombian defender Iván Ramiro Córdoba is a case in point: in 2004–2005 and 2005–2006, he collected a stunning 25 yellow cards.This graphical representation raises the issue of robustness to excluding countries withexceptionally high civil war prevalence, but a series of checks indicate that the main relationship is stable when outliers are removed; these robustness checks are presented inTable A2. The first test calculates studentized residuals to identify outliers (followingBelsley et al., 1980). When the main model (analogous to Table 2, regression 1) is reestimated omitting outliers, the point estimate on civil war remains large and statisticallysignificant (Table A2, regression 1). The result is also robust to, respectively, droppingOECD countries (regression 2), OECD countries and Colombia (regression 3), just Colombia (regression 4), logging civil war years (regression 5), and running the regressionsat the country level (regression 6). Figures 3 and 4 show that the regression line remainsdistinctly upward sloping when we, respectively, drop OECD countries, and when weadditionally drop Colombia, Israel, Iran, Peru, and Turkey.1616Results are also unchanged when we control for player salary rather than the transfer fee. Another concernrelates to referees’ xenophobia (recall that racism is largely controlled with continent fixed effects), but antiforeigner bias is not driving our results: the estimate on civil war history is unchanged when an indicator forbeing a foreigner is included (not shown).r 2010 Blackwell Publishing Ltd
68MIGUEL ET AL.Figure 3.Yellow cards and civil war (conditional on control variables in Table 2, regression 1) –non-OECD countries.Figure 4.Yellow cards and civil war (conditional on control variables in Table 2, regression 1) –non-OECD countries, excluding Colombia, Iran, Israel, Peru, an
player salaries (Dobson and Goddard, 2001). The mean annual salary in our sample amounts to US 1,291,517, and the average player is worth US 6,323,515 (Table 1).8 The main analysis sample includes 5,035 player-year observations for players from 70 different countries (see Table