Transcription
Flags and PennantsFlags and Pennants are short-term continuation patternsthat mark a small consolidation before the previous moveresumes. These patterns are usually preceded by a sharpadvance or decline with heavy volume, and mark a midpoint of the move.1. Sharp Move: To be considered a continuation pattern,there should be evidence of a prior trend. Flags andpennants require evidence of a sharp advance or declineon heavy volume. These moves usually occur on heavyvolume and can contain gaps. This move usuallyrepresents the first leg of a significant advance or declineand the flag/pennant is merely a pause.2. Flagpole: The flagpole is the distance from the first resistance orsupport break to the high or low of the flag/pennant. The sharp advance (or decline) that forms the flagpoleshould break a trendline or resistance/support level. A line extending up from this break to the high of theflag/pennant forms the flagpole.3. Flag: A flag is a small rectangle pattern that slopes against the previous trend. If the previous move wasup, then the flag would slope down. If the move was down, then the flag would slope up. Because flags areusually too short in duration to actually have reaction highs and lows, the price action just needs to becontained within two parallel trendlines.4. Pennant: A pennant is a small symmetrical triangle that begins wide and converges as the pattern matures(like a cone). The slope is usually neutral. Sometimes there will not be specific reaction highs and lows fromwhich to draw the trendlines and the price action should just be contained within the converging trendlines.5. Duration: Flags and pennants are short-term patterns that can last from 1 to 12 weeks. There is somedebate on the timeframe and some consider 8 weeks to be pushing the limits for a reliable pattern. Ideally,these patterns will form between 1 and 4 weeks. Once a flag becomes more than 12 weeks old, it would beclassified as a rectangle. A pennant more than 12 weeks old would turn into a symmetrical triangle. Thereliability of patterns that fall between 8 and 12 weeks is debatable.6. Break: For a bullish flag or pennant, a break above resistance signals that the previous advance hasresumed. For a bearish flag or pennant, a break below support signals that the previous decline has resumed.7. Volume: Volume should be heavy during the advance or decline that forms the flagpole. Heavy volumeprovides legitimacy for the sudden and sharp move that creates the flagpole. An expansion of volume on theresistance (support) break lends credence to the validity of the formation and the likelihood of continuation.8. Targets: The length of the flagpole can be applied to the resistance break or support break of theflag/pennant to estimate the advance or decline.Even though flags and pennants are common formations, identification guidelines should not be takenlightly. It is important that flags and pennants are preceded by a sharp advance or decline. Without a sharpmove, the reliability of the formation becomes questionable and trading could carry added risk. Look forvolume confirmation on the initial move, consolidation and resumption to augment the robustness of patternidentification.
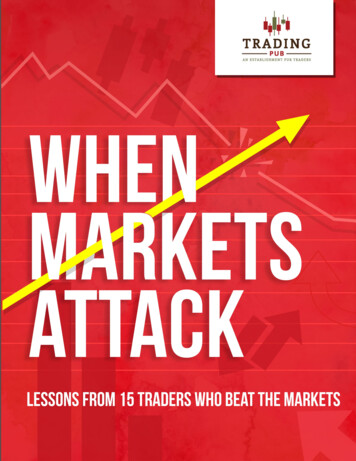
Bull Flag Patterns (Continuation Pattern)Bull flag is a sharp, strong volumerally on a positive fundamentaldevelopment, several days ofsideways to lower price action onmuch weaker volume followed bya second, sharp rally to new highson strong volume.The technical target is derived byadding the height of the flag poleto the eventual breakout level atpoint (e). Bull flag formations involve two distinct parts, a near vertical, high volume flag pole and a parallel,low volume consolidation comprised of four points and an upside breakout.The actual flag formation of a bull flag pattern must be less than 20 trading sessions in duration.Most flag patterns occur at the middle of the larger move higher for a stock.Upside breakouts often lead to small 2-3% rallies followed by an immediate test of the breakout level.If the stock closes below this level (now support) for any reason the pattern becomes invalid.Bulls flags are favored among technical traders because they almost always lead to large and predicableprice moves. Like all continuation patterns, bull flags represent little more than a brief lull in a larger movehigher. Indeed, in many cases the flag pattern will actually take shape in the middle of the ultimate movehigher. Bull flags occur because stocks rarely move higher in a straight line for an extended period, instead,the move higher is broken up by brief periods where traders "catch their breath".The first part of the flag pattern is often called the flagpole or mast. During this phase the stock priceskyrockets to a reaction high (a) on some positive fundamental development. Very often this will be theunveiling of a new product, a favorable legal resolution or positive earnings surprise but the change in priceis near vertical as would be sellers are overwhelmed by new buyers caught-up in the euphoria of themoment. As the stock soars speculators that were smart enough to have purchased the stock at lower levelsbegin selling.At this point the second phase or flag portion of the bull flag begins. Because the flow of news and investorsentiment is overwhelming positive, most of the stock sold by speculators is easily absorbed in thebeginning but as time passes fewer investors seem willing to pay the current price. Slowly, the stock pricebegins to falter on dramatically reduced volume. The descent is slow because bullish sentiment is still verystrong.After several days of minor weakness, a rally begins and a minor low is set (b). Sensing an opportune timeto enter new positions buyers begin to return, pushing the stock very near the most recent high but becausevolume is light this rally is easily rebuffed and a slightly lower high (c) is established before the price turnslower. The new round of selling sends the stock modestly lower on reduced volume. After several moresessions the stock moves below the lows made at point (a) but volume contracts further. Just as it begins tolook as though a real decline is underway there is a new positive fundamental development and the stockbegins to move higher (d). As the rally accelerates volume increases dramatically, buyers overwhelm thosetaking profits. Over the next 1-2 sessions the stock moves through the high set at point (c) and volumesurges further. This triggers an upside breakout point (e). The next session several Wall Street firms eithermake new "buy" recommendations or reiterate existing recommendations. The stock opens higher and goeson to make significant new highs in the weeks ahead.
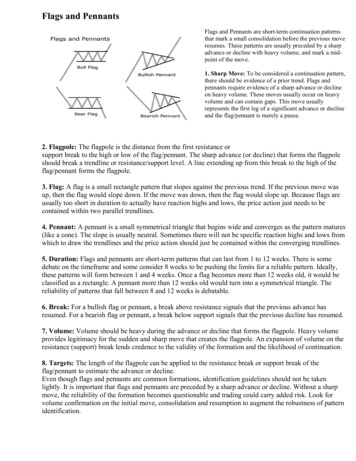
Bullish Pennant (Continuation Pattern)Bullish pennant is a sharp,strong volume rally on a positivefundamental development,several days of narrowing priceconsolidation on much weakervolume followed by a second,sharp rally to new highs on strongvolume.The technical target for a bullflag pattern is derived by addingthe height of the flag pole or point(a) to the eventual breakout levelat point (e). Bullish pennants involve two distinct parts, a near vertical, high volume flag pole and a symmetrical,low volume triangular consolidation comprised of four points and an upside breakout.The triangular consolidation during the formation of the pennant is very much like a symmetricaltriangle and this implies that traders feel comfortable with the current price.The actual pennant formation of a bullish pennant pattern must be less than 20 trading sessions indurationMost bullish pennant patterns occur at the middle of the larger move higher for a stock.Upside breakouts often lead to small 2-3% rallies followed by an immediate test of the breakout level.If the stock closes below this level (now support) for any reason the pattern becomes invalidBullish pennants are very close cousins to bull flags, in fact, there is only one major difference, theconsolidation after the flag pole is triangular (pennant-shaped) as opposed to being parallel (flag-shaped).Like flags, pennants are favored among technical traders because they almost always lead to large andpredicable price moves. Finally, like flags, pennants usually take shape at the mid point of a major movehigher.The first part of the pennant pattern is often called the flagpole or mast. During this phase the stock priceskyrockets to a reaction high (a) on some positive fundamental development. Very often this will be theunveiling of a new product, a favorable legal resolution or a positive earnings surprise but the change inprice is near vertical as would be sellers are overwhelmed by new buyers caught-up in the euphoria of themoment. As the stock soars speculators that were smart enough to have purchased the stock at lower levelsbegin selling.At this point the second phase or pennant portion of the pattern begins. Because the flow of news andinvestor sentiment is overwhelming positive, most of the stock sold by speculators is easily absorbed in thebeginning but as time passes fewer investors seem willing to pay the current price. Slowly, the stock pricebegins to falter on dramatically reduced volume. The descent is slow because bullish sentiment is still verystrong and after several days of minor weakness, a brief rally begins and a minor low is set (b).Sensing an opportune time to enter new positions buyers begin to return, pushing the stock very near themost recent high but because volume is light this rally is easily rebuffed and a slightly lower high (c) isestablished before the price turns lower. The new round of selling sends the stock modestly lower onreduced volume. After several more sessions the stock approaches the lows made at point (a) but volumeexpands and a higher low is set at point (d). This higher low establishes the parameters of a very smallsymmetrical triangle pattern. As the stock begins to move higher from point (d) volume increasesdramatically, buyers overwhelm those taking profits. Over the next 1-2 sessions the stock moves through thehigh set at point (c) and volume surges further. This triggers an upside breakout point (e). The next sessionseveral Wall Street firms either make new "buy" recommendations or reiterate existing recommendations.The stock opens higher and goes on to make significant new highs in the weeks ahead.
Bear Flag (Continuation Pattern)Bear Flag is a sharp, strongvolume decline on a negativefundamental development, severaldays of sideways to higher priceaction on much weaker volumefollowed by a second, sharpdecline to new lows on strongvolume.The technical target for a bearflag pattern is derived bysubtracting the height of the flagpole from the eventual breakoutlevel at point (e). Bear flag formations involve two distinct parts, a near vertical, high volume flag pole and a parallel,low volume consolidation comprised of four points and an upside breakout.The actual flag formation of a bear flag pattern must be less than 20 trading sessions in duration.Most bear flag patterns occur at the middle of the larger move lower for a stock.Downside breakouts often lead to small 2-3% declines followed by an immediate test of the breakoutlevel. If the stock closes above this level (now resistance) for any reason the pattern becomes invalid.Bear flags are favored among technical traders because they almost always lead to large and predicableprice moves. Like all continuation patterns, bear flags represent little more than a brief lull in a larger movelower. Indeed, in many cases the flag pattern will actually take shape in the middle of the ultimate movelower. Like bull flags, bear flags occur because stocks rarely move in one direction for an extended period,instead, the move is broken up by brief periods where traders "catch their breath". These periods are flagsand pennants.The first part of the bear flag pattern is often called the flagpole or mast. During this phase the stock pricecollapses to a reaction low (a) following some negative fundamental development. Very often this will bedownward guidance, an unfavorable legal resolution or negative earnings surprise but the change in price isnear vertical as would be buyers are overwhelmed by frantic new sellers caught-up in the euphoria of themoment. As the stock collapses some speculators that were smart enough to have sold short stock at higherlevels begin buying to cover short positions and some less informed investors actually begin bargainhunting.At this point the second phase or flag portion of the bear flag begins. Because the flow of news and investorsentiment is overwhelming negative, most of the stock bought by speculators is easily absorbed by nervoussellers in the beginning but as time passes selling pressures abate and slowly, the stock price begins to riseon dramatically reduced volume. It is bargain-hunting that pushes the stock off the lows but volume is soweak that the rally soon fizzles and the stock puts-in a short term top point (b).With bearish sentiment still rampant the next decline threatens to push the stock to fresh new lows but asthe decline begins volume slows further and the bargain-hunters become more enthusiastic. As the stockapproaches the reaction low price stabilizes and second short term bottom is established at slightly higherlevels point (c). Buoyed by the fact the stock did not make a relative new low bargain hunters once againbegin buying the stock. This time the stock rallies slightly higher than point (b) but volume is even weakerand the rally soon fails (d).During the next 3-4 sessions the stock trades in a narrow range and volume slows dramatically before thestock begins to slide toward the lows established at point (c). Over the next 1-2 sessions the stock movesthrough these lows, triggering a downside breakout (e). Over the next session several Wall Street firmsmake negative comments or reduce earnings estimates and a new leg lower begins. The stock opens lowerand goes on to make significant new lows in the weeks ahead.
Bearish Pennant (Continuation Pattern)Bearish Pennant is a sharp, strongvolume decline on a negativefundamental development, severaldays of narrowing price consolidationon much weaker volume followed bya second, sharp decline to new lowson strong volume.The technical target for a bearishpennant pattern is derived bysubtracting the height flag pole fromthe eventual breakout level at point(e). Bearish pennant formations involve two distinct parts, a near vertical, high volume flag pole and asymmetrical, low volume triangular consolidation comprised of four points and a downside breakout.The triangular consolidation during the formation of the pennant is very much like a symmetricaltriangle and this implies that traders feel comfortable with the current price.The actual flag formation of a bearish pennant pattern must be less than 20 trading sessions induration.Most bearish pennant patterns occur at the middle of the larger move lower for a stock.Downside breakouts often lead to small 2-3% declines followed by an immediate test of the breakoutlevel. If the stock closes above this level (now resistance) for any reason the pattern becomes invalid.Bearish pennants are very close cousins to bear flags, in fact, there is only one major difference, the consolidation after theflag pole is triangular (pennant-shaped) as opposed to being parallel (flag-shaped). Like flags, pennants are favored amongtechnical traders because they almost always lead to large and predicable price moves. Finally, like flags, pennants usuallytake shape at the mid point of a major move higher.The first part of the bearish pennant pattern is often called the flagpole or mast. During this phase the stock price collapsesto a reaction low (a) following some negative fundamental development. Very often this will be downward guidance, anunfavorable legal resolution or negative earnings surprise but the change in price is near vertical as would be buyers areoverwhelmed by frantic new sellers caught-up in the euphoria of the moment. As the stock collapses some speculators thatwere smart enough to have sold short stock at higher levels begin buying to cover short positions and some less informedinvestors actually begin bargain-hunting.At this point the second phase or pennant portion of the bearish pennant begins. Because the flow of news and investorsentiment is overwhelming negative, most of the stock bought by speculators is easily absorbed by nervous sellers in thebeginning but as time passes selling pressures abate and slowly, the stock price begins to rise on dramatically reducedvolume. It is bargain-hunting that pushes the stock off the lows but volume is so weak that the rally soon fizzles and thestock puts-in a short term top point (b).With bearish sentiment still rampant the next decline threatens to push the stock to fresh new lows but as the declinebegins volume slows further and the bargain-hunters become more enthusiastic. As the stock approaches the reaction lowprice stabilizes and second short term bottom is established at slightly higher levels point (c). Buoyed by the fact the stockdid not make a relative new low bargain hunters once again begin buying the stock. This time the stock rallies but fails tomove beyond the highs established at point (b).This lower high establishes the parameters of a very small symmetrical triangle pattern and becomes point (d) in thebearish pennant pattern. During the next 3-4 sessions the stock trades in a narrow range and volume slows dramaticallybefore the beginning to slide toward the lows established at point (c). Over the next 1-2 sessions the stock moves throughthese lows, triggering a downside breakout (e). The next session several Wall Street firms make negative comments orreduce earnings estimates and a new leg lower begins. The stock opens lower and goes on to make significant new lows inthe weeks ahead.
Ascending Triangle (Continuation Pattern)Ascending and descending triangles are also referred to as "right-angle" triangles.Generally, a triangle pattern is considered to be a continuation or consolidation pattern. Sometimes, however, the formationmarks a reversal of a trend.Symmetrical triangles are generally considered neutral, ascending triangles are bullish, and descending triangles arebearish. From a time perspective, triangles are usually considered to be intermediate patterns. Usually, it takes longer than amonth to form a triangle. Seldom will a triangle last longer than three months. If a triangle pattern does take longer thanthree months to complete,the formation will take on major trend significance.What does an ascending triangle look like?Converging trendlines of support and resistance give all three patterns their distinctive shape. Buyers and sellers findthemselves in a period where they are not sure where the market is headed. Their uncertainty is marked by their actions ofbuying and selling sooner, making the pattern look like an increasingly tight coil moving across the chart.As the range between the peaks and troughs marking the progression of price narrows, the trendlines meet at the "apex,"located at the right of the chart. The "base" of the triangle is the vertical line at the left of the chart which measures thevertical height of the pattern.An ascending triangle - the "flat-top" triangle - also shows two converging trendlines. In this case, however, the lowertrendline is rising and the upper trendline is horizontal. This pattern occurs because the lows are moving increasingly higherbut the highs are maintaining a constant price level.What are the details that I should pay attention to in an ascending triangle pattern?1. Occurrence of a Breakout - Technical analysts pay close attention to how long the triangle takes to develop to its apex.The general rule, as explained by Murphy, is that price breakout clearly penetrate one of the trendlines - somewherebetween three-quarters and two-thirds of the horizontal width of the formation. The break out, in other words, should occurwell before the pattern reaches the apex of the triangle. To take the measurement, begin by drawing the two convergingtrendlines. Measure the length of the triangle from its base to the apex. Next, plot the distance along the horizontal width ofthe pattern where the breakout should take place. If prices remain within the trendlines beyond the three-quarters point ofthe triangle, technical analysts will approach the triangle with caution.2. Price Action - With its "flat-topped" shape, the ascending triangle indicates that buyers are more aggressive than sellers.The ascending triangle forms because of a supply of shares available at a fixed price. When the supply depletes, the sharesquickly breakout from the flat-topped trendline and move higher.3. Measuring the Triangle - To project the minimum short-term price objective of a triangle, an investor must wait untilthe price has broken through the trendline. When the price breaks through the trendline, the investor then knows whetherthe pattern is a consolidation or a reversal formation.To calculate the minimum price objective, calculate the "height" of the formation at its widest part - the "base" of thetriangle. The height is determined by projecting a vertical line from the first point of contact with the trendline on the left ofthe chart to the next point of contact with the opposite trendline. In other words, measure from the highest high point on onetrendline to the lowest low point on the opposite trendline. Both these points will be located on the far left of the formation.Next, locate the "apex" of the triangle (the point where the trendlines converge). Take the result of the measurement of theheight of the triangle and add it to the price marked by the apex of the triangle if an upside breakout occurs, or subtract itfrom the apex price if the triangle experiences a downside breakout.4. Duration of the Triangle - As mentioned before, the triangle is a relatively short-term pattern. It may take up to onemonth to form and it usually forms in less than three months.
5. Forecasting Implications - The ascending triangle is considered to be bullish. Typically, that breakout should beaccompanied by a noticeable surge in volume.6. Shape of Ascending Triangle - Prices should rise to hit the upper trendline at least twice (two highs), then fall away.Prices should fall to the lower trendline at least twice (two lows), then rise. The horizontal top trendline need not becompletely horizontal but it often is and, in any event, it should be close to horizontal.7. Volume - Murphy advises that in the ascending triangle, volume tends to be slightly higher on bounces and lighter ondips.8. Premature or False Breakouts - Because the pattern can be either a reversal or continuation pattern, investors areparticularly susceptible to false moves or, at the very least, confused by them. In addition, because volume becomes so thinas the triangle formation progresses to the apex, it takes very little activity to bring about an erratic and false movement inprice, taking the price outside of the trendlines.To avoid taking an inadvisable position in a stock, some investors advise waiting a few days to determine whether thebreakout is a valid one. Typically, a false move corrects itself within a week or so. The pattern immediately will besuspicious without an accompanying high volume breakout. If there's no pick up in volume around the breakout, investorsshould be wary.Ascending triangle is rally to a new high followed by a pull back to an intermediate support level, a second rally to test thefirst peak followed by a second decline to a level higher than the intermediate term support level and finally a rally to freshnew highs on strong volume.The technical target is derived by measuring the vertical height of the triangle and applying this length to the newbreakout level. Ascending triangles are among the most reliable of all technical patterns because both supply anddemand are easily defined. The defining characteristic of ascending triangles is the pattern of rising lows and a series of equalhighs. This combination of points can be connected to form a right angle triangle. If a stock violatesany part of the triangle during its formation the pattern it should be considered void and tradingpositions should be abandoned. Triangles are about indecision and as such volume should slow noticeably as the pattern is beingconstructed. It is most important that volume surge as the stock rallies through the reaction high. Thistells the technical trader that supply has been absorbed, short covering is rampant and the next leg ofthe bull phase is about to begin. Upside breakouts often lead to small 2-3% rallies followed by an immediate test of the breakout level.If the stock closes below this level (now support) for any reason the pattern becomes invalid.This pattern typically occur after a stock has had a strong move higher due to a positive fundamental development.Investors come to believe that much higher stock prices are justified given the improved fundamental outlook but a largeportion of investors that were smart enough to have bought the stock at much lower prices disagree. These "smart money"investors consider the extreme optimism as little more than an opportunity to liquidate positions. Using fundamentalmetrics, they set a price to sell their large blocks of stock and wait. In effect, they are beginning a distribution process basedon their interpretation of fair value. The first step in the distribution process occurs after one particularly bullishfundamental development. The stock surges to a new high and Wall Street analysts begin pounding the table with new"buy" recommendations.The increased volume is a perfect opportunity for the smart money to liquidate positions. They begin selling and the rallyis stopped in its tracks creating a small top (top #1). As buyers realize that there is plenty of supply at this level prices beginto falter and in short order the stock trades back to a previous intermediate term support level. Because this low is thereaction to the previous rally to new highs, it is often called the reaction low. In this very limited sense, ascending trianglesare very much like double and triple tops -- rising demand meets entrenched supply. In fact, because the fundamental newsis so strong Wall Street analysts dismiss the weakness as simple profit taking and a new rally soon begins.On strong volume the stock surges toward the recent high where it is once again rebuffed by aggressive sellers (top #2). Itis at this point that speculators recognize a trend and they begin adding new short positions just beneath the recent high.This added selling pressure should push the stock significantly lower but bullish enthusiasm is rampant. The stock doesmove lower but the pull back is subdued, in fact, the stock does not reach the reaction low set in the aftermath of the firstmove to new highs.Days later another positive development occurs and the stock begins moving toward the recent high on very strongvolume. Speculators step-up and add to their short positions but the supply of stock from smart money investors is beingsatiated. It soon becomes clear that buyers are going to win this battle because sellers are running out of stock to sell. As thestock pierces what had been strong resistance a strange dynamic occurs, those traders that had been selling the stock shortat the recent high are motivated to cover short positions to cut losses -- thereby creating increased demand for the stock at atime when supply has been severely curtailed. Against this backdrop ongoing bullish enthusiasm leads to a spectacularprice breakout on strong volume. Very soon after the breakout several fundamental analysts make positive comments,aggravating the imbalance between supply and demand. Weeks later the stock surges to a substantial new high. In this rareinstance smart money investors are trumped by ongoing bullish fervor and the level that had been resistance becomesimportant support.
Descending Triangle (Continuation Pattern)Ascending and descending triangles are also referred to as "right-angle" triangles.Generally, a triangle pattern is considered to be a continuation or consolidation pattern. Sometimes, however, the formationmarks a reversal of a trend.Descending triangles are generally considered bearish. From a time perspective, triangles are usually considered to beintermediate patterns. Usually, it takes longer than a month to form a triangle. Seldom will a triangle last longer than threemonths.What does a descending triangle look like?Converging trendlines of support and resistance gives this pattern its distinctive shape. Buyers and sellers find themselvesin a period where they are not sure where the market is headed. Their uncertainty is marked by their actions of buying andselling sooner, making the pattern look like an increasingly tight coil moving across the chart.A descending triangle, like the other two triangles, features two converging trendlines. In this "flat-bottom" triangle, thebottom trendline is horizontal and the top trendline slopes downward. The pattern illustrates lows occurring at a constantprice level, with highs moving constantly lower.What are the details that I should pay attention to in a descending triangle pattern?1. Occurrence of a Breakout - Technical analysts pay close attention to how long the triangle takes to develop to its apex.The general rule is that prices should break out -and clearly penetrate one of the trendlines - somewhere between threequarters and two-thirds of the horizontal width of the formation. The break out, in other words, should occur well before thepattern reaches the apex of the triangle. To take the measurement, begin by drawing the two converging trendlines.Measure the length of the triangle from its base to the apex. Next, plot
The actual pennant formation of a bullish pennant pattern must be less than 20 trading sessions in duration Most bullish pennant patterns occur at the middle of the larger move higher for a sto