Transcription
A ModelingApproach toLead Generation
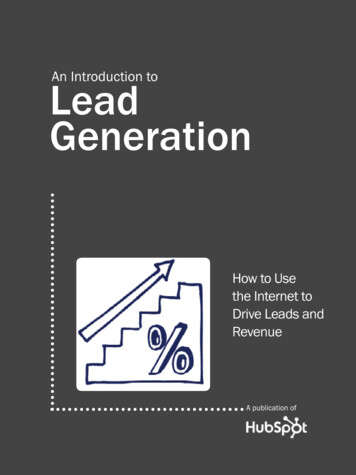
It’s no surprise that marketers have to deal with moredata, coming from more places, than ever before.But few marketers really utilize that data to optimize their value to the organization. Instead of flying blind,what they need is a framework to fuel faster revenue growth through data-driven lead generation planningand real-time campaign tracking to determine what’s working and what’s not.Just look at this roundup of marketing technologies, all designedto help marketers do their jobs more effectively in different anddistinct ways.1Overwhelming isn’t it? Each one of these technologies comeswith its own interface, and spits out data in its own format. With somuch pressure to track, analyze, and optimize performance, it isimperative for marketers to solve “the data problem” – and quickly.So for the 66% of marketers that don’t feel they can adequatelyhandle the volume of data to do their jobs effectively, read on! Thiscomprehensive eBook outlines how to:Establish a data-driven approach to lead generationHow to establish a common framework across sales andmarketing to improve conversion rates throughout the funnelAnd how to measure performance without spending yourwhole day in g-technology-vendors-new-normal/A Modeling Approach to Lead Generation2
Are you ready to rise up to the challenge?Let’s start with a story. At Logi Analytics, we have a unique marketingchallenge. Our potential customer base is limitless – because intoday’s business environment, everyone needs access to analytics.So our prospects span a wide variety of roles – from IT to marketing,sales, and finance – as well as across industries. We also supportthree different sales teams in two different geographies – and 90%of our sales pipeline comes from marketing-generated leads.90% of sales pipelineAs we continue to grow, and set increasingly high revenue goals, theburden on the marketing “machine” gets heavier. We no longer have theluxury of doing what we can and hoping it’s enough. We need to take amore disciplined approach to lead generation to ensure we adequatelysupport the sales team to accomplish our goals.In terms of activity, we run marketing campaigns across all of the majorchannels. But how do you decide how to allocate time and resourcesacross channels to ensure you’re doing enough? In the next section, we’llgo over how to create a data-driven marketing plan from the top down.A Modeling Approach to Lead Generation3
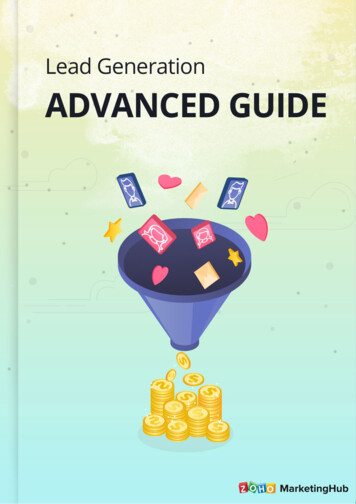
How to Create a Data-Driven Marketing PlanFirst, calculate your marketing targets based on the company’s revenue goals.1. Start with Revenue TargetsBegin by inputting your revenue goals by segment orproduct (2015 Target).2. Input Sales Funnel AssumptionsNext, input your assumptions around growth rate, averageselling price (ASP), win rate, and sales cycle. Look athistorical performance (a trailing four-quarter average is agood place to start) and adjust based on your expectationsfor the coming year.A Modeling Approach to Lead Generation4
How to Create a Data-Driven Marketing PlanWhile this example defines segments based on geography and product, you could easily define them by other criteria,including sales team, industry, new vs. existing business, etc.3. Calculate Opportunity & Lead TargetsNext, input the number of opportunities created in priorperiods (in this case we go back four quarters, but you canadjust based on the length of your sales cycle) and calculatehow many opportunities you’ll need to create in upcomingperiods to hit the revenue targets.Adjust the opportunity figures until the Total Closed in 2015is greater than or equal to the Target.A Modeling Approach to Lead Generation5
How to Create a Data-Driven Marketing Plan4. Convert Your Targets to a PlanGreat! You have your opportunity targets. Now you need aplan that gets you there.To the right is an example of how to structure yourcampaign plan to hit the opportunity targets for eachsegment. On the left hand side, list out all of your marketingchannels and campaigns, and then input your expectationsin terms of leads and opportunities by segment. Again,use historical performance and/or industry benchmarksas a guide. You may also consider incorporating differentconversion rates by channel and/or campaign from leadto opportunity (for example, leads from the healthcareconference may only convert to an opportunity 5% ofthe time, while inbound calls and emails convert to anopportunity at a 35% rate).A Modeling Approach to Lead Generation6
How to Track Marketing PerformanceOnce you’ve finalized your campaign plan, it’s time to execute and track your performance.Unfortunately, this is where most marketers run into problems.Common IssuesMETRICSLead definition is often incomplete (e.g. only captures net newengagements as opposed to leads that engaged a while ago,went away, and have now reengaged)Limited feedback on lead quality (e.g. lots of opinions, not a lotof data to back it up)DATAManual, time-intensive reporting from individual systems likeEloqua, LinkedIn, Salesforce, etc.Unable to see the big picture, only individual campaignperformanceAnalysis is postmortem, so unable to make meaningfulreal-time adjustmentsATTRIBUTIONUnable to track the full lifecycle of a lead to determine whichcampaigns/channels are actually driving revenueA Modeling Approach to Lead Generation7
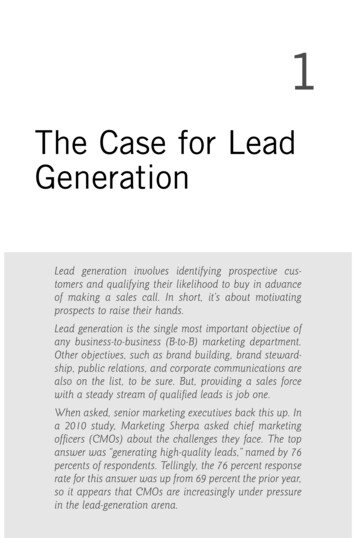
How to Track Marketing PerformanceWhat we need is a more sophisticated model to track the full lifecycle of a lead.As opposed to generating leads and simply tossing them over the fence for sales to do with them what they please, we need a more structuredview of all the stages from inquiry to deal to measure our effectiveness throughout the entire qualification process.SiriusDecisions Demand WaterfallThe most widely used and adopted framework to track the fulllifecycle of a lead is the SiriusDecisions Demand Waterfall. Similarto the leadgen model we discussed in the previous section, theDemand Waterfall is a shared framework between marketing andsales to measure their effectiveness throughout the funnel. It iscomprised of three stages of qualification: marketing, sales, andclose. Let’s review the definitions within each of these stages below.A Modeling Approach to Lead Generation8
How to Track Marketing PerformanceMarketing Qualification DefinitionsSales Qualification DefinitionsAutomation Qualified Lead (AQL): a system-generatedqualification based on a lead’s profile and activity. The lead isscored by your marketing automation system (e.g. Marketo,Eloqua) and all leads scored above a certain threshold move onto the next step.Sales Accepted Lead (SAL): confirmation of handoff frommarketing or lead development to sales. The rep will confirmthat all qualification criteria has been met before contactingthe lead. If the lead is not qualified (e.g. wrong territory, missinginfo), the rep should reject the lead.Teleprospecting Accepted Lead (TAL): confirmation of hand offfrom marketing to lead development. The business developmentrep (BDR) will confirm that all contact information is completeand correct before contacting the lead. If the lead is junk (e.g.student, spam, etc.), the BDR should reject the lead.Sales Generated Lead (SGL): a lead sourced through salesoutbound efforts (i.e. did not engage with any previousmarketing campaigns or go through an BDR)Teleprospecting Qualified Lead (TQL): a lead ready for salesattention based on BDR qualification. The lead meets therequirements for transfer/handoff from BDR to sales rep.Sales Qualified Lead (SQL): a qualified opportunity, sourcedthrough inbound/outbound effortsClosed BusinessCustomer: a closed won opportunityTeleprospecting Generated Lead (TGL): a lead sourced throughBDR outbound efforts (i.e. did not engage with any previousmarketing campaigns) and meets the requirements for transfer/handoff from BDR to sales repMarketing Qualified Lead (MQL): a lead ready for sales attentionbased on marketing and/or BDR qualification (i.e. the sum ofinbound/outbound BDR transfers plus leads passed directly tosales reps)A Modeling Approach to Lead Generation9
Why it WorksWithin the Demand Waterfall are obvious metrics that are jointly owned by marketing and sales.Let’s review them below.Production MetricsPerformance against plan for all waterfall stages (e.g. MQLs/segment, MQLs/rep, % to plan)Conversion MetricsPerformance against plan for all funnel assumptions (e.g. %MQLs the convert to SALs)Heavier emphasis on “handoff points” – i.e. AQLs, MQLs, SQLs assignals of lead qualityActivity MetricsCalls/emails logged against each lead within a given time periodSLA compliance (e.g. % leads accepted/rejected on time, % leadscalled on time, % leads that received appropriate number ofcalls/emails) by segment, by rep, by lead scoreA Modeling Approach to Lead Generation 10
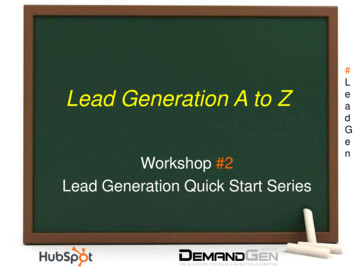
How to Set Up Smart Reporting SystemsOnce you’ve nailed down the metrics you want to track,it’s just a matter of getting all the data in one place andsetting up smart reporting systems. Below is an example ofa marketing dashboard that shows performance against KPIsusing the Demand Waterfall framework. This kind of viewallows you to see how you’re performing at the highest levelagainst plan, as well as drill down into specific channels andcampaigns to understand what’s working and what’s not.A Modeling Approach to Lead Generation 11
Common Pitfalls to AvoidExcel HellReal-Time Campaign TrackingSince marketers rely on so many tools to get things done, figuringout what’s working and what’s not across different campaignsand channels is a real challenge. First you have to get the data alltogether, in the same format, and ready for analysis. But who hastime to pull CSV exports from Eloqua, Google Analytics, Salesforce,LinkedIn, Twitter, Facebook, Wistia, and GoToWebinar (just to name afew) and hack it together in Excel? Based on a recent survey, 62% ofmarketers are frustrated by how long it takes to create reports onmarketing data2. And if it takes too long, you end up not analyzingyour data as often as you should. Often marketing reportingbecomes a post mortem exercise, which makes it impossible toiterate on campaigns you’re running right now. That’s not going towork. Marketers need to find a way to get their data together andset up recurring reports so you can spend more time analyzingperformance and less time data jockeying in Excel.Say you launch a campaign on March 1, and by March 13 you’vegenerated 143 leads and 2 opportunities. Your boss asks how thecampaign is going how do you respond? How do you know ifyour current results are good or bad? If the goal was 70 leads and1 opportunity, then you know things are going well. But what ifthe goal was 200 leads and 10 opportunities – have you failed?Or do you expect more leads to come in, and more leads to beconverted to opportunities over time? What you really need to knowis what the goal is at this point in the campaign, and then compareperformance against that. This concept of lag should be based oncampaign start and end dates, as well as your funnel assumptions forlead to opportunity to deal. For example, if you know the campaignis running through the end of April, you could assume a lineardistribution of leads from March 1 to April 30. Then based on whenthe leads come in, you could assume how long it should take forthose leads to be converted to opportunities – let’s say on averageit’s 10 days. Then it’s just a matter of simple math to determine howyou’re doing against your lead and opportunity goals. In this case,you can confidently say you’re hitting it out of the fMQb2.99A Modeling Approach to Lead Generation 12
Are you ready to take a stab at creating your own lead-generation model? Contact asales rep to get started or visit our marketing solutions page for more information.About Logi AnalyticsLogi Analytics is the leader in self-service analytics, delivering tools designed tomeet the needs of users, IT and product managers. At Logi, we are re-imagininghow software can empower individuals, and the organizations and productsthat serve them, with analytics that can be embedded directly into the businessapplications people use every day. From interactive dashboards to ad hoc queriesand visual analysis, Logi enables users to explore and discover insights, and makedata-driven decisions.More than 1,600 customers worldwide rely on Logi. The company is headquarteredin McLean, Virginia, with offices in the U.K. and Europe. Logi Analytics is a privatelyheld, venture-backed firm. For more information, visit LogiAnalytics.com.A Modeling Approach to Lead Generation 13
Establish a data-driven approach to lead generation How to establish a common framework across sales and marketing to improve conversion rates throughout the funnel And how to measure performance wit