Transcription
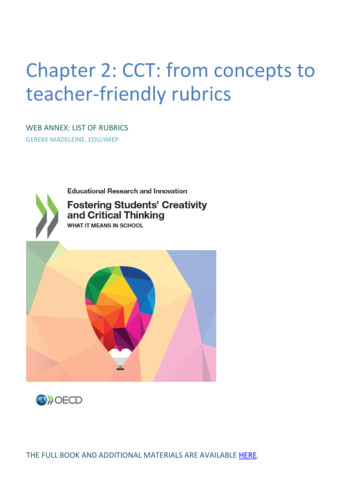
Education at a Glance: OECD Indicators (OECD, 2019[1]) is the authoritative source for information on the stateof education around the world. It provides data on the structure, finances and performance of education systemsin OECD and partner countries.United States In 2018, an average of 49% of 25-34 year-olds in the United States had attained tertiary education whichwas higher than the OECD average of 44% but lower than 9 other OECD countries. The United States spends USD 30 165 1 per student enrolled in tertiary educational institutionseach year, the second highest amount after Luxembourg. Average actual salaries (including bonuses and allowances) of teachers in primary and secondaryeducation in the United States are higher than the OECD average. However, U.S. teachers earn lessthan 70% of the salaries of full-time, full-year workers (25-64 year-olds) with tertiary education in theUnited States, some of the lowest relative earnings across all OECD countries. Despite increasing awareness of the importance of high-quality early childhood education and care(ECEC), enrolment in ECEC at the age of 3 in the United States is 35 percentage points below theOECD average.Figure 1. Distribution of 25-34 year-olds with tertiary education, by level of tertiary education (2018)Note: Some categories might be included in other categories. Please refer to Education at a Glance Database, http://stats.oecd.org for details.1. Year of reference differs from 2018. Refer to Table A1.1 for more details.Countries are ranked in descending order of the total percentage of tertiary-educated 25-34 year-olds.Source: OECD (2019), Education at a Glance Database, http://stats.oecd.org. See Source section for more information and Annex 3 for notes(https://doi.org/10.1787/f8d7880d-en).1Values reported in equivalent US dollars (USD) have been converted using purchasing power parities (PPPs)for GDP. OECD 2019
2 Few students will pursue tertiary education beyond a bachelor’s degree although therewards are high in the labour market In the United States, the share of young adults (25-34 year-olds) with a tertiary degree increased by8 percentage points between 2008 and 2018 to reach 49%, compared to the OECD average of 44%.However, the national figure conceals wide variation across states. In 2017, the rate varied within theUnited States from 32% in Louisiana and West Virginia to 73% in the District of Columbia (OECD, 2019[2]). The most common tertiary qualification among young adults in the United States is a bachelor’s degree,which was held by 28% of all 25-34 year-olds in 2017, compared to 24% on average across OECDcountries. Short-cycle tertiary degrees were also more common in the United States: 10% of 25-34 yearolds had attained this level, compared to 8% across OECD countries. The total share of students completing a bachelor’s degree within the theoretical duration of theprogramme is 38%, about the same as the average among countries with available data (39%). However,a further two years after the theoretical duration, 69% of U.S. students have graduated, slightly above theaverage of 67% three years after the theoretical duration. Men are more likely to delay completion thanwomen: their completion rate within the theoretical duration of the programme is 10 percentage pointslower than that of their female counterparts but after two years, they have narrowed the gap to6 percentage points. Fewer 25- to 34-year-olds in the United States pursue education beyond the bachelor’s degree than inmany other OECD countries. Only 11% of young adults have attained a master’s or doctorate comparedto 15% on average across OECD countries (Figure 1). Although tuition fees for master programmes inpublic institutions in the United States are the highest across OECD countries with data, the relativeearnings advantage of a higher degree is larger in the United States than in most other countries. Onaverage, adults with a master’s or doctoral qualification earn 131% more than those with upper secondaryeducation (OECD average: 91%). The United States is very attractive to international students and takes in 26% of all international orforeign students studying at tertiary level in OECD member countries, the largest share among OCEDcountries. However, this large share still only accounts for 5% of all students in tertiary education inthe United States. Students from Asia form the largest group of international students enrolled inthe United States. About one-third (33%) of international students studying in the United States comefrom the People’s Republic of China, 14% from India and 6% from Korea. International students makeup a small share of students in short-cycle tertiary (2%) and bachelor’s or equivalent programmes (4%),but a significant share of students enrolled in master’s or equivalent (13%) and doctoral or equivalentprogrammes (26%).The United States has both high tuition fees and a large share of students receivingloan and grant assistance Among OECD countries, the United States spends the fifth highest proportion of its gross domesticproduct (GDP) on primary to tertiary educational institutions (6.0% compared to the OECD average of5.0%), with expenditure at the primary and secondary level about the same as the OECD average (3.5%)but above-average expenditure at the tertiary level (2.5% vs. 1.5% on average across OECD countries). Annual expenditure per student on tertiary educational institutions was more than double the spendingon primary education (USD 12 184 in primary education against USD 30 165 in tertiary education) andincreased by 7% between 2010 and 2016. While most OECD countries allocate a greater share of theirtertiary spending to research and development (R&D) than they do to ancillary services, the opposite istrue in the United States: 14% of spending on tertiary institutions was devoted to ancillary services and12% to R&D, compared to 5% and 29% respectively on average across OECD countries. OECD 2019
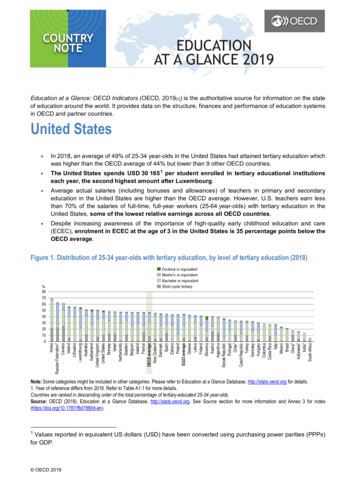
3 After transfers between the public and private sectors, private sources account for 65% of the total fundingfor tertiary educational institutions in the United States, more than double the OECD average. Of this,more than two-thirds is provided by households, mostly in the form of tuition fees, which are among thehighest across OECD countries with data. In 2017, U.S. public tertiary institutions charged USD 8 804 ayear on average for a bachelor’s degree, an increase of about 30% since 2007. Tuition fees in the United States differ by type of institution. Independent private institutions chargenational students about USD 29 500 per year on average at the bachelor’s level, more than three timesthe average fee in public institutions. The differences in tuition fees between national and out-of-state/foreign students in the United States are also among the largest in the OECD. In 2017, public institutionscharged out-of-state national students and foreign students enrolled at the bachelor’s level USD 16 000more on average than they charged in-state national students. Public financial support helps alleviate the financial burden on students. About 89% of bachelor’s nationalstudents benefit in the United States from public loans, grants or both. An increasing share of studentloan repayments are made on income-driven repayment plans. Despite the high tuition fees, the returns individuals can expect to receive over the course of their careerafter completing a tertiary education typically exceed the costs they bear during their studies. Adultworkers with a tertiary qualification in the United States earn 72% more than those with upper secondaryeducation, compared to 57% more on average across OECD countries. As a result, the net financialreturn on a tertiary education is higher in the United States than in most countries: USD 354 800 onaverage for women and USD 542 600 for men, compared to USD 240 000 and USD 310 300 on averageacross OECD countries.Percentage of U.S. graduates completing science-related fields is similar to the OECDaverage The science, technology, engineering and mathematics (STEM) fields – which encompass naturalsciences, mathematics and statistics; information and communication technologies (ICT); andengineering, manufacturing and construction – are seen as especially important for fostering innovationand economic growth. In the United States, about 25% of tertiary-educated adults had studied STEMfields in 2018, a similar proportion to the OECD average. Among STEM fields, the fields that attract thelargest shares in the United States are natural sciences, mathematics and statistics and engineering,manufacturing and construction. Each of these fields represented about 10% of the degrees held bytertiary-educated adults. While this was higher than the average across OECD countries for naturalsciences, mathematics and statistics (5%), a lower share of U.S. tertiary-educated adults held a degreein engineering, manufacturing and construction than the OECD average (16%). In many countries, the broad field of business, administration and law is the most popular field of studyat tertiary level but in the United States, the most common bachelors field is arts and humanities, socialsciences and journalism and information. The United States has the largest share of tertiary-educatedadults who studied this field during their bachelors (30%), much higher than the OECD average of 19%. In the United States, 82% of tertiary-educated adults are employed, slightly below the OECD average of85%. The employment rate varies across states, ranging from 77% to 90%. It also varies by bachelor’sdegree field of study: in the United States, those who studied education have the lowest employment rate(80%) while those who studied engineering, manufacturing and construction have the highest (88%). Individuals with a bachelors degree in the fields of education or of arts and humanities, social sciences,journalism, and information earn less, on average, than adults with a tertiary degree in STEM or inbusiness, administration and law (Figure 2). Although ICT is one of the highest-paying field of study inthe United States, only 4% of 25-64 year-olds hold a bachelors degree in this field. OECD 2019
4 Figure 2. Relative earnings of tertiary-educated adults, by field of study (2017)25-64 year-old tertiary-educated workers (full- and part-time workers); upper secondary education (all fields) 1001. Data refer to the field of study at the bachelor's level.2. Earnings net of income tax.3. Earnings refer to academic programmes only.4. Arts and humanities, social sciences, journalism and information does not include the subfield of Languages.5. Year of reference differs from 2017. Refer to the source table for details.Countries are ranked in descending order of the relative earnings of 25-64 year-olds with a tertiary degree in information and communication technologies.Source: OECD (2019), Table A4.4. See Source section for more information and Annex 3 for notes (https://doi.org/10.1787/f8d7880d-en).Gender gaps in education and employment persist On average across OECD countries, the gender gap in employment rates decreases with educationalattainment. This trend also holds in the United States, where the gender gap in employment is particularlyhigh among 25-34 year-olds with below upper secondary education. For this age group, the employmentrate is 73% for men and 41% for women, a difference of 32 percentage points, compared to the averagedifference of 28 percentage points across OECD countries. The gap shrinks to 14 percentage pointsamong U.S. adults with upper secondary or post-secondary non-tertiary education and to 7 percentagepoints among those with tertiary education. The earnings gender gap extends across all levels of educational attainment. Although women generallyhave higher educational attainment, there is a large gender gap in earnings between male and femalefull-time tertiary-educated workers. In the United States, tertiary-educated 25-64 year-old women earnonly 71% of what their male peers earn. This gender gap is wider than for all other OECD countries exceptfor Chile, the Czech Republic, Hungary, Israel, Italy, Mexico, Poland and the Slovak Republic. In the United States, a significantly larger share of men than women studied STEM fields at the bachelorslevel of education (about 14% of women compared to 34% of men). These differences may contribute tothe overall lower earnings of women compared to men: Adults who studied STEM fields earn over twicethe earnings of a worker with an upper secondary education, whereas those who studied education, alarge share of which are women, are the lowest-paid in the country (Figure 2). Women tend to be under-represented at the doctoral level even in fields that are more balanced at master’slevel. In the United States, while 50% of those graduating in natural science, mathematics and statistics atmaster’s level were women in 2017, women made up only 42% of doctoral graduates in this field. OECD 2019
5Enrolment in early childhood education and care in the U.S. is lower than the OECDdespite increasing awareness of its importance Enrolment in early childhood education and care (ECEC) has experienced a surge of policy attention inOECD countries in recent decades. Universal or near-universal participation in at least one year of earlychildhood education and care is now the norm in OECD countries, which represents significant progresstowards one of the education targets of the United Nations’ Sustainable Development Goals (SDG 4.2.2).The enrolment rate for 5-year-olds in pre-primary or primary education is 90% in the United States,slightly below the OECD average of 94%. Enrolment in ECEC before the age of 5 is less widespread in the United States than in most OECDcountries. On average, 88% of 4-year-olds in OECD countries are enrolled in pre-primary and primaryeducation while in the United States the share is 66%. Among 3-year-o
In many countries, the broad field of business, administration and law is the most popular field of study at tertiary level but in the United States, the most common bachelors field is arts and humanities, social sciences and journalism and informationThe. United States has the largest share of tertiary-educated