Transcription
JOURNAL OF LATEX CLASS FILES, VOL. 14, NO. 8, AUGUST 20151Supporting Story Synthesis: Bridging the Gapbetween Visual Analytics and StorytellingSiming Chen, Jie Li, Gennady Andrienko, Natalia Andrienko,Yun Wang, Phong H. Nguyen, and Cagatay TurkayAbstract—Visual analytics usually deals with complex data and uses sophisticated algorithmic, visual, and interactive techniquessupporting the analysis. Findings and results of the analysis often need to be communicated to an audience that lacks visual analyticsexpertise. This requires analysis outcomes to be presented in simpler ways than that are typically used in visual analytics systems.However, not only analytical visualizations may be too complex for target audiences but also the information that needs to bepresented. Analysis results may consist of multiple components, which may involve multiple heterogeneous facets. Hence, there existsa gap on the path from obtaining analysis findings to communicating them, within which two main challenges lie: information complexityand display complexity. We address this problem by proposing a general framework where data analysis and result presentation arelinked by story synthesis, in which the analyst creates and organises story contents. Unlike previous research, where analytic findingsare represented by stored display states, we treat findings as data constructs. We focus on selecting, assembling and organizingfindings for further presentation rather than on tracking analysis history and enabling dual (i.e., explorative and communicative) use ofdata displays. In story synthesis, findings are selected, assembled, and arranged in meaningful layouts that take into account thestructure of information and inherent properties of its components. We propose a workflow for applying the proposed conceptualframework in designing visual analytics systems and demonstrate the generality of the approach by applying it to two diverse domains,social media and movement analysis.Index Terms—Story Synthesis, Visual Analytics, Social Media, Spatio-temporal Data.F1I NTRODUCTIONOV er the decades of the development of visual analyticstechniques, researchers created sophisticated visualanalytics tools for analysts to explore complex problemsinvolving large amounts of data. However, when such toolsand findings are demonstrated to those who lack visualanalytics knowledge and skills, it is not unusual to getfeedback such as “fancy visuals, cool interactions, but whatdoes this mean?”. It is often hard for a general audienceto understand composite and multifaceted analysis resultsrepresented in advanced visual interfaces that have beenprimarily designed to support analysis – leading to a gapbetween obtaining analytical results and presenting themin an accessible way. How to bridge this gap, i.e., how toproceed from data analysis to result communication, is theresearch problem we address in this paper.The communication of information is an important capability of visualization. Recently, visual storytelling isreceiving high attention in the information visualizationcommunity, where researchers develop authoring tools tocreate stories and provide visual support for storytelling [1].The main foci of the storytelling-oriented research are theprinciples of story design [2] and tools that facilitate thedesign process [3], [4], [5]. Our focus is different and com- S. Chen, G. Andrienko and N. Andrienko are with Fraunhofer InstituteIAIS, Germany. S. Chen is also with University of Bonn, Germany.{siming.chen, gennady.andrienko, natalia.andrienko}@iais.fraunhofer.deJ. Li is with Tianjin University, China. jie.li@tju.edu.cn.Y. Wang is with Microsoft Research Asia, China. wyawxy@gmail.comG. Andrienko, N. Andrienko, P.H. Phong, C. Turkay are with City, University of London, UK.{Phong.Nguyen.3, Cagatay Turkay.1}@city.ac.ukManuscript received April 19, 2005; revised August 26, 2015.plementary to these: how to organize complex multifacetedinformation and prepare them for constructing a story.Our research responds to the calls of the research community for an integrated and seamless “data analysis tostorytelling pipeline” [6], [7]. So far, the research on thecommunication of visual analytics results has been mostlyfocusing on storing, annotating, and organizing analysisbookmarks or display states, possibly, after some simplification (see sect 3.2). However, when the recipient is onlyinterested in seeing the analysis results but not in furtherexploration of the data, it may be more appropriate tocommunicate only the findings, i.e., extracted pieces ofinformation, rather than the steps of the analysis that wereused for extracting them. The visual displays that were usedin the analysis process are not necessarily best suited forcommunicating these information pieces and for organizingmultiple disjoint findings in a complete picture. Hence,analysts need methods and tools enabling them to collectfindings in the process of analysis and to synthesize storycontents and create understandable representations fromthese findings.In response to this need, we propose a conceptual framework to inform the design and creation of visual analyticssystems that support story synthesis. We extend the visualanalytics workflow by enabling analysts to extract findingsand to accumulate them in a dedicated workspace, whichis then followed by a story synthesis phase where collecteddisjoint findings are arranged so as to represent explicitlyessential relationships between them and thereby conveythe full picture that has been constructed in the mind ofthe analyst in the result of the analysis. These arranged
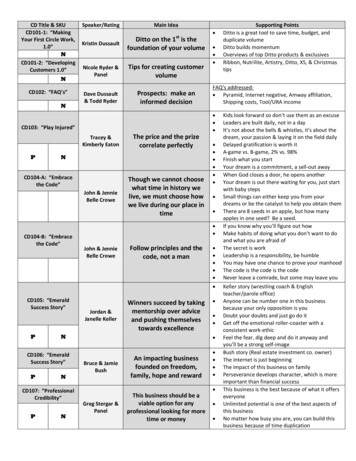
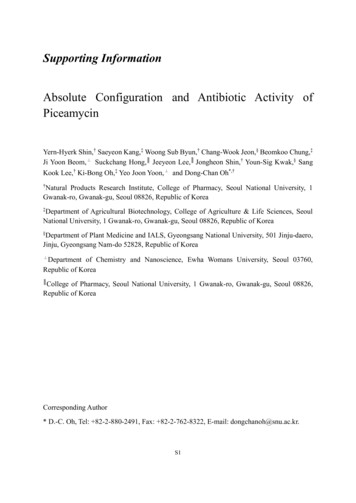
JOURNAL OF LATEX CLASS FILES, VOL. 14, NO. 8, AUGUST 2015findings make the story content, which can be given differentappearances in designing the final story depending on theintended recipient, medium, and other criteria. Our researchrefers to the story content creation as an intermediate stepbetween analysis and story design.We propose a conceptual framework for story synthesis,in which analysis findings are organized into compositestructures based on inherent structural facets (dimensions)of the information. The facets are used for two main purposes: arranging and aggregating. Possible ways to arrangeand aggregate information depend on the nature and properties of the facets. We consider different types of facets,including discrete categories, linearly ordered values, time,and space. We discuss how information arrangements andaggregations are done based on these facet types and taking into account their properties. Organizing informationincludes creation of multi-perspective views and nestedlayouts, which can be used to provide detail on demand.Besides organizing information, story synthesis may involvecreation of comparative views, illustration of findings byexamples, and making annotations.To demonstrate the proposed framework in action, wepropose a workflow to inform visual analytics design forsupporting story synthesis from analysis findings. We applyit to two diverse domains, social media and movement analysis. We discuss in more detail the use of social media data(specifically, geolocated Twitter messages) for analyzingpeople’s reactions to significant events and creating storiesabout these reactions, which have multiple facets to dealwith. Existing works dealing with social media data focuson either analysis [8] or storytelling [9]. Our frameworkshows creation and development of story content duringand after the analysis and prior to storytelling.Our research contribution can be outlined as follows: Bridging the gap: Addressing the problem of conveying analysis results to general audiences, we introduce aconceptual framework in which story synthesis is a necessary activity on the way from analysis to storytelling.We define the essential activities for story synthesis andpropose a general approach in which information facetsare exploited for organizing analysis findings. Demonstrating the approach: We demonstrate the useand generality of the proposed approach by applyingit to complex multifaceted data taken from two diversedomains.In the following section, we introduce our concepts andideas by example. This is followed by an overview of therelated work in Section 3, presentation of our frameworkin Section 4, and demonstration of its application to socialmedia in Section 5. Expert evaluation of our approach isreported in Section 6. We briefly describe an application ofthe framework to a different kind of data in Section 7 anddiscuss the overall work in Section 8.22.1P ROBLEM D EFINITIONA Motivating ExampleTo introduce our concepts, we use an example based on theIEEE VAST Challenge 2011, Mini Challenge 1 [10], requiringanalysis of the circumstances of an epidemic outbreak in2a fictive city Vastopolis. The data are geographically referenced microblog messages, some of which include keywords indicating disease symptoms, such as fever, chills,sweats, aches and pains, coughing, etc. The time span ofthe data is from April 30 to May 20, 2011. An analyst needsto find out when and where the outbreak started and howit developed. The analyst uses a visual analytics systemproviding multiple types of interactive visual displays andsupporting database queries and data transformations.The analyst extracts the messages containing relevantkeywords from the database and, by observing their temporal distribution in a time histogram, determines the time ofthe outbreak start: May 18 (F1). Using a map display and temporal queries, the analyst explores the spatial distributionsof the messages in different days starting from May 18. Sheobserves a dense cluster in the city centre on May 18 and 19 (F2),an additional cluster on the south-west on May 19 (F3), andhigh spatial diffusion of the messages and, simultaneously,dense concentrations around hospitals on May 20 (F4).To understand the differences between the central andsouth-western clusters, the analyst selects the correspondingsubsets of messages by means of spatial queries and createsvisualizations of the frequently occurring words. Seeing thedifferences between the frequent keyword sets, the analystconcludes that there were two different kinds of illness, respiratory disorders in the centre and digestive disorders onthe south-west. The respiratory disorders appeared one dayearlier than the digestive disorders. However, the shapesand relative spatial arrangement of the clusters suggest thatthe two diseases might have a common origin somewhereat a motorway bridge crossing a river.The analyst extracts the subset of messages posted onMay 17 (a day before the outbreak start) in the vicinityof the bridge, looks at the frequent keywords, and findsindications of a truck crash, fire, and spilling of the truck cargoin the river (F5). The analyst also looks at additional dataconcerning the weather and the river flow direction. Theanalyst concludes that the smoke from the fire contaminatedthe air, which was transmitted by the wind to the centreand caused the respiratory disorders, whereas the spilledsubstance contaminated the water in the river and causedthe digestive disorders downstream along the river flow.In the course of the analysis, the analyst has obtaineda set of findings (labelled F1-F5), which include the outbreak start time, the spatial clusters and the times of theirexistence, the differing sets of frequent keywords associatedwith the clusters, the location and time of the truck crash,and the ways of spreading and temporal development oftwo diseases. As the next natural step, these findings needto be communicated to any interested audience. An oftenused method to achieve this is to present the findings in theform of a story. In order to construct a story, though, theanalyst needs to first create the contents of the story basedon the findings, synthesise the contents in structured ways,and then design a presentation that will eventually tell theintended story.As a first required step of the content generation stage,the analyst needs to be able to represent these findings in anexplicit form, extract them from the analytical environment,and collect them in some storage medium. A data structuresuitable for representing a finding is shown in Fig. 1A (note
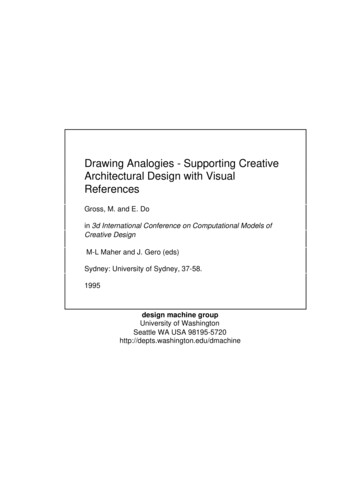
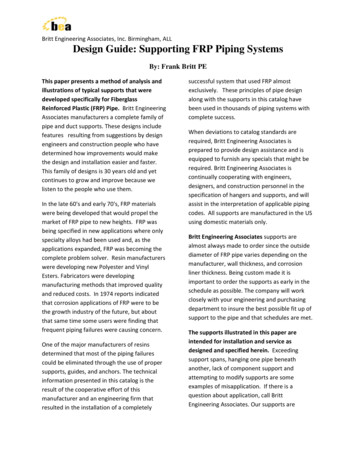
JOURNAL OF LATEX CLASS FILES, VOL. 14, NO. 8, AUGUST 20153A) VAST Challenge 2011 finding structure :: label, time, location, N people, N messages, {(keyword, frequency)}, context B) VAST Challenge 2011 findings F1 (outbreak), time May 18-20, location Vastopolis, N people 27 446, N messages 59 755, {(chills, 10 436), (fever, 7 585), (sick, 6 543), }, null F2 (cluster center-east), time May 18-20, location polygon1, N people 16 479, N messages 32 445, {(chills, 6 511), (fever, 4 905), , (flu, 3 466), }, context {wind west-to-east} F3 (cluster southwest), time May 19-20, location polygon2, N people 6 752, N messages 9 719, {(diarrhea, 2 785), (stomach, 2 682), , (nausea, 766), }, context {river flow north-to-southwest} F4 (hospitals), time May 20, location {(-93.33, 42.24), (-93.42, 42.25), (-93.44, 42.20), }, N people 3 265, N messages 3 276, {{(chills, 1 419), (fever, 1 171), , (flu, 886), }, null f5 (truck accident), time May 17, location (-93.427,42.226), N people 149, N messages 149, {(truck, 127), , (accident, 37), , (burning, 14), , (spilling cargo, 9), }, context {motorway, river bridge} C) Temporal arrangementMay 17May 18May 19May 20D) Spatial arrangementF5 Truck accidentF1 OutbreakTime: May 17N people: 149N messages: 149Context: motorway,river bridgeTime: May 18-20N people: 27,446N messages: 59,755F5 Truck accidentTime: May 17N people: 149N messages: 149Context: motorway,river bridgeF2 Cluster center-eastTime: May 18-20N people: 16,479N messages: 32,445Context: windF3 Cluster southwestTime: May 19-20N people: 6,752N messages: 9,719Context: river flowF4 HospitalsTime: May 20N people: 3,265N messages: 3,276F2 Cluster center-eastTime: May 18-20N people: 16,479N messages: 32,445Context: windF3 Cluster southwestTime: May 19-20N people: 6,752N messages: 9,719Context: river flowF4 HospitalsTime: May 20N people: 3,265N messages: 3,276Fig. 1. The motivating example of VAST Challenge 2011 analysis outcomes: A) a structure suitable for representing the findings; B) the findingscollected in a storage medium; C) the findings arranged along a time line; D) the findings arranged spatially on top of a background map.that some fields in this structure may be undefined), andFig. 1B shows the findings F1-F5 represented in this format.In our framework, we refer such systematically representedfindings as story slices.However, just collecting multiple disjoint informationpieces is insufficient for creating story contents. Story slicesneed to be arranged in appropriate ways revealing the relationships between the information pieces. In our example,for instance, the findings need to be organized accordingto the temporal and spatial relationships between them.Figures 1C and 1D show examples of such arrangementsthat might be created by the VAST Challenge analyst forconveying temporal and spatial relationships between thefindings. Another kind of relationship the analyst may wishto reflect is the differences between the symptoms of the twodiseases. For this purpose, the analyst may juxtapose thelists of the keywords corresponding to the central-easternand south-western clusters. The analyst should be able tocreate and edit such arrangements in order to construct anycompelling story, and they can be effectively supported inthis activity by interactive visual tools.In general, we can define story content as a system ofstory slices arranged according to relevant relationshipsamong them, and story synthesis as the process of storycontent creation by collecting and arranging story slices.To create a final story for communication to the intendedaudience, one needs to design appropriate narrative andappearance for the story content. This includes design ofa suitable narrative structure, creation of suitable visual displays, selection of colours, symbols, and fonts, placement oflabels, etc. The same content can be represented differentlydepending on the intended purpose, kind of the recipient,presentation medium, available time budget for presentingor reading the story, desired emotional impression, andother criteria. For instance, the outcomes from our exampleabove may need to be reported to high-level health caremanagers, or presented to the general public in a newspaperarticle or on TV. For each of these presentations, the samestory can be given a distinct narrative and appearance,which is structured by the creative ideas of presentationdesigners. The design of the story appearance is a differentkind of activity than the story content creation. The focus ofour work is the story synthesis activity, which creates storycontents and structure and thus serves as a bridge betweenanalysis and story design.2.2General DescriptionVisual AnalyticsStorytellingGoalGoalSupport Analysts to gain valuable information from dataBridging GoalUsersAnalysts - Trainedand experiencedActive: produce analysis resultsHelp analysts to presenttheir results appropriately tothe audienceEnable audience to perceiveand understand informationfrom a storyUsersGeneral audience - No specialknowledge and experiencePassive: perceive analysis resultsGapDisplay ContentDisplay ContentShow primary dataInclude all dataInclude all aspectsDisplay PropertiesSupport seeking patternsComprehensive viewsAdvanced visual interfacesQ1: How to transform complex analysis results intosimpler information pieces?Q2: How to organize multipledisjoint findings in a coherentstory?Q3: How to show multipleperspectives on complexinformation?Show derived informationInclude selectedinformation piecesInclude selected aspectsDisplay PropertiesSupport seeing patternsReduced need for interactionFocused viewsFig. 2. Conceptualizing the gap between visual analytics and storytelling. Based on comparing the respective goals, users, display content, and display properties, the research is driven by asking the threesynoptic questions.The gap between visual analytics and communication ofanalysis results can be conceptualized as shown schematically in Fig. 2. Visual analytics systems are meant for
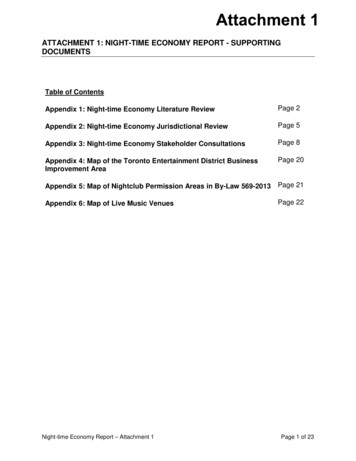
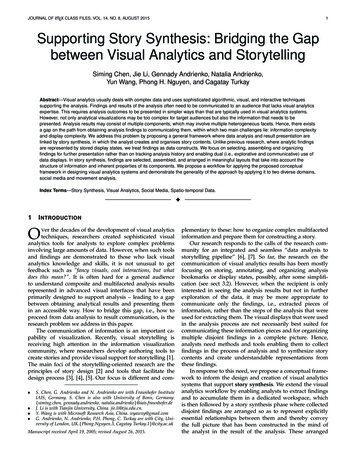
JOURNAL OF LATEX CLASS FILES, VOL. 14, NO. 8, AUGUST 2015solving complex and ill-defined problems with the use ofinteractive visual displays and computational analysis techniques [11]. Visual analytics requires a possibility to see allaspects of complex data and explore their interrelationships,which is usually supported by multiple coordinated viewsand sophisticated interaction techniques. On the contrary,storytelling is meant to convey only interesting and/orimportant information extracted through the analysis, andthis information should be presented in a simple and easilyunderstandable way [2], [12].In short, visual analytics and storytelling essentiallydiffer in their purposes, target users, kind of informationdealt with, and methods of presenting the information andinteracting with it. Therefore, to support telling stories ofvisual analytics findings, there should be an intermediatestep between analysis and storytelling, in which the analystassembles and organizes information pieces to be communicated. We refer to this step as story synthesis (Fig. 3).Its purpose is to prepare analysis results to communication: select, assemble, summarize, transform to a suitablerepresentation, arrange, and annotate. In a recent positionarticle, Lee et al. [6] propose a multi-stage pipeline startingfrom exploring the data and curating findings to eventuallyforming visually shared stories. They identify “Help PeopleMake a Compelling Story” and “Make It Easier to Tell a Story”as two high level challenges for further research and mention how current systems fall short in collecting, organizingand structuring excerpts in producing a visual story, pointingexactly at the gap that we aimed to address in our work.Bridge the gapVisual AnalyticsStory SynthesisStorytellingWorkflow connecting two partsDerive FindingsSelect, Manage andOrganize FindingsPresent and Communicate FindingsFig. 3. Proposed framework for bridging the gap.Unlike purely computational analysis methods, whichtypically produce a single result such as a model, interactive visual analysis often yields multiple findings obtainedthrough different interactions, as in the example in Section 2.1. The mind of the analyst may contain the wholepicture (i.e., a mental model of the analysis subject [13])in which these findings are associated. However, in theexternal representation, the findings may be disjoint, as inFig. 1B. To enable presenting the full picture in a story, theanalyst needs to represent explicitly essential relationshipsbetween the findings. This can be achieved by arranging thefinding according to these relationships, as in Fig. 1C and D.We refer to pieces of information that need to be assembled and arranged as story slices. Having suitably organizedstory slices, the analyst or even another person can constructa story that communicates the analyst’s mental model torecipients. In existing works, stories are composed fromannotated screen shots or states of analytical displays [14].While this kind of material can be useful to a story designer,it may not be well suited for communication because it4inherits the complexity of visual analytics displays and alsocontains extra information that is not essential for conveyingthe story. The goal of the story synthesis stage (Fig. 3) isto transform the raw materials of analysis findings intostory slices arranged according to important relationshipsbetween them. These arrangements can be used for composing the whole final story as defined by Lee et al. [6].Summarizing our arguments, we state that creation ofa story involves two kinds of activities: preparation of thecontent, referred to as story synthesis (Fig. 3, middle), anddesign of the presentation of the prepared content, referredto as storytelling (Fig. 3, right). The presentation designactivity is supported by the principles and approaches developed in the research on storytelling [1], [2]. For example,choosing a suitable order for presenting story slices can bebased on the work by Hullman et al. [15]. Our work mostlyfocuses on the content creation activities, which includegenerating and organizing story slices.33.1R ELATED W ORKVisual StorytellingWe investigate the works on using visual storytelling forpresenting data and findings with a primary focus on ideasand approaches related to creation of story contents.As one of the early papers that stress the importanceof storytelling in visualization, Gershon and Page [12] emphasize the importance of choosing an optimal amount ofinformation to deliver a message, and discuss how data visualizations can be arranged to generate story-like representations. Kosara and Mackinlay [16] discuss future researchdirections in visual storytelling with a focus on the narrativestructure of the stories. Ma et al. [7] point at the limitationthat visualizations used in a visual story are often createdafter the fact and call for an integrated process. These workshighlight the need to link visual analytics and storytelling.In their influential paper [2], Segel and Heer presenta framework for the design of narrative visualizationsand identify techniques in data-driven storytelling research.McKenna et al [17] define and investigate a design spacefor the narrative structure and introduce a number of factors that can affect the experience of the audience. Thisstudy, as well as the discussion of the visualization rhetorictechniques by Hullman et al. [18], provide useful ideas fororganizing story contents. Ren et al. [19] focus on the roleof annotations in data-driven storytelling and presents a design space for chart annotations. Brehmer et al. [20] present adesign space for storytelling focusing on the temporal aspectalone. Bach et al. [21] introduce the concept of “data comics”and explore how the established elements and rules of thecomics genre can be employed for storytelling with data.Apart from stories, dashboards is another widely usedmedium for presenting data to users [22], [23]. Thus,Mckenna et al. designed a dashboard visualization forcyber security analysis [24]. Commercial tools, such asTableau [25], Power-BI [26], Airtable [27], etc., can be usedfor creating shareable and customized visualizations to communicate data-based stories.These works lay the foundations for constructing visualnarratives regarding both story structure and presentation
JOURNAL OF LATEX CLASS FILES, VOL. 14, NO. 8, AUGUST 20155Fig. 4. The framework for integrating visual analytics, story synthesis, and storytelling is illustrated by an example of social media data.design. Relevant to our research are the ideas concerningthe organization of story contents.3.2 Storytelling in Visual AnalyticsStorytelling has also attracted significant interest in visual analytics literature. GeoTime [28] is one of the earliest visual analytics systems that support storytelling. Thestory is composed of texts and hyperlinks connecting tobookmarked visualizations, which may include graphicalannotations. The visualizations are saved so that they canbe restored in exactly the same appearance as when theywere captured, allowing further exploration along withreading the story. HTVA [14] allows constructing a storyby arranging thumbnails of visualization bookmarks basedon their time and/or space references. Bookmarks can alsobe arranged manually and connected by explicit links. Inthese ways, story creators can convey temporal, spatial, andcausal relationships between information pieces containedin visualizations. Walker et al. [29] discuss possibilities forapplying storyboarding principles from film industry. Forexample, the viewpoint principle translated to presentingdata states that a storyboard should provide different perspectives on the data, which may include data and displaytransformations.Besides manual bookmarking, automatic capture of analytic provenance [30] is also commonly used to constructstories. SenseMap [31] automatically captures and visualizesusers’ actions, enabling the users to curate relevant information pieces, organize them, and communicate the analyticalfindings. Gratzl et al. [32] introduce an authoring tool thatconstructs a story based on provenance capture, adds textand drawing annotation, and plays back the story as it wasoriginally performed. TimeLineCurator [3] focuses on thetemporal aspect, facilitating the timeline creation processfor journalists by automatically extracting event data fromunstructured text documents and encoding them along avisual timeline. System KnowledgePearls [33] automaticallygenerates and stores structured data describing visualization states and uses these data for finding visualizationscorresponding to users’ queries. Such functions could bepotentially useful for story synthesis, but the authors do notconsider this application for their ideas.Visual analytics systems often include multiple interactive views, which may be too complex for communicationof analytical findings to people that are not visual analyticsexperts. Besides, a common way to show a visualizationbookmark is using a thumbnail of the entire system [28],which might be too small for a complex graphic to be understood. Therefore, display simplification and/or providinginterpretation aids are required. GAV [34] provides a storymode that simplifies the interface and excludes advancedfeatures, enabling the viewers to focus on the essentialelements. A visual analytics system may allow the analystto choose a single visual component from the entire system [29] or select a portion of the interface that emphasizesthe main message [35]. HTVA [14] allows adding a simpleoverlay describing the visual encoding and data filtering.SenseMap [31] helps construct a story with multi-level semantics that can be flexibly presented to the audience withdifferent backgrounds and needs.The difference of our approach from the previous workis that we consider construction of stories not from completevisualizations [28] or their components [29] or analysisbookmarks [31] but from structured data representing findings extracted during the process of analysis. The visualrepresentation for these data is chosen according to theirstructure. It may differ from the original representation usedin the process of analysis; moreover, these structures areanalytical artefacts that are not present in visualizations oforiginal data, as in the example in (Fig. 1A,B). As derivedinformation pieces, analysis findings are similar to explicitlydefined concepts, which can be created in the course ofanalysis and organized in concept maps [36], [37]. However,a concept map may not be the most appropriate representation form for findings having complex structure and linkedby different kinds of relationships.3.3Visual Analytics ApplicationsSince our illustrating examples relate to the social mediaand movement analysis domains, we briefly discuss theworks dealing with data from these domains with a focuson pertinent information facets and storytelling.The application of visual analytics to social media issurveyed in [38]. Dou et al. [39] apply text processing to
JOURNAL OF LATEX CLASS FILES, VOL. 14, NO. 8, AUGUST 2015identify meaningful events and characterize them in termsof four facets, called “4 Ws: who, what, when, and where”,which can be then interactively explored. Xu et al. [40]and Sun et al. [41] propose a river-based metaphor toanalyse evolution of topics over time. WeiboEvents analysereposting structure of a single message [42]. For multiple messages, Chen et al. propose a series of map-basedvisual metaphors to visualize ego-centric information diffusion and event evolution [8], [43]. Whisper visualizesinformation diffusion in spa
create stories and provide visual support for storytelling [1]. The main foci of the storytelling-oriented research are the principles of story design [2] and tools that facilitate the design process [3], [4], [5]. Our focus is different and com- S. Chen, G.