Transcription
Chapter 4The Dose-ResponseRelationship
Introduction The need to establish some criteria to base the relative safety ofchemicals is essential. Several methods are used to obtain data in order to establish safelevels and provide information about the relative toxicity ofchemicals.
Acute Toxicological Studies (1) Information concerning the toxicity of a substance is obtainedprimarily from either acute or chronic toxicity studies. Acute toxicity studies are the most commonly performed studies forobtaining information on the effects of chemical exposure. They areshort-term, relatively inexpensive tests with death of the test animalbeing the useful observed effect. Information obtained from acute toxicity tests can be used to– determine the relative toxicity of different chemicals comparing the respective LD50values, which are the doses that prove to be lethal for 50 percent of the test animals;– identify the target organs (heart, liver, kidneys, etc.) that are affected as a result ofexposure; and– determine the appropriate doses for long term, chronic studies.
Acute Toxicological Studies (2) To perform acute toxicity studies the test animal population is dividedinto several groups, with an equal number of individuals (usually 10 to50) in each group. One group of test animals –referred to as thecontrol group – is exposed to all the same experimental conditionsexcept exposure to the toxic substance. The groups are observed for 14 days, and the number of deaths in eachgroup is recorded.
Acute Toxicological Studies (3) LC50 is a measure of chemical toxicity resulting from inhalation. LCmeans “lethal concentration” and the subscript has the same meaning asdescribed previous for LD. The unit of measure for the LC50 is usuallyexpressed as part per million (ppm).
Chronic Toxicological Studies (1) Chronic toxicity tests may be performed over a period of months, years,or the lifetime of the test animal. Doses of the toxic substance areselected to assure that most of the animals will survive the entire timethe study is performed. Different species of test animals may be more or less sensitive to thesame toxic chemical. Males and females of the same species may respond differently to thesame substance. Although acute and chronic studies provide useful information inevaluating chemical toxicity, it is important to understand that they arenot truly representative of the environment to which people are exposedin everyday life.
Chronic Toxicological Studies (2) Characteristics of animal studies–––––A single doseA single route of exposureThe number of animals exposed is small.The genetic make-up of the population is not very diverse.Only individuals in good health and/or of the same sex are selected. In reality– Several different routes– Exposure to more than one chemical at a time– Greater genetic variability in a larger population – the range ofresponses to a given chemicals more diverse.– The collective interactive effect of all these factors on toxicitymakes it difficult to establish a cause-effect relationship.
Dose-Response Curves (1) The major purpose for performing acute and chronic toxicity studies isto establish a cause-effect relationship between exposure to a toxicsubstance and an observed effect in order to determine a safe exposurelevel. A curve can be drawn that illustrates the relationship between the doseadministered and the observed response. This curve is referred to asthe dose-response curve. A dose-response curve can be developed form most chemicals. Fromthese curves the threshold level and the relative toxicity of chemicals canbe obtained to help establish safe levels of chemical exposure.
Dose-Response Curves (2) The threshold is the dose below which no effect is detectedor above which an effect is first observed. The threshold information is useful information inextrapolating animal data to humans and calculating whatmay be considered a safe human dose for a given toxicsubstance. The threshold dose (ThD0.0) is measured as mg/kg/day. Itis assumed that humans are as sensitive as the test animalused. To determine the equivalent dose in man the ThD0.0is multiplied by the average weight of a man, which isconsidered to be 70 kg.
Dose-Response Curves (3) The calculation used to determine the safe human dose(SHD) is as follows:ThD 0.0 70 (kg)SHD Amount mg/day of toxic substanceSFWhereSHDThD0.070 KgSF Safe Human Dose Threshold dose at which no effect is observed. Average weight of a man Safety factor (ranges from 10 to 1000, which variesaccording to the type of test and data used toobtain the ThD0.0.
Terminology Associated withDose-Response Curves (1) No observed effect level (NOEL)– The highest tested dose of a substance that has beenreported to have no harmful (adverse) health effects onpeople or animals. No observed adverse effect level (NOAEL)– It denotes the level of exposure of an organism, found byexperiment or observation, at which there is nobiologically or statistically significant (e.g. alteration ofmorphology, functional capacity, growth, developmentor life span) increase in the frequency or severity of anyadverse effects in the exposed population whencompared to its appropriate control.
Terminology Associated withDose-Response Curves (2) lowest-observed-effect-level (LOEL)– Lowest concentration or amount of a substance, foundby experiment or observation, that causes any alterationin morphology, functional capacity, growth, development,or life span of target organisms distinguishable fromnormal (control) organisms of the same species andstrain under the same defined conditions of exposure lowest-observed-adverse-effect-level (LOAEL)– Lowest concentration or amount of a substance, foundby experiment or observation, which causes an adversealteration of morphology, functional capacity, growth,development, or life span of a target organismdistinguishable from normal (control) organisms of thesame species and strain under defined conditions ofexposure.
Terminology Associated withDose-Response Curves (3) Frank-effect level (FEL)– Level of exposure that produces unmistakable andirreversible effects (such as impairment or mortality)at statistically significant increased severity orfrequency.– The level where overt effects are observed is referred toas the Frank-effect level.
Threshold Dose Dose below which no adverse effects are observable in apopulation of exposed individuals. Threshold dose approximated by a NOAEL (No ObservedAdverse Effect Level)
Non-threshold Effects Thresholds are assumed not to exist for genotoxiccarcinogens
Safe Dose for Threshold Effect NOAEL approach– Identify the adverse effect that occurs at the lowest dose– Determine the NOAEL or LOAEL for that endpoint– Divide NOAEL/LOAEL by uncertainty factors
Acceptable Daily Intake ADI estimated (maximum) amount of an agent, expressedon a body mass basis, to which a subject may be exposedover his lifetime without appreciable health risk (also TDI,tolerable daily intake) ADI derived from NOAEL by the use of uncertaintyfactors UFs (or safety factors SFs)
Reference Dose (RfD) RfD is an estimate of the daily exposure that is likelyto be without appreciable health effect even ifcontinued exposure occurs over a lifetime.
Uncertainty Factors Default values:UFinterspecies 10 , UFhuman variability 10
Additional Uncertainty Factors Sometimes applied:– UFLOAEL-NOAEL 3 or 10– UFsubchronic-chronic 3 or 10– UF database insufficiences up to 10 MF, modifying factor for professional judgement: upto 10 RfD NOAEL (or LOAEL) / UF1 UF2 UF3 MF
Benchmark Dose Approach (1) NOAEL approach uses only single points, shape ofdose-response is ignored. Bench mark dose (BMD) is calculated from the curvefitted to the dose-reponse data, so all information isused. BMD can only be used when available data aresuitable for modelling. Not replacement for NOAEL, but additional tool
Benchmark Dose Approach (2)1. A mathematical model is applied to theexperimental data to produce a dose-response curveof best fit.2. By statistical calculation an upper 95% confidencelimit of the curve is determined3. The Benchmark Response is defined as 10% (or 5%,or 1%).4. The Benchmark Dose corresponds to the benchmark response on the upper confidence limit curve.
Benchmark Dose Approach (3)
Non-threshold? Absence of a detectable effect at low doses is eitherbecause the dose is below a threshold or because theresponse is below the level that can be detected by thetest sytem.
Threshold or Non-threshold Presence of a threshold cannot be proven fromexperimental data. Conclusions about existence of a threshold are basedon biological plausibility and expert judgement. Genotoxic effects (DNA dammage leading to cancer)are thought to be possible at any level of exposure, sono threshold.
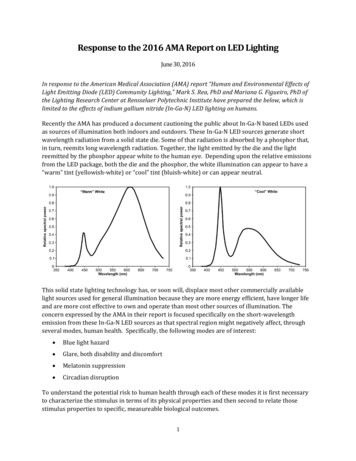
Low-dose Extrapolation Dose-response curve is use to extrapolate to doses lowerthan then the experimental region.
Calculated Risk or Safe Dose Extrapolation may be used to calculate:– the risk associated with a known intake.– intake associated with a de minimis risk, e.g. anincreased life time risk of developing cancer of 1in 106 (‘virtually safe dose’, VSD).
Linear Low-dose Extrapolation Assumption: linear relationship between dose andbiological response
Linear Extrapolation from LED10 LED10– low confidence limit of dose with response of 10%
From LED10 to VSD If LED10 57 mg/kg/day (response 10% or 0,1) then VSD (virtual safe dose, response 1 in 106 or 10-6) 57 x 10-6 / 0,1 5,7 x 10⁻⁴ mg/kg/day
ALARA Approach For genotoxic carcinogens (non-threshold effects)also the ALARA-approach may be followed:exposure to be reduced to as low as reasonablyachievable (ALARA) or as low as reasonablypractical (ALARP)
Relative Toxicity (1) A comparison of the dose-response curves for two or more differentchemicals – administered to the same type of test animal – can be usedto determine the relative toxicity of the chemicals. The LD50 for chemical A is less than the LD50 for chemical B.Therefore, chemical A is considered more toxic than chemical B.
Relative Toxicity (2) Chemical A is more toxic than chemical B at the higherdoses, but at the lower doses chemical B is more toxic thanchemical A.
Relative Toxicity (3) Relative toxicity also be evaluated by comparing the slopeof each dose-response curve. A steep dose-response curveis indicative of a chemical that is rapidly and extensivelyabsorbed and slowly detoxified: therefore, the chemical ismore toxic.
Variables Influencing Toxicity These factors include:–––––––––the dose-time relationship,the route of exposure,the physical and chemical properties of the toxic substance,the chemical interactions,the interspecies and intraspecies variability,genetics,age,sex, andhealth of the individual collectively. The toxicity of a given substance is the net result of thecomplex interaction between all of these various factors.
Dose-Time Relationship Not only is the dose of a toxic substance important indetermining toxicity, but so is the frequency and length ofexposure. The rapid elimination of the substance from the bloodstream decreases the probability of an adverse effect. Gradual accumulation increases the probability that anadverse effect will occur.– Symptoms of acute exposure to sublethal quantities of chlorinatedsolvents, such as chloroform or carbon tetrachloride, are primarilyassociated with the nervous system, such as excitability, dizzinessand narcosis.– Chronic exposure to these solvents is primarily associated withliver damage.
Routes of Exposure LD50 values for various organochlorine andorganophosphate pesticides resulting from ingestion andskin exposure. The different absorption rates for various regions of theskin in the human male
Physical and Chemical Factors Chemical toxicity can be affected by the arrangement ofthe atoms in a molecule. The structural differences can result in different toxiceffects being observed as a result of exposure.– The LD50 for 1,1-dichloroethylene is 5,750 mg/kg and the LD50 forthe 1,2-dichloroethylene isomers is 770 mg/kg.– Based on animal studies, 1,1-dichloroethylene is a suspected humancarcinogen. Its structure is similar to a known human carcinogen,vinyl chloride.– The 1,2-dichloroethylene isomers are not carcinogenic, but they dohave different effects. The cis isomer is an irritant and acts as anarcotic (causes drowsiness). The trans isomer affects the centralnervous system (brain and spinal cord) and the gastrointestinalsystem causing weakness, tremors, cramps, nausea; it may alsocause liver and kidney damage.
Interspecies and Intraspecies Variability Interspecies variability– The variability in response between species is primarily the resultof the evolution of different biological mechanisms involved in themetabolism of toxic substances.– The differences in toxicity may be due to the rate at whichmetabolism occurs, or whether metabolism produces chemicalintermediates more toxic than the parent compound. For example, the pesticide malathion is metabolized at a different rate inmammals than in insects. In mammals, the chemical intermediates are rapidlymetabolized to deliver end products that are excreted from the body. In insectsmetabolize malathion more slowly and produce a chemical intermediate --malaoxon --- that is toxic to the insect. Methanol intoxication results in ocular damage and blindness. However, inother species methanol is less toxic and the symptoms associated with humanintoxication are not observed. Rats do not have a vomiting reflex. Rodenticides, such as squill, are moreeffective if they are ingested because the rat can not discard the substance byvomiting.
Intraspecies (individual) variability Individuals within a population ---exposed to a single dose--- will demonstrate a wide array of responses. This type of variability can be caused by differencesassociated with individual genetics and sex of theindividuals within the population.
Genetics The differences in genetics makeup both within species andbetween species markedly influence the disposition and themetabolism of toxic substances.– For example, some individuals have an enzyme (glucose-6phosphate dehydrogenase) deficiency resulting in their red bloodcells being more fragile than normal. Consequently, red blood cellsof these individuals are more susceptible to chemicals such asphenylhydrazine and primaquine, which cause hemolysis.– The enzyme aryl hydrocarbon hydroxylase (AHH) transforms thechemical benzo[a]pyrene to its carcinogenic metabolite. Someindividuals produce lower amounts of AHH; benzo[a]pyrene istherefore less toxic to these individuals. Similarly, low AHHindividuals may be less likely to develop cancer from cigarettesmoke.
Age In general, younger and developing individuals are moresensitive to toxic substances than older individuals. Thedifference can be primarily attributed to differences inmetabolisms; specially to differences in the functioning ofthe liver. In younger individuals the mechanisms for detoxifyingsubstances are less developed than in older individuals.However, some substances are less toxic to the young thanto adults. The lead absorption rate is four to five times greater inyoung individuals than in adults; the cadmium absorptionrate is 20 times greater than in adults.
Sex The difference in toxicity between genders seems to beprimarily influence by the sex hormones (estrogen andtestosterone), which can affect metabolism. Some organophosphate pesticides are more toxic tofemales than males.– Parathion is metabolized more rapidly in females resulting in ahigher concentration of the more toxic intermediate, paraoxon.– Male rats are 10 times more susceptible to liver damage thanfemale rats as a result of chronic oral exposure to DDT.
State of Health The liver and the kidney are important organs fordetoxifying and removing toxic substances. Therefore,conditions that lead to liver or kidney disease enhance thetoxic effects of substances normally detoxified by theseorgans.
Chemical Interactions (1) The interaction between two or more chemicals and theirsubsequent effects have not been widely studied; notbecause these interactions are not important, but ratherbecause the results are difficult to interpret andextrapolate, and also because the studies are longer andcostlier. The presence of other chemicals at the time of exposure oras a result of previous exposure can affect the response tothe specific toxicant being studied. These effects can beadditive, synergistic, antagonistic, or they maydemonstrate the characteristics associated withsensitization or potentiation
Chemical Interactions (2) Additive effects– An additive effect occurs when the combined effect ofthe two chemicals is equal to the sum of the effects ofeach individual chemical. Synergistic effect– A synergistic effect occurs when the observed effects aregreater than what would be predicted by simplysumming the effects of each individual chemical.
Chemical Interactions (3) Antagonistic effects– Antagonistic effects are the basis on which antidotes aredeveloped to counteract the effects of toxic substancesthat enter the body.– Antagonistic effects occur when the sum of the effects ofeach individual chemical is less than the sum of theeffects for both chemicals.
Chemical Interactions (4) Four major types of antagonism– Functional antagonism It refers to a type of reaction two chemicals have on a specificphysiological function in the test organism, usually producingcounterbalancing or opposite effects.– Chemical antagonism It may be referred to as chemical inactivation. This type ofinteraction is the result of a reaction between two chemicals toproduces a less toxic product.– Dispositional antagonism The toxic substance is either transformed into a less toxicsubstance or it is eliminated from the body more rapidly, thenthe observed effects will be less than the expected ones.
Chemical Interactions (5)– Receptor antagonism It occurs when two chemicals require binding to the samereceptor in order to exert their effect. The result is that whenthe two chemicals are administered together the observed effectis less than the sum of the effects for each chemical.– Sensitization Initial exposure to toxic chemicals does not always result in anobservable or measurable effect. However, subsequentexposure to the same chemical may result in an observable ormeasurable effect. Sensitization occurs as a result of the interaction of the body’simmune system with the toxic chemical during the initialexposure.
Chemical Interactions (6)– Potentiation At first glance it would appear that synergism and potentiationare the same. In A potentiation, only one of the chemicals hasan observable effect when administered alone. Chemical A has no effect on mortality (0%). Chemical Bcauses 25% mortality. When the two chemicals areadministered together the effect is greater than the sum of theirindividual effects (0% 25% 100 %).
LD50 ofChemicalsSubstanceAnimal, RouteLD50ReferenceSucrose (table sugar)rat, oral29,700,000,000 ng/kg[7]Vitamin C (ascorbic acid)rat, oral11,900,000,000 ng/kg[8]Grain alcohol (ethanol)rat, oral7,060,000,000 ng/kg[10]Melaminerat, oral6,000,000,000 ng/kgTable Saltrat, oral3,000,000,000 ng/kg[12]Paracetamol (acetaminophen)rat, oral1,944,000,000 ng/kg[13]Metallic Arsenicrat, oral763,000,000 ng/kg[15]Aspirin (acetylsalicylic acid)rat, oral200,000,000 ng/kg[17]Caffeinerat, oral192,000,000 ng/kg[18]Cadmium oxiderat, oral72,000,000 ng/kg[22]Nicotinerat, oral50,000,000 ng/kg[23]Strychninerat, oral16,000,000 ng/kg[24]Arsenic trioxiderat, oral14,000,000 ng/kg[25]Metallic Arsenicrat, intraperitoneal13,000,000 ng/kg[26]Sodium cyaniderat, oral6,400,000 ng/kg[27]Beryllium oxiderat, oral500,000 ng/kg[30]Aflatoxin B1 (from Aspergillus flavus) rat, oral480,000 ng/kg[31]Dioxin (TCDD)rat, oral20,000 ng/kg[33]Polonium-210human, inhalation10 ng/kg (estimated)[37]Botulinum toxin (Botox)human, oral,injection, inhalation1 ng/kg (estimated)[38]Ionizing radiationhuman, irradiation6 Gy
Typical Costs of Various Types of Toxicity Tests
Typical Testing protocols for Acute and ChronicToxicity Studies
Dose-Response Curve
LD50 Values of Organochlorine Pesticides
LD50 Values of Organophosphate Pesticides
Regional Differences of Dermal Absorption in Human Male
Toxicity of various Compounds toDifferent Test Species
No-effect Levels ona Dose-Response Curve
Acute Toxicity of N-hydroxyacetylaminofluorene in Various Strains of Rats
Five Threshold Doses �限值為:一 fect �影響值(no-observed-adverse-effect ��低值(lowest-observed-adverse-drrect �的最低值(lowest-observed-adverse-effect ��frank effect ��量。 圖片連結-各種劑量反應關係 各種劑量反應關係 圖片連結-各種劑量反應關係
LOEL 最低作用值(LOEL,Lowest-observed effect �生物學上顯著增加的最低劑量。 �露。 逆轉錄不利影響 , 最低的觀察效果級別 , 不遵守,不利的效應級別 , ��無反應劑量(no-effect level, NEL)或無觀察反應劑量(no-observed effect level, ��察反應劑量 (最低作用值)lowest observed effect �劑量(no observed adverse effectlevel, �� ��害反應劑量(lowest observed adverseeffect level, ank effect level, �之。 訂定
Dose-Time Relationship Not only is the dose of a toxic substance important in determining toxicity, but so is the frequency and length of exposure. The rapid elimination of the substance from the blood stream decreases the probability of an adverse effect.