Transcription
U.S. Department of JusticeOffice of Justice ProgramsNational Institute of JusticeNational Institute of JusticeDocumenting and Explaining the 2015 Homicide Rise:Research DirectionsRichard Rosenfeld*University of Missouri – St. LouisJune 2016*Dr. Rosenfeld prepared this paper with support from the National Institute of Justice, Office of Justice Programs,U.S. Department of Justice, under contract number 2010F 10097 (CSR, Incorporated). The opinions, findings, andconclusions or recommendations expressed in this publication are those of the authors and do not necessarily rep resent those of the Department of Justice.NCJ 249895
U.S. Department of JusticeOffice of Justice Programs810 Seventh St. N.W.Washington, DC 20531Loretta E. LynchAttorney GeneralKarol V. MasonAssistant Attorney GeneralNancy Rodriguez, Ph.D.Director, National Institute of JusticeThis and other publications and products of the National Institute of Justice can be found at:National Institute of JusticeStrengthen Science Advance Justicehttp://www.nij.govOffice of Justice ProgramsInnovation Partnerships Safer Neighborhoodshttp://www.ojp.usdoj.govThe National Institute of Justice is the research, development and evaluation agency of the U.S. Department of Justice. NIJ’smission is to advance scientific research, development and evaluation to enhance the administration of justice and public safety.The National Institute of Justice is a component of the Office of Justice Programs, which also includes the Bureau of JusticeAssistance; the Bureau of Justice Statistics; the Office for Victims of Crime; the Office of Juvenile Justice and DelinquencyPrevention; and the Office of Sex Offender Sentencing, Monitoring, Apprehending, Registering, and Tracking.
TABLE OF CONTENTSEXECUTIVE SUMMARY . 2INTRODUCTION . 4DOCUMENTING THE INCREASE . 5THE TOP TEN . 10EXPLAINING THE INCREASE . 11DRUG MARKETS . 12IMPRISONMENT . 16FERGUSON EFFECT . 18TOWARD A 21ST CENTURY CRIME INFORMATION SYSTEM . 23APPENDIX: CITY SAMPLE. 25REFERENCES . 26
Documenting and Explaining the 2015 Homicide Rise: Research Directions2EXECUTIVE SUMMARYThe debate over the size, scope and causes of the homicide increase in 2015 has beenlargely free of systematic evidence. This paper documents the scale of the homicideincrease for a sample of 56 large U.S. cities. It then examines three plausible explanationsof the homicide rise: an expansion of urban drug markets fueled by the heroin epidemic,reductions in incarceration resulting in a growing number of released prisoners in thenation’s cities, and a “Ferguson effect” resulting from widely publicized incidents ofpolice use of deadly force against minority citizens. The paper concludes with a call forthe more frequent and timely release of crime information to address crime problems asthey arise.The homicide increase in the nation’s large cities was real and nearly unprecedented. Itwas also heavily concentrated in a few cities with large African-American populations.Empirical explanations of the homicide increase must await future research based onyear-end crime data for 2015. Several empirical indicators for assessing the explanationsunder consideration here are discussed. For example, if the homicide increase resultedfrom an expansion in urban drug markets, we should observe larger increases in drugrelated homicides than those committed under other circumstances. If returning prisonersfueled the homicide increase, that should be reflected in growing numbers of homicidescommitted by parolees.It will be more difficult to empirically evaluate the so-called Ferguson effect on crimeincreases, depending on the version of this phenomenon under consideration. Thedominant interpretation of the Ferguson effect is that criticism of the police stemmingfrom widely publicized and controversial incidents of the use of force against minoritycitizens caused the police to disengage from vigorous enforcement activities. Anotherversion of the Ferguson effect, however, switches the focus from changes in policebehavior to the longstanding grievances and discontent with policing in AfricanAmerican communities. In this interpretation, when activated by controversial incidentsof police use of force, chronic discontent erupts into violence.The de-policing interpretation of the Ferguson effect can be evaluated with data onarrests and other forms of self-initiated activity by the police. De-policing should bereflected in declining arrest rates in cities experiencing homicide increases. Tracing thepathways from chronic levels of discontent to an escalation in homicide will ultimatelyrequire ethnographic studies in minority communities that reveal, for example, whetheroffenders believe they can engage in crime without fear that residents will contact thepolice or cooperate in police investigations. Such studies could also disclose otherlinkages between discontent, police use of force and criminal violence.In summary, the following research questions for documenting and explaining the 2015homicide rise, at a minimum, should be pursued when the requisite data becomeavailable: How large and widespread was the homicide increase in 2015? Did other crimesalso increase?
Documenting and Explaining the 2015 Homicide Rise: Research Directions 3What conditions drove the homicide increase? Candidate explanations mustaccount for the timing as well as the magnitude and scope of the increase.What role, if any, did the expansion of drug markets play in the 2015 homicideincrease? Was there a relative increase in drug arrests and drug-relatedhomicides?Did declining imprisonment rates contribute to the 2015 homicide rise? Was theincrease greater in cities with more returning prisoners and among parolees?What role did the Ferguson effect play in the homicide rise? If de-policingcontributed to the increase, arrest rates should have declined in cities experiencingthe largest homicide increases. An open question is how to evaluate the role, ifany, of community discontent with the police. Ethnographic studies, among othermethods, should be high on the list of research approaches to identify themechanisms linking police legitimacy and escalating levels of violence.Researchers would have been in a better position to begin addressing the 2015 homiciderise, with evidence rather than speculation, if timely crime data had been available as theincrease was occurring. We would have known whether the homicide rise was confinedto large cities, whether other crimes were also increasing, and whether arrest rates werefalling. The debate over the homicide increase would have been better informed.Technical impediments to the monthly release of crime data no longer exist. A large andworrisome increase in homicide should be the catalyst to finally bring the nation’s crimemonitoring system into the 21st century.
Documenting and Explaining the 2015 Homicide Rise: Research Directions4INTRODUCTIONEarly in 2015, the local press in several U.S. cities reported that the decades-long crimedecline had been reversed by a sizable increase in homicide. Then, late in the summer,the New York Times broke the story nationwide (Davey and Smith 2015). Shortly afterthe Times account appeared, Attorney General Loretta Lynch called big city mayors andpolice chiefs to a meeting in Washington, D.C., to discuss the homicide rise (Byrne2015). It was there that FBI Director James Comey first publicly speculated that theincrease may have been driven by widely publicized reports of police use of force thatresulted in de-policing. Director Comey repeated the claim a few days later in a speech atthe University of Chicago, where he called attention to a “chill wind” blowing throughthe nation’s police departments. He also pointed out, however, that he did not have theevidence necessary to confirm de-policing or any other explanation of the homicide rise(Schmit and Apuzzo 2015).A lively debate in the press soon erupted over the size of the putative homicide increaseand its causes. On one side were commentators who argued that the increase was real andcaused by widespread public criticism of the police, which had made police officershesitant to engage in the proactive policing strategies that reduce crime (Mac Donald2015).1 On the other side were skeptics who argued that the homicide rise had beenoverblown and, whatever its magnitude, did not result from a “Ferguson effect” onvigorous policing (Bialik 2015; Coates 2015; Friedman, Fortier, and Cullen 2015).Notably absent from the conflicting accounts of the 2015 homicide rise wascomprehensive evidence needed to evaluate the two issues that framed the debate: (1)Did homicide rates increase and, if so, how large and widespread was the upturn? and (2)Was the increase caused by hesitancy on the part of police to carry out their crimefighting mission? This paper is organized accordingly.I begin by documenting the homicide increase in 2015 with data on year-end homiciderates in 56 U.S. cities.2 I then present three plausible explanations of the homicide rise:expanding urban drug markets, declining imprisonment rates, and the so-called Fergusoneffect on policing. Only the latter explanation has received significant attention in thedebate over the homicide increase, but prior research has tied crime rate changes to theviolence surrounding urban drug markets and to prison expansion (e.g., Blumstein 1995;Levitt 1996; Rosenfeld 2011a). In addition, there are at least two ways in which theFerguson effect may have unfolded. The dominant interpretation is that the publicitysurrounding recent controversial police killings resulted in de-policing. A second equallyplausible explanation is that, regardless of their effect on police behavior, the policekillings in Ferguson and elsewhere activated longstanding grievances in minoritycommunities concerning the police and the criminal justice system as a whole, resulting1Mac Donald later attributed the homicide increase, in part, to statements made by President Obama thatshe believed were unduly critical of the police (Mac Donald 2016).2I am grateful to Max Ehrenfreund of The Washington Post and Darrel W. Stephens of the Major CitiesChiefs Police Association for providing the crime data used in this study.
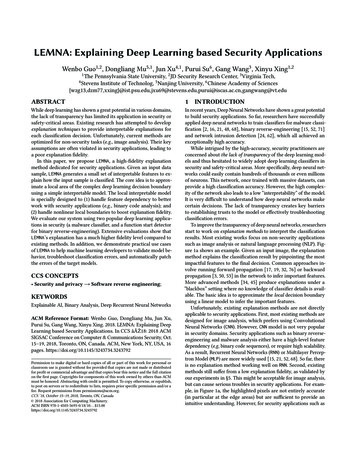
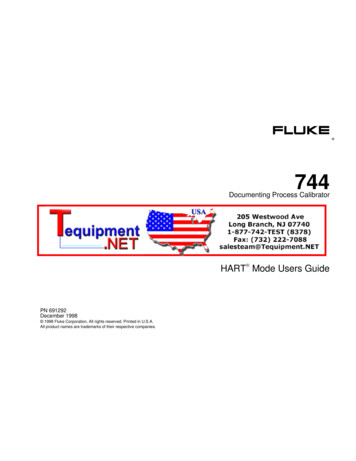
Documenting and Explaining the 2015 Homicide Rise: Research Directions5in a “legitimacy crisis” that spurred crime increases. Researchers have also attributedhomicide increases to declining institutional legitimacy (LaFree 1998; Roth 2009).I present several empirical indicators that can be used to evaluate the alternativeexplanations for the 2015 homicide rise. Unfortunately, the evidence needed to carry outthe pertinent research is unavailable as of this writing, and will not be available untilSeptember or October of 2016 when the FBI releases its Uniform Crime Reports (UCR)for yearend 2015. In the final section of the paper, I argue that it should not be necessary,well into the 21st century, to wait nine months after the collection year to learn whethercrime rates are increasing and gain some insight into the underlying causes. The pressand advocacy organizations have done due diligence in compiling crime data from localpolice departments, but these sporadic and necessarily incomplete efforts are nosubstitute for the timely release of comprehensive crime and arrest statistics by theresponsible federal agencies. Had the official crime data been released on a monthly basisduring 2015, the debate over the homicide rise might have produced less heat and morelight.My focus is on homicide for two reasons. First, with few exceptions (e.g., Friedman,Fortier, and Cullen 2015), the public debate has largely turned on whether and whyhomicide rates may have increased during the past year. Second, homicide is the mostserious and reliably measured crime type for which trend data are available. None of thearguments in the debate over the homicide rise, however, including the explanationsexamined here, is limited to homicide. A Ferguson effect, expanding drug markets ordeclining imprisonment rates might have been expected to lead to increases in otherviolent crimes or in property crime. The first order of business for future research on the2015 homicide increase is to extend the range of offenses under consideration beyondhomicide.3DOCUMENTING THE INCREASEThe data used to determine the size and scope of the homicide increase in 2015 are fromthe police departments in 56 large U. S. cities (see fn. 2). The cities are listed in theAppendix. With the exception of Salt Lake City, Utah (population 190,884), thepopulation of each city exceeded 250,000 in 2014. The 56-city sample, therefore,constitutes the bulk of cities in the UCR’s Group I category of cities with populationsgreater than 250,000. The sample accounted for fully 92 percent or 4,873 of the 5,305homicides in the Group I cities in 2014.4In addition, as shown in Figure 1, the average homicide rates in the 56-city sample andthe UCR Group I cities have trended together for the past two decades. The correlation (r)between the two trends is an impressive .96. Both series declined through the end of the3A good start is a study by Pyrooz et al. (2016) that examined changes in each of the FBI’s Part I violentand property crimes in relation to a possible Ferguson effect.4See the 2014 UCR at -u.s/2014/crime-in-the-u.s.-2014.
Documenting and Explaining the 2015 Homicide Rise: Research Directions61990s, flattened for a few years, rose slightly through 2007, and fell again through 2009.Another slight dip followed until 2015, when both series exhibited a notable increase.The 56-city sample used in this study is clearly a reasonable proxy for the 70-80 citiesthat typically constitute the UCR Group I cities with populations over 250,000. At thesame time, the results of this study are limited to those cities and cannot be generalized tosmaller cities, towns and rural areas, where average homicide rates are lower. With thatlimitation in mind, we observe that the homicide rate in the sample rose by 16.8 percentover the previous year. According to preliminary UCR figures, the homicide rate in theGroup I cities increased by 10.5 percent during the first six months of 2015 over the sameperiod in 2014.5Depending on thereliability of thehomicide data obtaineddirectly from policedepartments, a bestguess is that the yearend 2015 homicide ratefor the Group I citieswill be close to the16.8-percent rise over2014 observed in thesample. The questionnow is whether anincrease of thatmagnitude merits theattention it hasreceived from pundits,advocates and federalofficials.National attention tohomicide increases inU.S. cities is not new,even during the periodof the crime drop sincethe early 1990s. Arecent example is theNational Violent CrimeSummit hosted by thePolice ExecutiveResearch Forum5Computed from data presented in rt-januaryjune-2015/tables/table-1. The 2015 sixmonth preliminary UCR figures for smaller cities also reveal sizable increases over the previous year. Forexample, homicides in cities with populations between 50,000 and 99,000 went up by 8.9 percent.
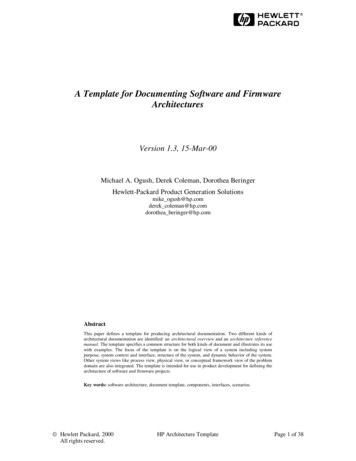
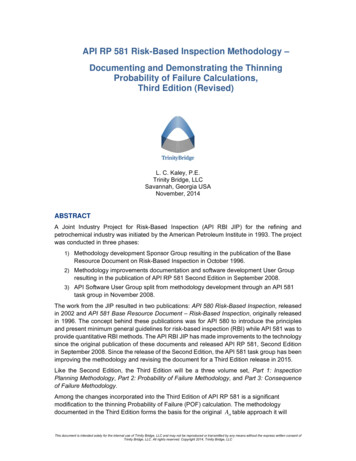
Documenting and Explaining the 2015 Homicide Rise: Research Directions7(PERF) in Washington during August of 2006 to discuss rising violent crime6 rates acrossthe nation. PERF issued a report, provocatively titled A Gathering Storm — ViolentCrime in America, that highlighted crime increases in a sample of 55 cities. According tothe report, “For a growing number of cities across the United States, violent crime isaccelerating at an alarming pace” (Police Executive Research Forum 2006; Somers2006). The Department of Justice initiated an investigation of crime changes in selectedcities, but never publicly issued a report summarizing the results (Rosenfeld 2007).To gain perspective on the significance of the 2015 homicide increase, it is useful tocompare it with the increases featured in the PERF report. Between 2004 and 2006,national violent crime rates rose by 3.5 percent and homicide rates increased by 5.4percent. The comparable increases for Group I cities were .4 percent and 4.8 percent,respectively. Violent crime and homicide rates then dropped in 2007.7 These homicideincreases are not trivial but they are considerably smaller than those recorded for 2015,and they were relatively short lived. If increases of this magnitude garnered the attentionof public officials, including the Attorney General (Somers 2006), in 2006, it is notsurprising that the double-digit percentage increase in big-city homicide registered in2015 would also spark the interest of public officials and the press.Was the homicide increase in large cities during 2015 “statistically significant”? A studyby Pyrooz et al. (2016) examined crime rates in 81 large cities 12 months before and 12months after the killing of Michael Brown by a police officer in Ferguson, Missouri, onAugust 9, 2014. They concluded that the difference in homicide trends between the twoperiods was not statistically significant, although they did find a significant increase inrobbery after the Ferguson incident. By comparison, the difference between the 2015 and2014 homicide rates for the 56-city sample in the current study is just significant at theconventional 5 percent threshold in a one-tailed test (p .05, t 1.66).A closer look at the results of the Pyrooz et al. study, however, reveals a somewhatdifferent conclusion. Table 2 in that study reports a coefficient on the post-Ferguson trendin homicide of .015 and a standard error of .009, which yields a t-statistic of 1.67, nearlyidentical to that in the current study. Given the differences between the two studies insample size, sample composition and estimation methods, it is difficult to directlycompare the results. Moreover, tests of statistical significance are technicallyunwarranted because neither sample is a random draw from a population. Nonetheless, itseems reasonable to conclude that the homicide increases revealed in both studies are atleast roughly comparable.Pyrooz et al. (2016) did acknowledge that homicide had increased in “selected cities”during the period they investigated and called attention to the elevated variance in cityhomicide rates after the Ferguson incident. The results of the current study are similar.Figure 2 (see page 9) displays the percentage change between 2014 and 2015 inhomicides for the 56-city sample. There is marked variation in these one-year changes.Forty cities experienced homicide increases and 16 saw declines or, in one case, no67Violent crimes include homicide, rape, robbery and aggravated assault.See https://www.fbi.gov/about-us/cjis/ucr/ucr.
Documenting and Explaining the 2015 Homicide Rise: Research Directions8change. Homicides in 18 of the cities increased by more than 25 percent; the increaseexceeded 50 percent in 12 cities. The skewed distribution of the homicide changesindicates that a relatively small number of cities accounted for most of the increase in thesample. In fact, just 10 cities accounted for two-thirds of the total homicide increasebetween 2014 and 2015, as shown in table 1.Table 1 displays the 10 cities that contributed the largest number of homicides to the totalincrease in 2015. Together, the increases in these cities constituted 66.7 percent of thetotal increase in the 56-city sample. Had homicides not risen in these cities, it is likelythat the homicide increase of 2015 would have generated far less attention andcontroversy. The remainder of this section focuses on these “top ten” contributors to thehomicide rise in large U.S. cities.
Documenting and Explaining the 2015 Homicide Rise: Research Directions9
Documenting and Explaining the 2015 Homicide Rise: Research Directions10THE TOP TENThe top ten cities not only produced two-thirds of the big-city homicide increase in 2015,they also experienced a far larger percentage increase than the sample as a whole. Thepercentage increases in the top ten ranged from 90.5 percent in Cleveland to 12.9 percentin Philadelphia. The average homicide increase over 2014 in the top ten was 33.3 percent,compared with a 16.8-percent rise for the sample as a whole. One-year increases of thismagnitude in the nation’s large cities, although not unknown, are very rare. Cities in thetop ten had experienced one-year percentage increases in homicide that exceeded theirincrease in 2015 on only 15 occasions since 1985. The increase in 2015 was greater than95 percent of the yearly increases these cities had experienced during the previous threedecades.8 If not unprecedented, then, the 33.3-percent homicide rise in the top ten citiescertainly deserves further scrutiny.9The top ten cities differ from other large cities in other ways as well. As shown in Figure3 (see page 11), with an average population of roughly one million, the top ten cities aresomewhat larger than the others in the 56-city sample.10 They also have somewhat higherpoverty rates (24.6 percent versus 20.8 percent). The largest difference between the topten and other cities in the sample, however, is their race/ethnic composition. The top tenhave larger black populations and smaller Hispanic populations than the other cities. Therelative size of the black population in the top ten is double that in the other cities (40.8percent versus 19.9 percent). By contrast, Hispanics make up just 15.2 percent of thepopulation in the top ten compared with 26.4 percent of the population of the remainingcities in the sample. As we move to a consideration of explanations for the homicide risein 2015, these race/ethnic differences merit prominent attention.In summary, the homicide rise in 2015 in the nation’s large cities was real and, while notunprecedented, comparatively large. Whether the increase extended beyond the largestcities remains unknown, although preliminary UCR data for the first six months of 2015reveal sizable increases in smaller cities as well (see fn. 5). Homicides in the 56-citysample used in this study increased by 16.8 percent over 2014. Ten cities accounted fortwo-thirds of this increase, and together they experienced a 33.3-percent jump inhomicide. These cities have considerably larger black populations and smaller Hispanicpopulations than the other cities in the sample. We now turn to three plausibleexplanations of the homicide rise: the expansion of urban drug markets, fallingimprisonment rates, and the effects of widely publicized and controversial incidents ofthe use of force by the police against minority citizens.8The 2015 percentage increase in four of the cities (Cleveland, Washington, Milwaukee and Baltimore)was greater than the increase they experienced during any year since 1985. The 15 yearly homicideincreases that exceeded the percentage increase in 2015 were concentrated in the remaining six of the topten cities and constituted just 5.0 percent of the 300 possible yearly increases during the 30-year period (10cities x 30 years).9The 33.3-percent rise in homicides in the top ten cities is statistically significant in a one-tailed test (p .04; t 1.99).10The data shown in Figure 3 are from the 2010-2014 combined files of the American Community Survey(www.census.gov/programs-surveys/acs/)
Documenting and Explaining the 2015 Homicide Rise: Research Directions11EXPLAINING THE INCREASEThe study of crime trends is as old as criminology itself. A large body of contemporaryresearch literature is devoted to explaining the causes and correlates of changing crimerates (Blumstein and Wallman 2006; Rosenfeld 2011a). The current task, however, is notto explain a long- or even short-run trend in crime rates, but rather a trend reversal in thenation’s large cities. Some of the explanatory factors that have been emphasized in thecrime trends literature are poor candidates for explaining the homicide rise of 2015.Shifts in age composition or the consequences of exposure to lead, for example, unfoldgradually over time and cannot explain why homicide rates would suddenly increase afterfalling for over two decades. The same is true of economic conditions, except for therelatively abrupt changes in income and employment that occur during a recession. Thelast recession in the United States, however, ended at least five years before the currentupturn in homicide (see www.nber.org/cycles/main.html). Some evidence suggests that adrop in consumer confidence contributed to the increase in violent crime in 2005 and2006 (Rosenfeld and Oliver 2008). Consumer confidence, however, rose from 2014 to
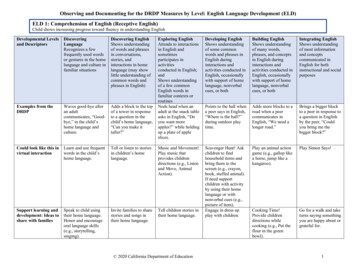
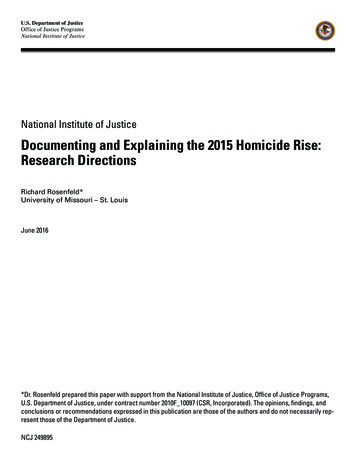
Documenting and Explaining the 2015 Homicide Rise: Research Directions122015.11 Crime increases also tend to correspond with rising inflation rates (Rosenfeld andLevin 2016), but U.S. inflation rates fell from 2011 through the end of 2015.12It is reasonable to assume that whatever factors lay behind the 2015 homicide rise shouldthemselves have exhibited comparably abrupt changes at the same time or shortly before.Among the explanatory factors featured in research on crime trends, the three that areexamined here appear better able than others, at least in principle, to explain the recenthomicide increase. We begin by considering whether the comparatively sudden uptick inhomicide in large cities might have been spurred by a recent expansion in urban drugmarkets. The discussion then turns to the possible role of recent changes in imprisonmentrates and, finally, to the Ferguson effect, in both its de-policing and “legitimacy”versions. Throughout the discussion, several empirical indicators are described that canbe used to evaluate the contribution of these factors to the homicide increase, once therequisite data becomeavailable.DRUG MARKETSThe United States is inthe midst of a majordrug epidemic. Animportant indicator ofrising drug use andabuse is the death ratefrom drug overdose.Figure 4 displays thetrend in drug overdosedeaths from 1999 to2014. The overdosedeath rate more thandoubled over the period.In 2014, more personsdied from drugoverdose than duringany previous year onrecord (Rudd et al.2016). The increase indrug deaths, in turn,was driven largely bythe growth in deathsrelated to the non11The University of Michigan’s Index of Consumer Sentiment rose from a value of 84.1 in 2014 to 92.9 in2015 (http://www.sca.isr.umich.edu/tables.html). See Rosenfeld and Fornango (2007) for a study of crimetrends and consumer sentiment.12See torical-inflation-rates/.
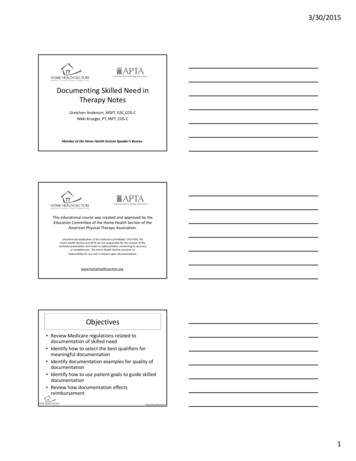
Documenting and Explaining the 2015 Homicide Rise: Research Directions13medical use of opioid analgesics (e.g., Oxycontin, Vicodin) and heroin, as shown inFigure 5. By 2014, opioid and heroin deaths accounted for 61.0 percent of all drugoverdose deaths in the United States (Rudd et al. 2016). Cocaine overdose contributed anadditional 5,415 drug deaths in 2014, but the number of cocaine deaths peaked in 2006.Beginning in 2012, the number of heroin overdose deaths overtook the number of cocainedeaths; by 2014, the number of heroin deaths was nearly twice as large (see Figure 5).As more users enter the market for illicit drugs, the opportunities and incentives for drugsellers also expand. Disputes among sellers over access to customers, and between sellersand buyers over price, purity and other terms of trade, often end in violence in illicitmarkets where participants have no legal means to resolve disputes (Reuter 2010). In aninfluential paper, Blumstein (1995) linked youth homicide increases to the emergenceand spread of the crack cocaine markets in U.S. cities during the 1980s and early 1990s.As the demand for crack grew, young sellers were recruited into the markets because oftheir reduced legal liability. They carried guns to protect themselves from rivals,customers and streetrobbers. As the violenceconnected to the crackmarkets escalated, otheryouth acquired guns toprotect themselves froman increasinglydangerous inner-cityenvironment. A classicarms race ensued andyouth firearm homiciderates rose (see alsoBlumstein andRosenfeld 1998).Subsequent research hasconfirmed the“Blumstein hypothesis”linking homicide and thediffusion of guns to theexpansion of urban drugmarkets (e.g., Cork1999; Messner et al.2005; Ousey and Lee2002). The question iswhether similardynamics were at playin the homicide rise of2015.
Documenting and Explaining the 2015 Homicide Rise: Research Directions14There are reasons, and some evidence, for and against this hypothesis. Urban drugmarkets are, or at least were, violent locales. As more buyers and sellers come intocontact in these “stateless” locations, homicide rates should be expected to rise. But someevidence suggests that changes in illicit drug market transactions, such as the use of cellphones to connect with customers and effectiv
rise, with evidence rather than speculation, if timely crime data had been available as the . well into the 21st century, to wait nine months after the collection year to learn whether crime rates are increasing an