Transcription
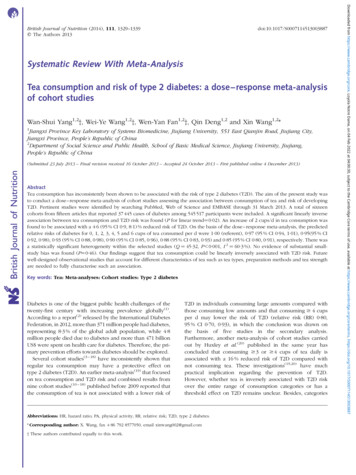
doi:10.1017/S0007114513003887Systematic Review With Meta-AnalysisTea consumption and risk of type 2 diabetes: a dose –response meta-analysisof cohort studiesWan-Shui Yang1,2†, Wei-Ye Wang1,2†, Wen-Yan Fan1,2†, Qin Deng1,2 and Xin Wang1,2*1Jiangxi Province Key Laboratory of Systems Biomedicine, Jiujiang University, 551 East Qianjin Road, Jiujiang City,Jiangxi Province, People’s Republic of China2Department of Social Science and Public Health, School of Basic Medical Science, Jiujiang University, Jiujiang,People’s Republic of ChinaBritish Journal of Nutrition(Submitted 23 July 2013 – Final revision received 16 October 2013 – Accepted 24 October 2013 – First published online 4 December 2013)AbstractTea consumption has inconsistently been shown to be associated with the risk of type 2 diabetes (T2D). The aim of the present study wasto conduct a dose– response meta-analysis of cohort studies assessing the association between consumption of tea and risk of developingT2D. Pertinent studies were identified by searching PubMed, Web of Science and EMBASE through 31 March 2013. A total of sixteencohorts from fifteen articles that reported 37 445 cases of diabetes among 545 517 participants were included. A significant linearly inverseassociation between tea consumption and T2D risk was found (P for linear trend¼0·02). An increase of 2 cups/d in tea consumption wasfound to be associated with a 4·6 (95 % CI 0·9, 8·1) % reduced risk of T2D. On the basis of the dose – response meta-analysis, the predictedrelative risks of diabetes for 0, 1, 2, 3, 4, 5 and 6 cups of tea consumed per d were 1·00 (referent), 0·97 (95 % CI 0·94, 1·01), 0·95(95 % CI0·92, 0·98), 0·93 (95 % CI 0·88, 0·98), 0·90 (95 % CI 0·85, 0·96), 0·88 (95 % CI 0·83, 0·93) and 0·85 (95 % CI 0·80, 0·91), respectively. There wasa statistically significant heterogeneity within the selected studies (Q ¼ 45·32, P,0·001, I 2 ¼ 60·3 %). No evidence of substantial smallstudy bias was found (P¼0·46). Our findings suggest that tea consumption could be linearly inversely associated with T2D risk. Futurewell-designed observational studies that account for different characteristics of tea such as tea types, preparation methods and tea strengthare needed to fully characterise such an association.Key words: Tea: Meta-analyses: Cohort studies: Type 2 diabetesDiabetes is one of the biggest public health challenges of thetwenty-first century with increasing prevalence globally(1).According to a report(2) released by the International DiabetesFederation, in 2012, more than 371 million people had diabetes,representing 8·3 % of the global adult population, while 4·8million people died due to diabetes and more than 471 billionUS were spent on health care for diabetes. Therefore, the primary prevention efforts towards diabetes should be explored.Several cohort studies(3 – 18) have inconsistently shown thatregular tea consumption may have a protective effect ontype 2 diabetes (T2D). An earlier meta-analysis(19) that focusedon tea consumption and T2D risk and combined results fromnine cohort studies(10 – 18) published before 2009 reported thatthe consumption of tea is not associated with a lower risk ofT2D in individuals consuming large amounts compared withthose consuming low amounts and that consuming 4 cupsper d may lower the risk of T2D (relative risk (RR) 0·80,95 % CI 0·70, 0·93), in which the conclusion was drawn onthe basis of five studies in the secondary analysis.Furthermore, another meta-analysis of cohort studies carriedout by Huxley et al.(20) published in the same year hasconcluded that consuming 3 or 4 cups of tea daily isassociated with a 16 % reduced risk of T2D compared withnot consuming tea. These investigations(19,20) have muchpractical implication regarding the prevention of T2D.However, whether tea is inversely associated with T2D riskover the entire range of consumption categories or has athreshold effect on T2D remains unclear. Besides, categoriesAbbreviations: HR, hazard ratio; PA, physical activity; RR, relative risk; T2D, type 2 diabetes.* Corresponding author: X. Wang, fax þ86 792 8577050, email xinwang002@gmail.com† These authors contributed equally to this work.Downloaded from https://www.cambridge.org/core. Loyola Notre Dame, on 04 Feb 2022 at 04:00:30, subject to the Cambridge Core terms of use, available at https://www.cambridge.org/core/terms. https://doi.org/10.1017/S0007114513003887British Journal of Nutrition (2014), 111, 1329–1339q The Authors 2013
W.-S. Yang et al.as well as reference groups of tea consumption vary amongindividual studies. In some cases, the highest categoryassumed in one study might be the lowest category in another,which could complicate the interpretation of the pooled riskestimates as in the meta-analysis by Jing et al.(19). Sincethen, a number of pertinent studies have been published(3 – 9),allowing a more detailed analysis of the association betweenconsumption of tea and subsequent risk of diabetes.Hence, in the present study, we conducted a dose –response meta-analysis of cohort studies to quantitativelyassess the relationship between consumption of 1 –6 cups oftea per d and risk of T2D, following the guidelines of theMeta-analysis of Observational Studies in Epidemiology(21)for reporting a systematic review and meta-analysis.MethodsBritish Journal of NutritionSearch strategyWe comprehensively identified studies by searching PubMed,Web of Science and EMBASE databases through 31 March2013 for cohort studies that evaluated the effect of tea consumption on the subsequent risk of T2D. The search was limited tostudies conducted in human subjects. The reference lists ofthe retrieved articles were also scrutinised to identify additionalrelevant studies. No language restrictions were applied. In total,three search themes were combined using the Boolean operatorAND. The first theme, tea, combined the exploded versions ofthe Medical Subject Headings terms tea, caffeine, polyphenols,catechin or flavonoids. The second theme, diabetes, combinedthe exploded versions of the Medical Subject Headings termsdiabetes mellitus, glucose or insulin. The third theme, cohortstudy, combined the exploded versions of cohort studies, longitudinal studies or prospective studies (given in SupplementaryAppendix 1, available online).Study selection criteriaArticles were considered for inclusion in the meta-analysis ifthe authors had reported data from an original, peer-reviewedstudy other than review articles or meeting abstracts, the studyhad a cohort design consisting of non-institutionalised adults( 18 years old), and the authors provided RR or hazardratio (HR) and its 95 % CI or standard error of incident T2Dfor tea consumption. The selected studies were further considered for inclusion in a dose– response meta-analysis if theauthors had additionally provided adjusted RR or HR and95 % CI for three or more quantitative categories of tea consumption (cups/d), as well as the corresponding number ofcases and person-years or subjects for each category. If publications were duplicated or from the same cohort, the mostrecent publication was included.Data extraction and quality assessmentUsing a unified data form, two authors (W.-S. Y. and W.-Y. W.)independently evaluated study eligibility and conducted dataextraction and quality assessment. Relevant variables includedin the data form were as follows: study name (together withthe first author’s name and year of publication); studyregion; study design; number of cases; cohort size; followup years; variables matched on or adjusted for in the designand data analysis. To conduct a dose – response meta-analysis,RR or HR and 95 % CI that reflected the greatest degree ofcontrol for potential confounders (i.e. the study-specificmost-adjusted RR or HR and its 95 % CI), as well as the corresponding number of cases and person-years or subjects foreach category of tea consumption, were also extracted. Ifany of the above-mentioned information was not availablein the articles, the first or corresponding authors werecontacted by email for additional information. Some studiesseparated risk estimates according to the different types oftea consumed and did not report the effect of total teaconsumption. In this case, the study-specific effect size inthe overall analysis was recalculated by combining the riskestimates of such tea types using the random-effects modelmeta-analysis(22). The two lists from the authors were thencompared, and disagreements were settled by consensus orby involving a third reviewer (W.-Y. F.) for adjudication.To assess study quality, a 9-point scoring system accordingto the Newcastle –Ottawa Scale(23) was used. Qualitycharacteristics were assessed using the following criteria:(1) representativeness of the exposed cohort; (2) selection ofthe unexposed cohort; (3) exposure assessments; (4) outcomeof interest not present at the start of the study; (5) control forimportant factors or additional factors; (6) outcome assessments; (7) follow-up period long enough for outcomes tooccur; (8) adequacy of follow-up of cohorts. A study can begiven a maximum score of one point for each item, except forthe item ‘control for important factors or additional factors’,for which studies that adjusted for body weight or BMI orwaist circumference or waist:hip ratio were given one pointand those that also adjusted for other potential confoundersincluding smoking, total energy intake, physical activity (PA)and intake of other beverages were given an additional point.Hence, the full score was 9, and a high-quality study in thepresent analysis was defined as a study with 7 points.Data synthesis and analysesFor every study, we estimated a RR and its 95 % CI for anincrease of 2 cups/d in tea consumption in the first stage.The method suggested by Greenland & Longnecker(24) andOrsini et al.(25) was used to calculate study-specific loglinear trends in random-effects generalised least-squaresmodels for every study. We then combined the study-specificlog-linear trends in a second random-effects generalised leastsquares model for summary linear trend estimation. The meanor median tea intake levels for each category were assigned toeach corresponding RR for every study.We also conducted a two-stage random-effects dose –response meta-analysis(26) to study the potential non-linearrelationship between tea consumption and T2D risk. Thiswas carried out by modelling tea consumption using arestricted cubic spline model with four knots at fixed percentiles (5, 35, 65 and 95 %) of the distribution(27). In the firstDownloaded from https://www.cambridge.org/core. Loyola Notre Dame, on 04 Feb 2022 at 04:00:30, subject to the Cambridge Core terms of use, available at https://www.cambridge.org/core/terms. https://doi.org/10.1017/S00071145130038871330
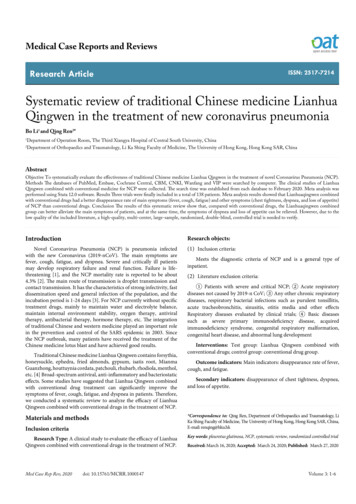
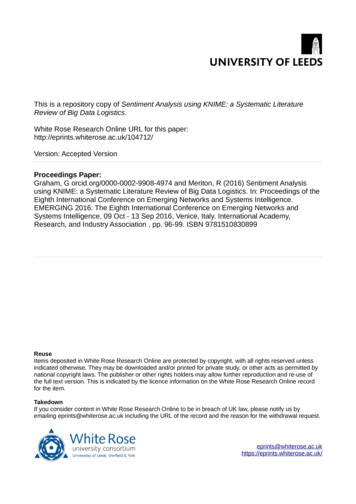
British Journal of Nutritionstage, a restricted cubic spline model was estimated using generalised least-squares regression accounting for the correlationwithin each set of published risk estimates(25). In the secondstage, the study-specific slopes (trend) that had been estimated within each study were combined by using therestricted maximum-likelihood method in a multivariaterandom-effects meta-analysis(28). A P value for non-linearitywas computed by testing the null hypothesis that the coefficients of the second and third splines are all equal to zero.Cubic spline models with three knots were also used andsimilar results were obtained (data not shown).A separate random-effects meta-analysis(22) was alsoconducted to calculate the summary RR with 95 % CI of T2D forcomparable categories of tea consumption when comparedwith the lowest category in each study. In this approach, wepooled the tea consumption categories into five groups: reference(no tea consumption); ,1 cup/d; 1–3 cups/d; 3–4 cups/d; 4 cups/d.Between-study heterogeneity among the study-specifictrends (one-stage estimations) for the dose– response metaanalysis and heterogeneity within the study-specific RR andHR for the separate random-effects meta-analysis were evaluated using Cochran’s Q and I 2, and the null hypothesis thatthe studies are homogeneous was rejected if the P value forheterogeneity was ,0·10(29) or the I 2 value was 50 %. Thepotential small-study bias was evaluated using Begg’s rankcorrelation method(30) and by means of visual inspection ofthe funnel plot. A subgroup analysis was conducted bystudy quality, study region, sex, follow-up years, tea types,diabetes assessments and covariates adjusted in the articles if 2 studies were included in each stratum. All the dataanalyses were carried out using the R 2.15.3 (R DevelopmentCore Team) and SAS 9.2 (SAS Institute, Inc.) software, and atwo-sided P value of 0·05 was considered to be statisticallysignificant if not specified.ResultsLiterature searchA flow diagram of the literature search strategy employed inthe present study is shown in Fig. 1. Using the search strategy,a total of 5006 citations were identified, of which 4889 articleswere excluded after review of the title or abstract. Afterexamining the full text of the remaining 117 articles,101 articles were found to be reviews or not to have acohort design; one study(18) was excluded because analysisin this study was updated by a later publication with alonger follow-up period(3). Thus, fifteen articles were includedin the meta-analysis.Study characteristicsThe characteristics of sixteen cohorts from the fifteen selectedarticles are given in Table 1. Altogether, these studies had37 445 cases of T2D among 545 517 participants during afollow-up period ranging from 3·4 to 24 years. All the studieswere published between 2004 and 2013 and were conductedin Asia (n 4)(5,7,10,14), Europe (n 5)(4,6,9,11,15) and the USA5006 Citations identified from Pubmed, Web of Scienceand EMBASE databases through 31 March 20134889 Citations excluded3877 Excluded based on titles or abstract reviews3780 Not relevant (animal studies or did not studyeither tea or diabetes)Ninety-seven not original peer-reviewed articles1012 Duplicates117 Potentially relevant articles identified for full-text review102 Studies excluded based on full-text reviewsOne study(18) was updated by a later study(3) with alonger follow-up period101 Reviews or not a cohort designFifteen studies included in the meta-analysisFig. 1. Literature search and reference selection for the meta-analysis.1331Downloaded from https://www.cambridge.org/core. Loyola Notre Dame, on 04 Feb 2022 at 04:00:30, subject to the Cambridge Core terms of use, available at https://www.cambridge.org/core/terms. https://doi.org/10.1017/S0007114513003887Tea consumption and type 2 diabetes
British Journal of NutritionFollow-upduration(years)1332Table 1. Characteristics of the studies included in the meta-analysisCases(n)T2D measuresAdjustments74 749131-Item FFQ(unspecified tea)NDDG diagnostic criteria, self-report,confirmed by medical records286539 059131-Item FFQ(unspecified tea)NDDG diagnostic criteria, self-report,confirmed by medical records11·712 40316 835Country-specific orcentre-specificsemi-quantitativeor quantitative dietary questionnaires(unspecified tea)3·42014975Self-report, primary care registers,secondary care registers, hospitaladmissions and mortality data,confirmed by further evidence ofinformation of incident type 2diabetes from at least twoindependent sourcesADA and WHO diagnostic criteria,self-report without confirmationAge, smoking, alcohol drinking, PA,BMI, total energy intake, beveragesother than tea, HRT, family history ofdiabetesAge, smoking, alcohol drinking, PA,BMI, total energy intake, intake ofbeverages other than tea, familyhistory of diabetesAge, sex, education, smoking, alcoholdrinking, PA, BMI, total energyintake, intake of beveragesother than tea11141569 532 35 years(men andwomen)1045313 540169-Item FFQ(green, oolong andblack tea)Self-report of doctor’s diagnosiswithout confirmationBWHS30 – 69 years(women)12367146 906Eighty-five-item FFQ(unspecified tea)Self-report with an accuracyassessment showing a highconsistency (96 %) with the medicaldata in a sample of subjectsvan Dierenet al.(9)EPIC-NL1091838 176Odegaardet al.(10)SCHS5·7188936 908Seventy-seven-itemFFQ (unspecifiedtea)165-Item FFQ (greenand black tea)Hameret al.(11)Whitehall IIStudy20 – 70 years(men andwomen)45 – 74 years(men andwomen)33 – 55 years(men andwomen)11·73875823131-Item FFQ(unspecified tea)Self-report, confirmed by urinaryglucose strip test or hospitaldischarge diagnosesSelf-report of doctor’s diagnosis,confirmed by hospital dischargedatabase, or medication useOGTT, diabetic medication,self-report of doctor’s diagnosisHu et al.(15)Four surveysin Finland35 – 74 years(men andwomen)13·496421 385Self-administereddietary questionnaire (unspecifiedtea)WHO criteria, National HospitalDischarge Register, National SocialInsurance Institution’s DrugRegisterBaseline age(sex)Bhupathirajuet al.(3)NHS30 – 55 years(women)247370Bhupathirajuet al.(3)HPFS40 – 75 years(men)22InterAct C(4)EPIC20 – 79 years(men andwomen)Hayashinoet al.(5)HIPOP-OHP19 – 69 years(men)Sartorelliet al.(6)E3N42 – 72 years(women)Oba et al.(7)TakayamaStudyBoggs et questionnaire(oolong tea)208-Item FFQ(unspecified tea)WHO diagnostic criteria, self-report,diabetic drug use, hospitaladmissionsAge, smoking, alcohol drinking, PA,BMI, vegetable intake, intake of beverages other than tea, hypertension,family history of diabetes and othersAge, education, smoking, alcoholdrinking, PA, BMI, intake ofbeverages other than tea,hypertension, HRT, menopausalstatus, family history of diabetesand othersAge, education, smoking, alcoholdrinking, PA, BMI, total energyintake, menopausal status forwomenAge, education, smoking, PA,BMI, total energy intake, intake ofbeverages other than tea,hypertension, HRT, menopausalstatus, family history of diabetesand othersAge, sex, education, smoking, alcoholdrinking, PA, BMI, total energyintake and othersAge, sex, education, smoking, alcoholdrinking, PA, BMI and othersW.-S. Yang et al.Tea measures(tea types)CohortdesignationAge, sex, ethnicity, smoking, alcoholdrinking, PA, WHR, BMI, total energyintake, intake of beverages otherthan tea, hypertension, family historyof diabetes and othersAge, sex, education, smoking, alcoholdrinking, PA, BMI, vegetable and fruitintake, intake of beverages otherthan tea and othersDownloaded from https://www.cambridge.org/core. Loyola Notre Dame, on 04 Feb 2022 at 04:00:30, subject to the Cambridge Core terms of use, available at https://www.cambridge.org/core/terms. https://doi.org/10.1017/S0007114513003887
British Journal of NutritionTable 1. ContinuedBaseline age(sex)van Damet al.(12)NHS II26 – 46 years(women)Pereiraet al.(13)IWHS55 – 69 years(women)Iso et al.(14)JACC StudySong et al.(16)Greenberget ipants(n)Tea measures(tea types)T2D measuresAdjustmentsAge, smoking, PA, BMI, total energyintake, meat intake, intake ofbeverages other than tea, HRT,family history of type 2 diabetes andothersAge, education, smoking, alcoholdrinking, PA, WHR, BMI, total energyintake, intake of beverages otherthan tea, hypertension and othersAge, smoking, alcohol drinking, PA,BMI, intake of beverages other thantea, hypertension and others126388 ed tea)NDDG diagnostic criteria, self-report,confirmed by medical record review11141828 812127-Item FFQ(unspecified tea)40 – 65 years(men andwomen)544417 413WHS 45 years(women)8·8161438 018Self-administereddietaryquestionnaire(green and oolongtea)131-Item FFQ(unspecified tea)NHEFS32 – 88 years(men andwomen)8·41705127Self-report with an accuracyassessment showing a poorconsistency (64 %) with the medicaldata in a sample of subjectsSelf-report with an accuracy andvalidity assessment (sensitivity:70 % for men and 75 % for women;specificity: 95 % for men and 98 %for women)ADA diagnostic criteria, self-report,confirmed from supplementalquestionnaire and physicianinformationSelf-report of doctor’s (unspecified tea)Age, smoking, alcohol drinking, PA,BMI, total energy intake, familyhistory of diabetes, hypertensionand othersAge, sex, ethnicity, education, income,smoking, alcohol drinking, PA, BMI,intake of beverages other than teaand othersTea consumption and type 2 diabetesCohortdesignationT2D, type 2 diabetes; NHS, Nurses’ Health Study; NDDG, National Diabetes Data Group; PA, physical activity; HRT, hormone replacement therapy; HPFS, Health Professionals’ Follow-up Study; EPIC, European ProspectiveInvestigation into Cancer and Nutrition; HIPOP-OHP, High-risk and Population Strategy for Occupational Health Promotion Study; ADA, American Diabetes Association; E3N, Etude Epidémiologique auprés de femmes de laMutuelle Générale de l’Education Nationale; BWHS, Black Women’s Health Study; EPIC-NL, European Prospective Investigation into Cancer and Nutrition – Netherlands; SCHS, Singapore Chinese Health Study; OGTT, oralglucose tolerance test; WHR, waist:hip ratio; IWHS, Iowa Women’s Health Study; JACC, Japan Collaborative Cohort Study; WHS, Women’s Health Study; NHEFS, First National Health and Nutrition Examination Survey Epidemiologic Follow-Up Study.1333Downloaded from https://www.cambridge.org/core. Loyola Notre Dame, on 04 Feb 2022 at 04:00:30, subject to the Cambridge Core terms of use, available at https://www.cambridge.org/core/terms. https://doi.org/10.1017/S0007114513003887
British Journal of NutritionW.-S. Yang et al.(n 6)(3,8,12,13,16,17). Most of the studies recruited both men andwomen, of which four studies(3,7,14,15) presented results bysex, while five studies(6,8,12,13,16) included only women andone study(5) included only men. Only four studies(5,7,10,14) separated the risk estimates according to the different types of teaconsumed: three for green tea(7,10,14); three for oolong(5,7,14);three for black tea(7,10,14); others reported the effect of totaltea consumption with unspecified tea types. All the studiessimultaneously adjusted for age, BMI, smoking and PA; fourteen articles also adjusted for alcohol drinking, of whicheleven articles also adjusted for consumption of beveragesother than tea (coffee and other sugar-sweetened beverages).All the selected studies utilised self-reported FFQ or selfadministered questionnaires to estimate tea intake. In mostof the studies, the diagnosis of diabetes was determinedfrom self-report and was further verified by evidence frommedical records, diabetes registration system, hospitaladmissions and hypoglycaemic agent use; three studies(4,6,11)combined self-reported measures with medical records andfive studies relied solely on self-reported outcomes(5,7,13,14,17),of which two studies(13,14) considered the validity of outcomedata (Table 1).Study-specific quality scores are summarised in Table 2. Therange of quality scores was from 6 to 9; the mean and medianscores were 7·3 (SD 0·86) and 7·0, respectively. All the selectedstudies except one(17) were defined as high-quality studiesaccording to the Newcastle – Ottawa Scale 9-scoring system.Subgroup and sensitivity analysesIn the subgroup analysis (Table 3), the inverse associationbetween tea consumption and diabetes risk appeared to be confined to European populations (five studies), women (fivestudies), and oolong and black tea intake (three studies)when stratified by study region, sex and tea type; however,the number of selected studies in each stratum was small (sixstudies for US populations and three for Asian populations;four studies for men; and two studies for green tea intake).The inverse association was apparent (P for lineartrend¼0·01) in the analysis of cohort studies with over amedian of 10 years of follow-up duration, but not among studieswith less than 10 years of follow-up duration. The summary RRof diabetes were similar in the subgroup analysis by three typesof adjustments in the models (i.e. simultaneously controlling forBMI, PA and smoking; simultaneously controlling for BMI, PA,smoking and intake of other beverages; and simultaneouslycontrolling for BMI, PA, smoking, intake of other beveragesand alcohol drinking).In the sensitivity analysis, when we excluded one study(4)with the largest statistical weight (9·67 %) in the meta-analysis,the inverse linear trend between tea consumption anddiabetes risk remained (P for linear trend¼0·03). Similarly,simultaneous exclusion of three studies(5,10,14) without riskestimates of total tea consumption yielded similar results(P for linear trend ,0·01).DiscussionOverall analysis(3 – 6,8 – 12,14 – 17)From thirteen articles, fourteen cohorts werecombined in the dose– response meta-analysis. There was a significant linear association between tea consumption and T2Drisk (P for linear trend¼0·02; P for non-linear trend¼ 0·96)(Fig. 2). The risk reduction of T2D for an increment of 2 cupsof tea per d was 4·6 (95 % CI 0·9, 8·1) %. Compared with notea consumption, the summary RR of T2D were 0·97 (95 % CI0·94, 1·01) for 1 cup of tea per d, 0·95 (95 % CI 0·92, 0·98) for2 cups of tea per d, 0·93 (95 % CI 0·88, 0·98) for 3 cups of teaper d, 0·90 (95 % CI 0·85, 0·96) for cups of tea per d, 0·88(95 % CI 0·83, 0·93) for 5 cups of tea per d and 0·85 (95 % CI0·80, 0·91) for 6 cups of tea per d (Table 2). The results wereconsistent when analyses were restricted to twelve high-qualitystudies (P for linear trend ,0·01). A significant between-studyheterogeneity was detected in the study-specific trends(Q ¼ 45·32, P, 0·01, I 2 ¼ 60·3 %). Begg’s rank correlation test(P¼0·46) and funnel plot (shown in Supplementary Fig. 1,available online) provided no evidence of substantial smallstudy bias among the study-specific trends.In the separate random-effects meta-analysis for comparable categories of tea consumption, the RR of T2D were1·00 (95 % CI 0·97, 1·04) for , 1 cup/d (twelve studies)(Q ¼ 12·71, P¼0·69, I 2 ¼ 0), 0·98 (95 % CI 0·94, 1·02) for1 – 3 cups/d (thirteen studies) (Q ¼ 20·75, P¼0·24,I 2 ¼ 18·1 %), 0·93 (95 % CI 0·65, 1·34) for 3 – 4 cups/d (threestudies) (Q ¼ 16·34, P, 0·01, I 2 ¼ 81·6 %) and 0·85 (95 % CI0·77, 0·94) for 4 cups/d (eleven studies) (Q ¼ 16·45,P¼ 0·13, I 2 ¼ 33·1 %).To our knowledge, the present meta-analysis is the first toquantify the dose– response relationship between regular teaconsumption and T2D risk. We found that regular tea consumption was inversely linearly associated with the risk ofdeveloping T2D. Such an inversely linear trend persistedand remained statistically significant in high-quality studies.We also observed that individuals who consumed 4 cupsof tea per d had a 15 % risk reduction for developing T2D.According to the results of the present meta-analysis, adultswho consumed at least 2 cups of tea daily might suffer froma lower risk of incident T2D compared with those not consuming tea. Given the high prevalence of diabetes and thepopularity of tea worldwide, the observed association, ifvalidated in future studies, has both clinical and publichealth importance.There is emerging evidence from experimental and clinicalresearch demonstrating that tea may protect against diabetes.Data from both in vitro and animal in vivo studies indicateseveral possible mechanisms by which tea and its activecomponents may affect glucose metabolism and insulinsignalling(31,32). Tea catechins, including epigallocatechin-3gallate, epicatechin-3-gallate, tannins and theaflavins, maylower glucose and insulin concentrations by inhibiting thecarbohydrate digestive enzymes a-amylase, intestinal sucroseand a-glucosidase in the intestines of rabbits(33,34). Teacatechins, particularly epigallocatechin-3-gallate, which is themost abundant catechin and has received by far the mostattention, have also been shown to enhance insulin sensitivityDownloaded from https://www.cambridge.org/core. Loyola Notre Dame, on 04 Feb 2022 at 04:00:30, subject to the Cambridge Core terms of use, available at https://www.cambridge.org/core/terms. https://doi.org/10.1017/S00071145130038871334
British Journal of NutritionTable 2. Methodological quality of studies included in the meta-analysis*CohortdesignationSelection of theunexposedcohortExposuremeasuresOutcome of interestnot present at the startof the studyControl for importantfactors or additionalfactors†OutcomemeasuresFollow-up period longenough for outcomesto occur‡Adequacy offollow-up ��w––ww––ww––w–7876777977977786NHS, Nurses’ Health Study; HPFS, Health Professionals’ Follow-up Study; EPIC, European Prospective Investigation into Cancer and Nutrition; HIPOP-OHP, High-risk and Population Strategy for Occupational HealthPromotion Study; E3N, Etude Epidémiologique auprés de femmes de la Mutuelle Générale de l’Education Nationale; BWHS, Black Women’s Health Study; EPIC-NL, European Prospective Investigation into Cancer and Nutrition– Netherlands; SCHS, Singapore Chinese Health Study; IWHS, Iowa Women’s Health Study; JACC, Japan Collaborative Cohort Study; WHS, Women’s Health Study; NHEFS, First National Health and Nutrition ExaminationSurvey Epidemiologic Follow-Up Study.* A study can be awarded a maximum of one star for each item, except for the item ‘control for important factors or additional factors’.† A maximum of two stars can be awarded for this item. Studies controlling for body weight or BMI or waist circumference or waist:hip ratio were awarded one star, while studies controlling for other important confounders includingsmoking, total energy intake, and intake of other beverages were awarded an additional star.‡ Duration of 10 years was the predefined follow-up duration long enough for outcomes to occur, and a cohort study with follow-up duration 10 years was awarded one star.§ A cohort study with a follow-up rate of more than 75 % was
An increase of 2 cups/d in tea consumption was found to be associated with a 4·6 (95% CI 0·9, 8·1)% reduced risk of T2D. On th