Transcription
RES EARCHRESEARCH ARTICLE ECONOMICSDissecting racial bias in an algorithm used to managethe health of populationsZiad Obermeyer1,2*, Brian Powers3, Christine Vogeli4, Sendhil Mullainathan5*†There is growing concern that algorithmsmay reproduce racial and gender disparities via the people building them orthrough the data used to train them (1–3).Empirical work is increasingly lendingsupport to these concerns. For example, jobsearch ads for highly paid positions are lesslikely to be presented to women (4), searchesfor distinctively Black-sounding names aremore likely to trigger ads for arrest records(5), and image searches for professions suchas CEO produce fewer images of women (6).Facial recognition systems increasingly usedin law enforcement perform worse on recognizing faces of women and Black individuals(7, 8), and natural language processing algorithms encode language in gendered ways (9).Empirical investigations of algorithmic bias,though, have been hindered by a key constraint:Algorithms deployed on large scales are typicallyproprietary, making it difficult for independent researchers to dissect them. Instead, researchers must work “from the outside,” oftenwith great ingenuity, and resort to clever workarounds such as audit studies. Such efforts candocument disparities, but understanding howand why they arise—much less figuring outwhat to do about them—is difficult withoutgreater access to the algorithms themselves.Our understanding of a mechanism thereforetypically relies on theory or exercises with1School of Public Health, University of California, Berkeley,Berkeley, CA, USA. 2Department of Emergency Medicine,Brigham and Women’s Hospital, Boston, MA, USA.3Department of Medicine, Brigham and Women’s Hospital,Boston, MA, USA. 4Mongan Institute Health Policy Center,Massachusetts General Hospital, Boston, MA, USA. 5BoothSchool of Business, University of Chicago, Chicago, IL, USA.*These authors contributed equally to this work.†Corresponding author. Email: sendhil.mullainathan@chicagobooth.eduObermeyer et al., Science 366, 447–453 (2019)researcher-created algorithms (10–13). Without an algorithm’s training data, objective function, and prediction methodology, we can onlyguess as to the actual mechanisms for theimportant algorithmic disparities that arise.In this study, we exploit a rich dataset thatprovides insight into a live, scaled algorithmdeployed nationwide today. It is one of thelargest and most typical examples of a classof commercial risk-prediction tools that, byindustry estimates, are applied to roughly200 million people in the United States eachyear. Large health systems and payers rely onthis algorithm to target patients for “high-riskcare management” programs. These programsseek to improve the care of patients withcomplex health needs by providing additionalresources, including greater attention fromtrained providers, to help ensure that care iswell coordinated. Most health systems usethese programs as the cornerstone of population health management efforts, and theyare widely considered effective at improvingoutcomes and satisfaction while reducing costs(14–17). Because the programs are themselvesexpensive—with costs going toward teams ofdedicated nurses, extra primary care appointment slots, and other scarce resources—healthsystems rely extensively on algorithms to identify patients who will benefit the most (18, 19).Identifying patients who will derive thegreatest benefit from these programs is achallenging causal inference problem thatrequires estimation of individual treatment effects. To solve this problem, health systemsmake a key assumption: Those with the greatest care needs will benefit the most from theprogram. Under this assumption, the targetingproblem becomes a pure prediction policy problem (20). Developers then build algorithms25 October 2019Data and analytic strategyWorking with a large academic hospital, weidentified all primary care patients enrolledin risk-based contracts from 2013 to 2015. Ourprimary interest was in studying differencesbetween White and Black patients. We formedrace categories by using hospital records, whichare based on patient self-reporting. Any patientwho identified as Black was considered to beBlack for the purpose of this analysis. Of theremaining patients, those who self-identifiedas races other than White (e.g., Hispanic) wereso considered (data on these patients are presented in table S1 and fig. S1 in the supplementary materials). We considered all remainingpatients to be White. This approach allowedus to study one particular racial difference ofsocial and historical interest between patientswho self-identified as Black and patients whoself-identified as White without another raceor ethnicity; it has the disadvantage of notallowing for the study of intersectional racial1 of 7Downloaded from http://science.sciencemag.org/ on October 24, 2019Health systems rely on commercial prediction algorithms to identify and help patients with complexhealth needs. We show that a widely used algorithm, typical of this industry-wide approach andaffecting millions of patients, exhibits significant racial bias: At a given risk score, Black patientsare considerably sicker than White patients, as evidenced by signs of uncontrolled illnesses.Remedying this disparity would increase the percentage of Black patients receiving additionalhelp from 17.7 to 46.5%. The bias arises because the algorithm predicts health care costs rather thanillness, but unequal access to care means that we spend less money caring for Black patients thanfor White patients. Thus, despite health care cost appearing to be an effective proxy for healthby some measures of predictive accuracy, large racial biases arise. We suggest that the choice ofconvenient, seemingly effective proxies for ground truth can be an important source of algorithmicbias in many contexts.that rely on past data to build a predictor offuture health care needs.Our dataset describes one such typical algorithm. It contains both the algorithm’s predictions as well as the data needed to understandits inner workings: that is, the underlying ingredients used to form the algorithm (data,objective function, etc.) and links to a richset of outcome data. Because we have theinputs, outputs, and eventual outcomes, ourdata allow us a rare opportunity to quantifyracial disparities in algorithms and isolate themechanisms by which they arise. It should beemphasized that this algorithm is not unique.Rather, it is emblematic of a generalized approach to risk prediction in the health sector, widely adopted by a range of for- andnon-profit medical centers and governmentalagencies (21).Our analysis has implications beyond whatwe learn about this particular algorithm. First,the specific problem solved by this algorithmhas analogies in many other sectors: The predicted risk of some future outcome (in ourcase, health care needs) is widely used to target policy interventions under the assumptionthat the treatment effect is monotonic in thatrisk, and the methods used to build the algorithm are standard. Mechanisms of bias uncovered in this study likely operate elsewhere.Second, even beyond our particular finding,we hope that this exercise illustrates the importance, and the large opportunity, of studying algorithmic bias in health care, not justas a model system but also in its own right. Byany standard—e.g., number of lives affected,life-and-death consequences of the decision—health is one of the most important and widespread social sectors in which algorithms arealready used at scale today, unbeknownstto many.
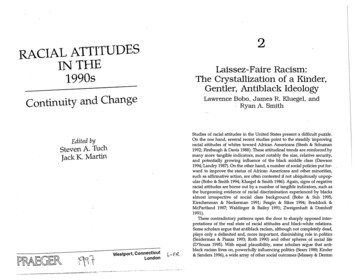
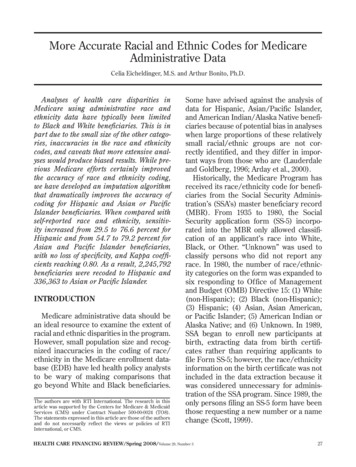
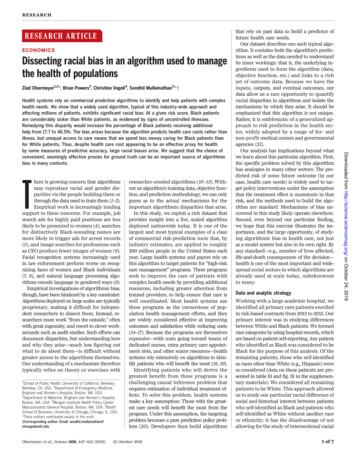
RES EARCH R E S E A R C H A R T I C L EObermeyer et al., Science 366, 447–453 (2019)Health disparities conditional on risk scoreWe begin by calculating an overall measure ofhealth status, the number of active chronicconditions [or “comorbidity score,” a metricused extensively in medical research (24) toprovide a comprehensive view of a patient’shealth (25)] by race, conditional on algorithmic risk score. Fig. 1A shows that, at the samelevel of algorithm-predicted risk, Blacks havesignificantly more illness burden than Whites.We can quantify these differences by choosingone point on the x axis that corresponds toa very-high-risk group (e.g., patients at the97th percentile of risk score, at which patientsare auto-identified for program enrollment),where Blacks have 26.3% more chronic illnesses than Whites (4.8 versus 3.8 distinctconditions; P 0.001).What do these prediction differences meanfor patients? Algorithm scores are a key inputto decisions about future enrollment in a carecoordination program. So as we might expect,with less-healthy Blacks scored at similar riskscores to more-healthy Whites, we find evidenceTable 1. Descriptive statistics on our sample, by race. BP, blood pressure; LDL, low-densitylipoprotein.WhiteBlackn ntprogram.Algorithmscore .2.Care utilization.Actualcost 7540 8442.Hospitalizations0.090.13.Hospital days0.500.78.Emergencyvisits0.190.35.Outpatient visits4.944.31.Mean biomarker values.HbA1c(%)5.96.4.Systolic BP (mmHg)126.6130.3.DiastolicBP t(%)40.737.8.LDL(mg/dl)103.4103.0.Active chronic illnesses (comorbidities).Totalnumber of active illnesses1.201.90.Hypertension0.290.44.Diabetes, Arthritis0.040.04.Renalfailure0.030.07.Electrolyte 30.05.Valvular disease0.030.02.Stroke0.020.03.Peripheral vascular attack0.010.02.Liver disease0.010.02.25 October 20192 of 7Downloaded from http://science.sciencemag.org/ on October 24, 2019and ethnic identities. Our main sample thusconsisted of (i) 6079 patients who self-identifiedas Black and (ii) 43,539 patients who selfidentified as White without another race orethnicity, whom we observed over 11,929 and88,080 patient-years, respectively (1 patientyear represents data collected for an individual patient in a calendar year). The samplewas 71.2% enrolled in commercial insuranceand 28.8% in Medicare; on average, 50.9 yearsold; and 63% female (Table 1).For these patients, we obtained algorithmic risk scores generated for each patientyear. In the health system we studied, riskscores are generated for each patient duringthe enrollment period for the system’s caremanagement program. Patients above the97th percentile are automatically identifiedfor enrollment in the program. Those abovethe 55th percentile are referred to their primary care physician, who is provided withcontextual data about the patients and askedto consider whether they would benefit fromprogram enrollment.Many existing metrics of algorithmic biasmay apply to this scenario. Some definitionsfocus on calibration [i.e., whether the realizedvalue of some variable of interest Y matchesthe risk score R (2, 22, 23)]; others on statistical parity of some decision D influenced bythe algorithm (10); and still others on balanceof average predictions, conditional on the realized outcome (22). Given this multiplicity andthe growing recognition that not all conditions can be simultaneously satisfied (3, 10, 22),we focus on metrics most relevant to the realworld use of the algorithm, which are relatedto calibration bias [formally, comparing BlacksB and Whites W, E½Y jR; W ¼ E½Y jR; B indicates the absence of bias (here, E is the expectation operator)]. The algorithm’s statedgoal is to predict complex health needs for thepurpose of targeting an intervention thatmanages those needs. Thus, we compare thealgorithmic risk score for patient i in year t(Ri,t), formed on the basis of claims data Xi,(t 1)from the prior year, to data on patients’ realized health Hi,t, assessing how well the algorithmic risk score is calibrated across race forhealth outcomes Hi,t . We also ask how well thealgorithm is calibrated for costs Ci,t .To measure H, we link predictions to a widerange of outcomes in electronic health recorddata, including all diagnoses (in the form ofInternational Classification of Diseases codes)as well as key quantitative laboratory studiesand vital signs capturing the severity of chronic illnesses. To measure C, we link predictionsto insurance claims data on utilization, including outpatient and emergency visits, hospitalizations, and health care costs. These data, andthe rationale for the specific measures of Hused in this study, are described in more detailin the supplementary materials.
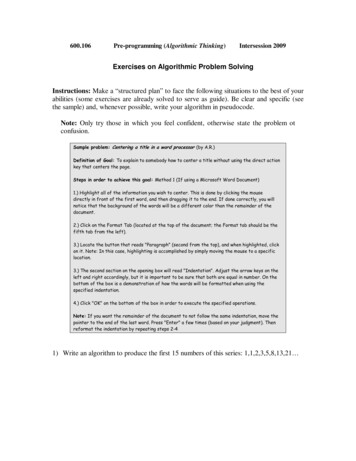
RES EARCH R E S E A R C H A R T I C L EABRaceOriginalSimulatedBlackWhiteReferred for screenDefaulted into programDefaulted into programFraction BlackNumber of active chronic conditionsReferred for screenFig. 1. Number of chronic illnesses versus algorithm-predicted risk,by race. (A) Mean number of chronic conditions by race, plotted againstalgorithm risk score. (B) Fraction of Black patients at or above a given riskscore for the original algorithm (“original”) and for a simulated scenariothat removes algorithmic bias (“simulated”: at each threshold of risk, definedat a given percentile on the x axis, healthier Whites above the threshold areof substantial disparities in program screening.We quantify this by simulating a counterfactualworld with no gap in health conditional onrisk. Specifically, at some risk threshold a, weidentify the supramarginal White patient (i)with Ri a and compare this patient’s healthto that of the inframarginal Black patient ( j )with Rj a. If Hi Hj , as measured by numberof chronic medical conditions, we replace the(healthier, but supramarginal) White patientwith the (sicker, but inframarginal) Black patient.We repeat this procedure until Hi Hj, tosimulate an algorithm with no predictive gapbetween Blacks and Whites. Fig. 1B shows theresults: At all risk thresholds a above the 50thpercentile, this procedure would increase thefraction of Black patients. For example, at a 97th percentile, among those auto-identifiedfor the program, the fraction of Black patientswould rise from 17.7 to 46.5%.We then turn to a more multidimensional picture of the complexity and severity of patients’health status, as measured by biomarkers thatindex the severity of the most common chronic illnesses in our sample (as shown in Table 1).This allows us to identify patients who mightderive a great deal of benefit from care management programs—e.g., patients with severeObermeyer et al., Science 366, 447–453 (2019)Percentile of Algorithm Risk Scorereplaced with less healthy Blacks below the threshold, until the marginal patientis equally healthy). The symbols show risk percentiles by race; circlesshow risk deciles with 95% confidence intervals clustered by patient. Thedashed vertical lines show the auto-identification threshold (the blackline, which denotes the 97th percentile) and the screening threshold (the grayline, which denotes the 55th percentile).diabetes who are at risk of catastrophic complications if they do not lower their blood sugar(18, 26). (The materials and methods sectiondescribes several experiments to rule out a largeeffect of the program on these health measuresin year t; had there been such an effect, wecould not easily use the measures to assess theaccuracy of the algorithm’s predictions on health,because the program is allocated as a functionof algorithm score.) Across all of these important markers of health needs—severity of diabetes, high blood pressure, renal failure, cholesterol,and anemia—we find that Blacks are substantially less healthy than Whites at any level ofalgorithm predictions, as shown in Fig. 2. Blackshave more-severe hypertension, diabetes, renalfailure, and anemia, and higher cholesterol.The magnitudes of these differences are large:For example, differences in severity of hypertension (systolic pressure: 5.7 mmHg) anddiabetes [glycated hemoglobin (HbA1c): 0.6%]imply differences in all-cause mortality of 7.6%(27) and 30% (28), respectively, calculated usingdata from clinical trials and longitudinal studies.Mechanism of biasAn unusual aspect of our dataset is that weobserve the algorithm’s inputs and outputs25 October 2019as well as its objective function, providing usa unique window into the mechanisms bywhich bias arises. In our setting, the algorithmtakes in a large set of raw insurance claimsdata Xi,t 1 (features) over the year t 1: demographics (e.g., age, sex), insurance type, diagnosis and procedure codes, medications, anddetailed costs. Notably, the algorithm specifically excludes race.The algorithm uses these data to predict Yi,t(i.e., the label). In this instance, the algorithmtakes total medical expenditures (for simplicity, we denote “costs” Ct) in year t as the label.Thus, the algorithm’s prediction on healthneeds is, in fact, a prediction on health costs.As a first check on this potential mechanismof bias, we calculate the distribution of realized costs C versus predicted costs R. By thismetric, one could call the algorithm unbiased.Fig. 3A shows that, at every level of algorithmpredicted risk, Blacks and Whites have (roughly) the same costs the following year. In otherwords, the algorithm’s predictions are well calibrated across races. For example, at the median risk score, Black patients had costs of 5147versus 4995 for Whites (U.S. dollars); in thetop 5% of algorithm-predicted risk, costs were 35,541 for Blacks versus 34,059 for Whites.3 of 7Downloaded from http://science.sciencemag.org/ on October 24, 2019Percentile of Algorithm Risk Score
RES EARCH R E S E A R C H A R T I C L EObermeyer et al., Science 366, 447–453 (2019)literature in psychology has documented physicians’ differential perceptions of Black patients,in terms of intelligence, affiliation (35), or paintolerance (36). Thus, whether it is communication, trust, or bias, something about the interactions of Black patients with the health caresystem itself leads to reduced use of health care.The collective effect of these many channels isto lower health spending substantially for BlackRacepatients, conditional on need—a finding that hasbeen appreciated for at least two decades (37).Problem formulationOur findings highlight the importance of thechoice of the label on which the algorithm istrained. On the one hand, the algorithm manufacturer’s choice to predict future costs is reasonable: The program’s goal, at least in part, isBlackWhiteB Diabetes severity: HbA1cA Hypertension: Fraction clinic visits with SBP 139 mmHgDefaulted into programReferred for screen Defaulted into program7.50.37.0Mean HbA1c (%)Fraction with uncontrolled blood pressureReferred for ercentile of Algorithm Risk ScoreC Bad cholesterol: LDL30405060708090100D Renal failure: creatinine (log)Referred for screen Defaulted into programReferred for screen Defaulted into programMean creatinine (log mg/dL)0.2110Mean LDL (mg/dL)20Percentile of Algorithm Risk Score1000.10.090 0.11020304050607080901000Percentile of Algorithm Risk Score102030405060708090100Percentile of Algorithm Risk ScoreE Anemia severity: hematocrit25 October 2019Referred for screen Defaulted into program45.042.5Mean Hematocrit (%)Fig. 2. Biomarkers of health versusalgorithm-predicted risk, by race. (A toE) Racial differences in a range of biologicalmeasures of disease severity, conditionalon algorithm risk score, for the most commondiseases in the population studied. The symbols show risk percentiles by race, exceptin (C) where they show risk ventiles; circlesshow risk quintiles with 95% confidenceintervals clustered by patient. The y axis in(D) has been trimmed for readability, so thehighest percentiles of values for Black patientsare not shown. The dashed vertical linesshow the auto-identification threshold (blackline: 97th percentile) and the screeningthreshold (gray line: 55th Percentile of Algorithm Risk Score4 of 7Downloaded from http://science.sciencemag.org/ on October 24, 2019Because these programs are used to targetpatients with high costs, these results are largely inconsistent with algorithmic bias, as measured by calibration: Conditional on risk score,predictions do not favor Whites or Blacks anywhere in the risk distribution.To summarize, we find substantial disparitiesin health conditional on risk but little disparityin costs. On the one hand, this is surprising:Health care costs and health needs are highlycorrelated, as sicker patients need and receivemore care, on average. On the other hand, thereare many opportunities for a wedge to creep inbetween needing health care and receivinghea
provides insight into a live, scaled algorithm deployed nationwide today. It is one of the largest and most typical examples of a class of commercial risk-prediction tools that, by industry estimates, are applied to roughly 200 million people in the United