Transcription
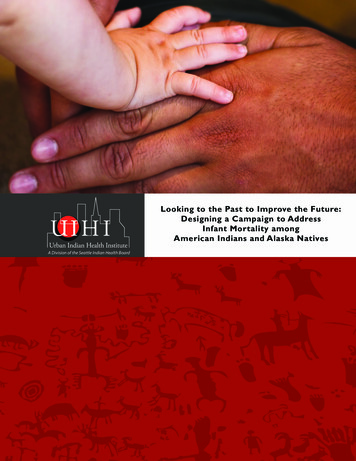
Looking to the Past to Improve the Future:Designing a Campaign to AddressInfant Mortality amongAmerican Indians and Alaska NativesA Division of the Seattle Indian Health Board
Page intentionally left blank.Looking to the past to improve the future: designing a campaign to address infant mortality amongAmerican Indians and Alaska Natives2
The mission of theUrban Indian HealthInstitute is to supportthe health andwell-being of UrbanIndian communitiesthrough information,scientific inquiry andtechnology.Recommended Citation:Urban Indian Health Institute, Seattle Indian Health Board. (2011). Looking to the Past to Improve the Future:Designing a Campaign to Address Infant Mortality among American Indians and Alaska Natives. Seattle, WA.
Page intentionally left blank.Looking to the past to improve the future: designing a campaign to address infant mortality amongAmerican Indians and Alaska Natives4
7S E C T I O N I : Introduction8S E C T I O N I I : The Need14S E C T I O N I I I : The Lessons19S E C T I O N I V : The Efforts21S E C T I O N V : Conclusions23S E C T I O N V I : References27S E C T I O N V I I : Appendix: Table of CampaignsTABLE OF CONTENTSTA B L E O F CO N T E N T SPlease contact the Urban IndianHealth Institute with yourcomments: info@uihi.orgor 206-812-3030.You can also fill out the formon page 45 with comments orquestions.ACKNOWLEDGEMENTSThe UIHI would like to gratefully acknowledge: A Division of the Seattle Indian Health BoardThis project was funded by theOffice of Minority Health. Thisproject was also funded in part bythe Indian Health Service Divisionof Epidemiology and DiseasePrevention. UIHI’s Healthy Baby Advisory Council members who providedreview and support of the workJudy Thierry in Maternal and Child Health and Inetta Tiger inOCPS with Indian Health ServiceHealthy Native Babies including Regional Coordinators forAlaska and Portland areasKendra Bowles with Native American Management Services, Inc.Wendy Jacobs with CJ Foundation for SIDSStaff of the Museum Management Program, National Park Service and the Nez Perce National Historical Park for providingthe toy cradleboard image.Looking to the past to improve the future: designing a campaign to address infant mortality amongAmerican Indians and Alaska Natives5
Page intentionally left blank.Looking to the past to improve the future: designing a campaign to address infant mortality amongAmerican Indians and Alaska Natives6
I. IntroductionAmerican Indians and Alaska Natives (AI/AN) experience some of the highest disparities in infantmortality across the country. In some areas, infant mortality rates for AI/AN are four times higher thanamong whites. The national rate for AI/AN, while higher than the general population, does not reflectthis variability and the true severity of the issue in some communities. Causes of death and risk factorsfor infant mortality within AI/AN include Sudden Infant Death Syndrome (SIDS), infections, injury,limited access to culturally appropriate health care resources, and other socioeconomic, historical andpolitical factors. Despite high rates of infant mortality, there is little evidence of effectiveness ofinterventions for AI/AN. Current approaches to infant mortality awareness and prevention in thegeneral population often do not reach AI/AN and may not be entirely appropriate for AI/AN; with afocus on different risk factors and outcomes, access to resources inaccessible for AI/AN, and lackingadequate consideration of relevant cultural factors.There are three aims for this report, which will be used towards the overall goal of informing thedevelopment of a communication campaign to increase awareness of infant mortality among AI/AN.These aims are: 1) outline the burden of infant mortality and associated risk factors and barriers toimprovement among AI/AN nationwide, 2) provide an overview of the health communication campaignsthat have been directed to this population including the range of topic areas and methods for reachingAI/AN and 3) discuss select previous and current efforts on infant mortality prevention among AI/AN.Looking to the past to improve the future: designing a campaign to address infant mortality amongAmerican Indians and Alaska Natives7
II. The NeedInfant Mortality RatesIn 2006, the infant mortality rate among AI/AN nationwide was 50%higher than in non-Hispanic (NH) –whites (8.3 and 5.6 per 1,000 births,respectively) (Matthews, 2010). State-specific data on infant mortality islimited for AI/AN due to relatively small population numbers; availabledata show a range of 6.3 to 12.3 per 1,000 live births. Infant mortalityrates among AI/AN in urban areas (8.1 per 1,000 live births) are alsohigher than rates for all races residing in the same urban areas (6.0 per1,000 live births) (Centers for Disease Control and Prevention (CDC),2001-2005; UIHI, 2009). Rates for urban-residing AI/AN differed basedon area, ranging from 3.6 to 14.3 per 1,000 live births.When infant mortality is subcategorized into neonatal mortality (deathsper live births less than 28 completed days after birth) and postneonatal mortality (deaths between 28 days and 364 days after birth)neonatal mortality rates among nationwide AI/AN are higher than NHwhites (4.3 and 3.6 per 1,000 live births respectively), but marked disparities are seen in the postneonatal period with mortality rates for AI/AN more than twice that for NH-whites (4.3 and 1.9 per1,000 live births respectively) (Matthews, 2010). In a recent study by Alexander et al, after adjustmentfor maternal risk factors, rates of post-neonatal mortality among AI/AN remained significantly higherthan whites (Alexander, 2008).Neonatal deaths are usually linked to congenital anomalies and high-risk births, which include low birthweight (LBW), preterm birth, and large for gestational age (birth weight 90th percentile of birth weightfor gestational age) births. Even after adjustment for maternal risk factors, AI/AN have higher risks thanwhites of low birth weight (5.8% and 4.9% respectively) and preterm birth (11% and 8.3% respectively)(Alexander, 2008).Looking further at the clinical conditions linked to rates of neonatal mortality, high macrosomia rates(birth weight 4000g) of 16–31% have been reported among several North American Native groups,including First Nations in Canada (Rodrigues, 2000). Additionally in 2006, rates of macrosomia werehigher among AI/AN compared to whites (9.8% and 8.7% of live births 4000g, respectively) and AI/ANhad a higher percentage of infant deaths among birth weights 4000g compared to whites (4.8% and2.2% infant deaths 4000g, respectively). The cause for the higher birth weights among AI/AN may bedue in part to the higher prevalence of maternal obesity and diabetic risk in this population, but theremay also be racial/ethnic differences in the effects of maternal diabetes on birth weight (Rodrigues,2000).Rates of post-neonatal death among AI/AN are also likely impacted by higher birth weight/gestationalage specific mortality rates seen in this group. In data from 1995-2001, the mortality rate amongmothers at 42 weeks and infants 4250g among AI/AN was 3.0 compared to 1.5 per 1,000 live birthsamong whites (Alexander, 2008). In data from 2006 on gestational age independent from birth weight,infant mortality rates were higher among AI/AN mothers when compared with NH-white mothers atboth 34–36 weeks of gestation (9.7 and 6.6 per 1,000 live births) and 37–41 weeks of gestation,considered ―term‖ (4.9 and 2.2 per 1,000 live births) (Matthews, 2010).Looking to the past to improve the future: designing a campaign to address infant mortality amongAmerican Indians and Alaska Natives8
II. The NeedCauses of deathExamination of cause-specific death rates show that AI/ANhave significantly higher rates than NH-whites for three of thefour leading causes of infant mortality, including: congenitalanomalies, SIDS, and unintentional injuries. Cause-specific deathrates among AI are still significantly increased above whites forperinatal conditions, SIDS, injury and infections afteradjustment for maternal risk factors (Alexander, 2008).The SIDS rate among AI/AN is 115% higher than for NHwhites (119.4 and 55.6 per 100,000 live births respectively),with an increase from 2005 to 2006 among AI/AN. Depending on the region, the rate of SIDS is 2 to 4times greater than for the U.S. population (U.S. Department of Health and Human Services (U.S.DHHS), 2002). Among AI/AN in urban areas, the SIDS rate is 80.0 compared to 30.0 per 100,000 livebirths among all races (CDC, 1996-2005).Historically, AI/AN have the highest risk for unintentional injury mortality compared to other races(Tomashek, 2006; Jain, 2001; Overpeck, 1999). For AI/AN, infant mortality rates from unintentionalinjuries are triple those for NH-whites (Matthews, 2010). One study found that AI continued to have anincreased risk for both homicide and fatal unintentional injuries even after adjusting for multiple sociodemographic risk factors (adjusted odds ratio 1.6 and 2.1, respectively) (Jain, 2001). Authors also notethat results may be conservative estimates of the incidence of injury related deaths based on knownmisclassification of AI/AN in vital records (Stehr-Green, 2002; Epstein, 1997).Respiratory distress related to influenza or pneumonia is also a cause of increased infant mortality ratesamong AI/AN with risk increasing as birth weight decreases in general (Singleton, 2009). In a recentstudy, infant deaths from lower respiratory tract infections (LRTI) were highest among AI/AN comparedwith white infants, and disparities persisted among infants with birth weight at 2500g and those whodid receive early prenatal care (Singleton, 2009).Risk factors for poor birth outcomesWhen looking at risk factors for poor birth outcomes among live births, American Indian and AlaskaNative mothers are more likely to be unmarried, less than 18 years old, to have pregnancy inducedhypertension, diabetes, and to smoke or drink alcohol compared to whites (Alexander, 2008).Obesity, gestational diabetes, and types 1 and 2 diabetes, which are prevalent among American Indianand Alaska Native women, are independently associated with an increased risk of large for gestationalage births, preterm births, birth injury, and macrosomia (Reece, 2009; Sayers, 2009; Ben-Haroush,2009). Further, there is a threefold to fourfold increase in major congenital anomalies occurring inwomen with these conditions and even higher absolute and relative risks for particular malformations,such as neural tube defects.Disparities in risk factors among AI/AN in urban areas compared to the general population in the sameareas are similar and include the rate of births to: teenage mothers (6.2% and 3.1%, respectively),unmarried women (63.6% and 35.3%, respectively), women who received late to no prenatal care (8.2%and 3.9%, respectively), and women who consumed alcohol (3.2% and 0.9%, respectively) or smokedwhile pregnant (15.0% and 8.0%, respectively). Additionally, in examinations of national survey data,urban AI/AN have higher rates of teen pregnancies, unintended pregnancies and mistimed pregnanciesthan NH-whites (Rutman, 2008; UIHI, 2010).Looking to the past to improve the future: designing a campaign to address infant mortality amongAmerican Indians and Alaska Natives9
II. The NeedBarriers to careRegarding access to prenatal care, American Indian and Alaska Nativewomen face numerous barriers which may include conflict betweentraditional beliefs and practices and the Western model of care, andprovider characteristics such as disrespect, hostility, and paternalism(Long, 1998). Perceived racial prejudices in healthcare delivery have alsobeen found to negatively affect women‘s protective health behaviors(Thorburn, 2005). These may compound personal barriers, such as fearthat substance use will be detected or presumed, fear of medicalproviders and procedures, prior negative experiences with the healthsystem, and the belief in the ―naturalness of pregnancy‖(Long, 1998).Urban AI/AN face several additional challenges when trying to access quality health care in general andmaternal and child health services in particular. Documented challenges include time constraints, distrustof government programs, costs associated with travel to receive government-provided health care, andlack of transportation and child care (Kaiser Family Foundation, 2004; UIHI, 2009). Additionally, many ofthose seeking treatment at urban clinics are poor and uninsured, and Medicaid covers only part of theircare (UIHI, 2009). A majority of urban AI/AN are not eligible for or are unable to utilize health servicesoffered through the Indian Health Service or Tribes, so urban Indian health organizations (UIHO; seedescription in box below) are essential for this population (Urban Indian Health Commission, 2007).However, these urban programs receive only 1 percent of the Indian health budget and often struggle toobtain and maintain the funding, resources and infrastructure needed to serve the growing population ofAI/AN, as described further in the next section.URBAN INDIAN HEALTH ORGANIZATIONS (UIHO)Urban Indian Health Organizations (UIHO) are private, non-profit corporations that are governed byIndian majority Boards of Directors and serve as service and social hubs for Indian identity andrecognition in select cities. Today, UIHO are most often affiliated with contractual agreements withthe federal Indian Health Service under Title V of the 1976 Indian Health Care Improvement Act.UIHO range in size and services from small information and referral sites to large community healthcenters offering medical and dental services and that are part of local safety net provider networks forthe uninsured and poverty communities. UIHO serve individuals in approximately 102 U. S. countiesin 19 states, and manage to provide services to more than 150,000 clients each year.Often seen as centers for cultural activities and identity, UIHO offer AI/AN living in these urban areasa place where they can receive health information and services in a culturally appropriate manner.In a 2006 survey of maternal, infant and child health services at UIHO, participating sites reportedshortages in OBGYN providers and funding for related-services, and limited funding for an OB providerwas also reported as a barrier to care for pregnant women (UIHI, 2009). Of the 23 sites that provideddata on provision of services, the majority reported providing onsite and/or referral for pregnancy andinfant health services such as pre/inter-conception care, immunizations, well-child visits and parentingsupport. However, between 22% and 35% of sites did not offer or refer clients for maternity casemanagement, childbirth classes, home visits/public health nurse visits and SIDS counseling. Greater than17% of sites did not offer or refer clients for newborn screening and lactation support. Also, the needfor prenatal dental care providers was specifically mentioned by UIHO and was reported as an unmetneed by both clients and providers. Studies show that mothers‘ oral health directly affects the outcomeof their pregnancies and their infants‘ health (Jeffcoat, 2003; Offenbacher, 2003; Reed, 2003).Looking to the past to improve the future: designing a campaign to address infant mortality amongAmerican Indians and Alaska Natives10
II. The NeedGrossman and colleagues also concluded in an earlier study that althoughUIHO existed in most cities with large birth counts, many had inadequateresources to meet existing needs to improve perinatal outcomes andinfant health (Grossman, 2002). Although direct medical care or outreachservices for urban AI/AN are available, in some cases the amount of needfor care and the services available were not necessarily compatible. Forexample, in the case of the Los Angeles-Orange metropolitan area, directprenatal care services were not offered through an UIHO despite havingthe highest number of American Indian and Alaska Native births amongmetropolitan areas.Variations by metropolitan status and regionOf the total U.S. population, 4.1 million (1.5%) identified themselves asbeing American Indian or Alaska Native on the 2000 U.S. Census, whichincludes Hispanic people who identify themselves as being of AmericanIndian or Alaska Native descent, either alone or in combination with another race (US Census, 2000).Of the 4.1 million AI/AN, 2.5 million (0.9% of the total U.S. population) identified themselves as beingsolely American Indian or Alaska Native. The 11 states with the largest American Indian and AlaskaNative populations were California, Oklahoma, Arizona, Texas, New Mexico, New York, Washington,North Carolina, Michigan, Alaska, and Florida.Approximately 67% of AI/AN live in urban areas. Urban AI/AN are a very diverse group, and includemembers, or descendents of members, of many different tribes. Represented tribes may or may not befederally recognized, and individuals may or may not have historical, cultural, or religious ties to theirTribal communities. Individuals may travel back and forth between their tribal communities orreservations on a regular basis, and the population as a whole is quite mobile (Lobo, 2003). UrbanAI/AN are also generally spread out within the urban center instead of localized within one or twoneighborhoods, and thus are often not seen or recognized by the wider population.Documented variations in birth outcomes among AI/AN residing in urban settings include a twofoldincrease in infant mortality rates from 1981–1990 among AI/AN living in an urban area (Grossman,1994). Also, from 1995 to 2000, infant mortality rates among urban AI/AN were higher than rates forthe corresponding general populations and did not decrease despite significant decreases in the generalpopulations in the same urban areas (Castor, 2006).Higher rates of low birth weight have also been reported among urban American Indian and AlaskaNative infants compared to urban white infants (Grossman, 1994; Grossman, 2002; Baldwin 2002); andpremature birth rates for urban AI/AN are higher than those of all races (13.8% of live births amongAI/AN and 11.8% among all races in the same areas) (CDC, 2002-2006).Regional differences are seen in Indian Health Service (IHS) data reports. The IHS reported an infantmortality rate for the service area population in 1999-2001of 8.8 deaths per 1,000 live births. The rateamong AI/AN was 28% higher than the rate for all races in 2000 (6.9 deaths per 1,000 live births). Thetwo IHS Areas with the highest rates (Aberdeen: 13.4 and Alaska: 10.8 per 1,000 live births) exceededthe all races rate by over 50%; the lowest rate was in the Albuquerque area with a rate of 6.8 per 1,000live births. These rates are adjusted for misreporting of American Indian and Alaska Native race on thestate death certificate (U.S. DHHS, 2002-2003).Looking to the past to improve the future: designing a campaign to address infant mortality amongAmerican Indians and Alaska Natives11
II. The NeedA regional analysis of infant mortality by Alexander et al also confirmsthat AI are not a homogeneous group in terms of birth outcomes. Intheir analysis, the 12 IHS areas were combined to form three regions:West, South/Northeast and Mid-West (Alexander, 2008). Using theWest region as a reference group, the South/Northeast region hadmore low birth weight and very preterm problems and higher risk formortality related to perinatal conditions. The Mid-West had the highestrisks of infant mortality, with higher birth weight/gestational age specificmortality rates and higher risks for SIDS.Although a recent publication cites an improvement in infant mortalityrates among AI/AN in the Pacific Northwest between 1990-97,examinations of more recent data in this region (2000-04) using thePerinatal Periods of Risk approach, found an overall fetal-infantmortality rate (FIMR) for AI/AN of 13.0 compared to 7.6 per 1,000 livebirths in the reference group (CityMatCH, 2004; Gaudino, 2008; Barkan, personal communication, 2007;Pyle, 2008). The FIMR includes fetal and infant deaths occurring 24 weeks of gestation and birthweight 500 grams. The PPOR approach, a joint venture by the CDC, the Maternal and Child HealthBureau and CityMatCH, may be a promising method for further examinations of infant mortality amongAI/AN within different regions, as it provides results that are simply communicated to communitypartners and promotes community-initiated interventions to address categorized risks by salient periodsfor a particular population. Among AI/AN in the Pacific Northwest, the periods with the highestcontribution to excess or preventable fetal-infant deaths were infant health (excess rate of 4.64 deathsper 1,000) and maternal health/prematurity (excess rate of 0.96 per 1,000). These findings suggest theneed for programs that support post-neonatal infant health, such as SIDS risk reduction, access to healthcare, injury prevention, maternal social support and a focus on pre-conception health, post-neonatalhealth behaviors, the need for early and continuous prenatal care services, and referral and managementcontinuity for high-risk pregnancies.Rates of late prenatal care and inadequate prenatal care utilization also varied by region and state bothfor AI/AN and for NH-whites in a recent study (Johnson, 2010). The Midwest generally had the widestAI/AN–white disparities for both indicators. When focused on the 12 states with the largest AI/ANbirth populations, changes in disparities in prenatal care utilization varied dramatically, with some statesshowing substantial reductions in disparities and other states showing marked increases in disparities.Authors suggest that additional research is warranted to understand the causes and consequences ofstate-specific or local-area disparities in prenatal care utilization for AI/AN.The variable rates of infant mortality, birth outcomes and risk factors among AI/AN nationwide suggestthat consistent surveillance and in-depth examinations are needed to better understand what is causingthese differences. It also suggests that a one-size fits all approach to addressing infant mortality amongAI/AN may not be successful.Socioeconomic, cultural and historical factors for AI/ANThe role of socioeconomic and other contextual factors for poor perinatal outcomes in AI/AN shouldbe included in any effort to address infant mortality, as these broad, overarching factors affectcommunities regardless of geographic location or other individual risk factors. The socioeconomicdisparities between AI/AN and the general population are well known, with high rates of unemploymentand poverty and low levels of education among a host of other factors. Castor et al also found higherrates of disability, more single parent households, higher rates of poverty, lower levels of formaleducation, and higher unemployment among urban AI/AN (Castor, 2006).Looking to the past to improve the future: designing a campaign to address infant mortality amongAmerican Indians and Alaska Natives12
II. The NeedThe failure of a recent study to see an effect of neighborhood povertyon infant death among AI/AN highlights the challenge of isolating selectrisk factors from other interrelated factors for AI/AN, which are alsoindependently associated with poor outcomes (Johnson, 2008). Peoplein positions of lower relative socioeconomic status often have increasedrates of high-risk behaviors, acute and chronic stress, depression andlower levels of social support (Williams, 2005). Among AI/AN forexample, the conflict between the search for employment and socialnetworks in other geographic areas, often results in poor socialsupport and higher levels of stress. In one study of AI/AN in the PacificNorthwest, travel to reservations from urban areas was related togreater identification with Native culture and an absence of mental health problems, while urban livingwas associated with less social support (Rhoades, 2005).In addition to the socioeconomic factors, the complex shared history of trauma from numerousincivilities done to AI/AN through federal policies enacting colonialism and cultural genocide, have had alasting negative impact on traditional social networks among other issues, affecting all American Indianand Alaska Native communities (Brave Heart, 1998; Northwest Community Alliance, 2005). Thereportedly decreased level of social support among AI/AN may be directly linked to poor healthoutcomes (Pearce, 2003).American Indian and Alaska Native mothers also experience a disproportionate number of stressful lifeevents during pregnancy; particularly as related to financial stressors and traumatic stressors (substanceor physical abuse, incarceration, or homelessness) (Lu, 2004; Smith, 2008; Hutchinson, personalcommunication, 2009). Furthermore, chronic exposure to stressful life circumstances over the course ofa woman‘s life increases the cumulative allostatic load hypothesized to impact birth outcomes (Lu,2003).The numerous risk factors for poor birth outcomes together with the unique political status, history anddiversity of the American Indian and Alaska Native population underscores the importance ofincorporating the multifaceted nature of infant mortality among AI/AN in any attempt to address it.Data limitations for AI/ANHistorically, there has been a great amount of difficulty finding statistics on AI/AN; a difficulty that isexacerbated in urban settings (Cross, 2004). Racial misclassification is a common barrier inepidemiologic studies including AI/AN and almost always results in AI/AN being misclassified as Hispanic,Asian, or white (Cross, 2004). Similarly, racial misclassification consistently results in underestimates ofdisease-related morbidity and mortality (Stehr-Green, 2002). This is a rampant problem among birth anddeath certificates, disease registries, and schools. One study reported an estimated one-third ofAmerican Indian and Alaska Native children are misidentified or not identified correctly as AI/AN(Epstein, 1997). Though the Indian Health Service (IHS) and others have attempted to adjust rates toreflect a more accurate population count, there remains a need to standardize the method forcalculating American Indian and Alaska Native population rates; a need that is unaddressed in state vitalstatistics records. These limitations should be considered when reviewing rates of infant mortality forAI/AN, as they are likely underestimated, and therefore downplay the true rate of infant mortality forAI/AN.Looking to the past to improve the future: designing a campaign to address infant mortality amongAmerican Indians and Alaska Natives13
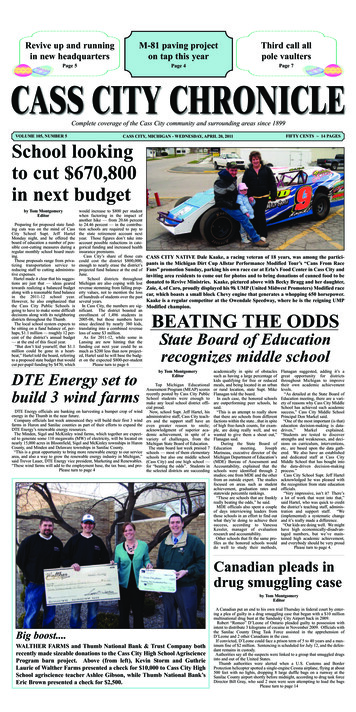
III. The LessonsHealth communication campaigns among AI/ANThere are a variety of activities, which could be used to address the significant disparities in infantmortality experienced by AI/AN. Some of these categories and examples of each in American Indianand Alaska Native communities include:primary healthcare interventions for individual patients; an example is the federally funded Vaccines forChildren program, which provides free vaccines for AI/AN (Teitelbaum, 1999);community based interventions such as support groups with education on infant mortality and SIDS; anexample is a traditional cradleboard class taught by the Native American Women‘s Dialogue on InfantMortality (NAWDIM) (see description of cradleboards in box below) (NAWDIM, n.d.), andlegislative interventions; such as the recent Patient Protection and Affordable Care Act: Maternal, Infantand Early Childhood Home Visiting Program, which provides infrastructure and support to States for acoordinated system of early childhood home visiting.This section of the report is focused on another category referred to as health communication campaigns.The campaigns are not isolated efforts, but operate alongside the important work of health careproviders, local and national activists, policy makers, and others who are involved in addressing thehealth of American Indian and Alaska Native communities. This review offers a snapshot of some of themore prominent health communication campaigns focused on AI/AN and brings together insights ontheir approaches to addressing the needs of AI/AN and ways of communicating with this uniquepopulation.A cradleboard is a babycarrier used by AmericanIndians and Alaska Natives tokeep babies safe, secure andcomfortable while at thesame time allowing themothers freedom to workand travel. They consist of aframe made of naturalmaterials and are decoratedwith materials and in a stylethat varies from tribe totribe. It is flexible in use,decorative and protective.Cradleboards should not beused in lieu of car seats.Toy cradleboard imageBison (Bos bison) Buckskin, wood, tradecloth, glass beads, hair. L 68.3, 31.2 cmImage: National Park Service, Museum Management Program and Nez Perce National Historical Park,Toy Cradleboard, NEPE 1629. Available at: www.cr.nps.gov/museum.Looking to the past to improve the future: designing a campaign to address infant mortality amongAmerican Indians and Alaska Natives14
III. The LessonsCampaign review methodsThere is often confusion with the terminology used for campaigns, for example language such ascommunication campaign or program, media or mass media campaign, and intervention are often seen inthe literature. No particular definition adequately covers current practice, and there are many variationsof what is meant by these terms. A variety of definitions exists in the literature, but the followingelements of a communication campaign were used for the purpose of this review (Rogers, 1987): planned to generate specific outcomes; aims to reach a relatively large number of individuals; includes a specified time period; and uses an organized set of communication activities.While communication campaigns specifically on infant mortality or infant health were the initial focus ofthis rev
Sep 07, 2007 · Looking to the past to improve the future: designing a campaign to address infant mortality among American Indians and Alaska Natives 7 American Indians and Alaska Natives (AI/AN) experience some of the highest disparities in infant mortality across the country. In some areas, in